News
capire se ha senso da un'altra parte e qual è il criterio di aggiornamento, non si può chiamare news se è tutto vecchio dentro
News
capire se ha senso da un'altra parte e qual è il criterio di aggiornamento, non si può chiamare news se è tutto vecchio dentro
Assistiamo ogni giorno i nostri Clienti e ci aggiorniamo costantemente per fornire un’assistenza completa.
Diamo per scontato che vi aggiornate, no professionalità ma cosa risolviamo/per chi
I nostri servizi di consulenza
non servizi di consulenza ma gli ambiti in cui operate Next Audit e Pomezia, banner separati
La soluzione per chi cerca un team di professionisti per il raggiungimento dei più importanti obiettivi aziendali.
Piuttosto quando siamo necessari
Hello ! Si je peux me permettre, je trouve ça dommage que les liens cliquants sur l'ensemble de la page ne s'ouvrent pas dans de nouveaux onglets. on doit faire retour à chaque fois, et la page n'a pas gardé notre progression... Merci pour ce que vous faites :)
fuentes de la investigación
Aquí se deben presentar las fuentes usadas durante la investigación en formato APA 7.
También es importante reconocer el lugar o contexto en donde se realizará la investigacióny el tiempo en que se desarrollará.
El espacio y la duración de la investigación deben considerarse desde la planificación del estudio.
explica el porqué de la investigación: por qué elproyecto es importante y necesario.
La justificación explica la importancia y necesidad de llevar a cabo la investigación.
son lasguías del estudio y durante todo su desarrollo deben procurarse.
Los objetivos orientan el desarrollo de la investigación y deben plantearse de manera coherente y alcanzable para guiar adecuadamente el estudio a lo largo de todo el proceso.
Responde ala pregunta central de investigación
Se vincula directamente con la pregunta central de la investigación y orienta el estudio hacia la solución del problema planteado.
pregunta central de investigación
La formulación del problema deriva de la idea de investigación y se expresa mediante preguntas que orientan el desarrollo del estudio.
se debe profundizar en el contexto de lasituación, incluyendo a quién o quiénes les afecta y sus implicaciones.
El enunciado indica que es necesario analizar la situación en su contexto, considerando a quiénes involucra y los efectos que esta genera.
De la idea refinada de investigación nace el título de la investigación y se condensa en unafrase que exprese la esencia de la idea.
El título de la investigación nace de una idea claramente delimitada y debe expresar la esencia del estudio.
profundizar en el tema,acudiendo a la revisión de la literatura
Se destaca la importancia de profundizar un tema mediante la revisión de la literatura, ya que este proceso permite delimitar, contextualizar y fundamentar adecuadamente el problema de investigación
Note: This response was posted by the corresponding author to Review Commons. The content has not been altered except for formatting.
Learn more at Review Commons
We are grateful for the reviewers' constructive comments and suggestions, which contributed to improving our manuscript. We are pleased to see that our work was described as an "interesting manuscript in which a lot of work has been undertaken". We are also encouraged by the fact that the experiments were considered "on the whole well done, carefully documented, and support most of the conclusions drawn," and that our findings were viewed as providing "mechanistic insight into how HNRNPK modulates prion propagation" and potentially offering "new mechanical insight of hnRNPK function and its interaction with TFAP2C."
We conducted several new experiments and revised specific sections of the manuscript, as detailed below in the point-by-point response in this letter.
Reviewer #1 (Evidence, reproducibility and clarity (Required)):
The paper by Sellitto describes studies to determine the mechanism by which hnRNPK modulates the propagation of prion. The authors use cell models lacking HNRNPK, which is lethal, in a CRISPR screen to identify genes that suppress lethality. Based on this screen to 2 different cell lines, gene termed Tfap2C emerged as a candidate for interaction with HNRNPK. The show that Tfap2C counteracts the actions of HNRNPK with respect to prion propagation. Cells lacking HNRNPK show increased PrPSc levels. Overexpression of Tfap2C suppesses PrPSc levels. These effects on PrPSc are independent of PrPC levels. By RNAseq analysis, the authors hone in on metabolic pathways regulated by HNRPNK and Tfap2C, then follow the data to autophagy regulation by mTor. Ultimately, the authors show that short-term treatments of these cell models with mTor inhibitors causes increased accumulation of PrPSc. The authors conclude that the loss of HNRNPK leads to a reduced energy metabolism causing mTor inhibition, which is reduces translation by dephosphorylation of S6
Major comments:
1) Fig H and I, Fig 3L. The interaction between Tfap2C and HNRNPK is pretty weak. The interaction may not be consequential. The experiment seems to be well controlled, yielding limited interaction. The co-ip was done in PBS with no detergent. The authors indicate that the cells were mechanically disrupted. Since both of these are DNA binding proteins, is it possible that the observed interaction is due to the proximity on DNA that is linking the 2 proteins, including a DNAase treatment would clarify.
Response: We agree that the observed co-IP between Tfap2c and hnRNP K is weak (previous Fig. 2H-I, Supp. Fig. 3L now shifted in Supp. Fig. 4C-E), and we have now highlighted this in the relevant section of the manuscript to reflect this observation better.
Importantly, the co-IP was performed using endogenous proteins without overexpression or tagging, which can sometimes artificially enhance protein-protein interactions. However, we acknowledge that the use of a detergent-free lysis buffer and mechanical disruption alone may have limited nuclear protein extraction and solubilization, potentially contributing to the low co-IP signal.
To address the reviewer's concerns and clarify whether the observed interaction could be DNA-mediated, we repeated the co-IP experiments under low-detergent conditions and included benzonase nuclease treatment to digest nucleic acids (Fig. 2H-I). DNA digestion was confirmed by agarose gel electrophoresis (Supp. Fig. 4F-G). Additionally, we performed the reciprocal IPs using both hnRNP K and Tfap2c antibodies (Fig. 2H-I). Although the level of co-immunoprecipitation remains modest, these updated experiments continue to demonstrate a specific co-immunoprecipitation between Tfap2c and hnRNP K, independent of DNA bridging. These additional controls and experimental refinements strengthen the validity of our findings. These results are also attached here for your convenience.
2) Supplemental Fig 5B - The western blot images for pAMPK don't really look like a 2 fold increase in phosphorylation in HNRNPK deletion.
Response: We thank the reviewer for raising this point. We re-examined the original pAMPK western blot (previously Supp. Fig. 5B; now presented as Supp. Fig. 6B) and confirmed the reported results. We note that the overall loading is not perfectly uniform across lanes (as suggested by the actin signal), which may affect the visual impression of band intensity. However, the phosphorylation change reported in the manuscript is based on the pAMPK/total AMPK ratio, which accounts for differences in AMPK expression and accurately reflects relative phosphorylation levels. To further address this concern, we performed three additional independent experiments. These new data reproduce the increase in pAMPK/AMPK upon HNRNPK deletion and are now included in the revised Supplementary Fig. 6B, together with the updated quantification. The new blot and the quantification are also attached here for your convenience.
3) Fig. 5A - I don't think it is proper to do statistics on an of 2.
Response: We believe the reviewer's comment refers to Fig. 5B, as Fig. 5A already has sufficient replication. We have now added two additional replicates, bringing the total to four. The updated statistical analysis corroborates our initial results. The new quantification is provided in the revised manuscript (Fig. 5B) along with the new blot (Supp. Fig. 6C). Both data are also attached here for your convenience.
4) Fig 6D. The data look a bit more complicated than described in the text. At 7 days, compared to 2 days, it looks like there is a decrease in % cells positive for 6D11. Is there clearance of PrPSc or proliferation of un-infected cells?
Response: We have now reworded our text in the results paragraph as follows:
"These data show that TFAP2C overexpression and HNRNPK downregulation bidirectionally regulate prion levels in cell culture."
We have now also included the following comments in the discussion section:
"However, prion propagation relies on a combination of intracellular PrPSc seeding and amplification, as well as intercellular spread, which together contribute to the maintenance and expansion of infected cells within the cultured population. In this study, we were limited in our ability to dissect which specific steps of the prion life cycle are affected by TFAP2C. We also cannot fully exclude the possibility that TFAP2C overexpression influenced the relative proliferation of prion-infected versus uninfected cells in the PG127-infected HovL culture, thereby contributing to the observed reduction in the percentage of 6D11+ cells and overall 6D11+ fluorescence. However, we did not observe any signs of cell death, growth impairment, or increased proliferation under TFAP2C overexpression in PG127-infected HovL cells compared to NBH controls (data not shown). This suggests that a negative selective pressure on infected cells or a proliferative advantage of uninfected cells is unlikely in this context".
5) The authors might consider a different order of presenting the data. Fig 6 could follow Fig. 2 before the mechanistic studies in Figs 3-5.
Response: We believe that the current order of presenting the data is more appropriate. The first part of the manuscript focuses on the genetic and functional interactions between hnRNP K and its partners, particularly TFAP2C, which is a critical point for understanding the broader context before delving into the mechanistic studies involving prion-infected cells.
6) The authors use SEM throughout the paper and while this is often used, there has been some interest in using StdDev to show the full scope of variability.
Response: We chose to use SEM as it reflects the precision of the mean, which is central to our statistical comparisons. As the reviewer notes, this is a common and appropriate practice. To address variability, almost all graphs already include individual data points, which provide a direct visual representation of data spread. To further enhance clarity, we have now included StdDev in the Supplementary Source Data table of the revised manuscript.
Discussion:
The discrepancy between short-term and long-term treatments with mTor inhibitors is only briefly mentioned with a bit of a hand-waving explanation. The authors may need a better explanation.
Response: We have now integrated a more detailed explanation in the discussion section of the revised manuscript as follows:
"Previous studies showed that mTORC1/2 inhibition and autophagy activation generally reduce, rather than increase, PrPSc aggregation (79, 80). The reason for this discrepancy remains unclear and may be multifactorial. First, most prior studies were based on long-term mTOR inhibition, whereas our work examined acute inhibition, mimicking the time frame of HNRNPK and TFAP2C manipulation. Acute inhibition may trigger transient metabolic or signaling shifts that differ from adaptive changes associated with mTOR chronic inhibition, potentially overriding autophagy's effects on prion propagation. Additionally, while previous works were primarily conducted in murine in vivo models, our study focused on a human cell system propagating ovine prions. Differences in species background, model complexity (e.g., interactions between different cell types), and prion strain variability, as certain strains exhibit distinct responses to autophagy and mTOR modulation (https://doi.org/10.1371/journal.pone.0137958), likely contributed to the observed differences".
Minor comments:
Page 12 - no mention of chloroquine in the text or related data.
Page 12 - Supp. Fig. E - should be 5E
Response: We thank the reviewer for pointing this out. We have now better highlighted the use of chloroquine in Fig. 5B (see reviewer #1 - Point 3 - Major comments) and in the text as follows:
"Furthermore, in the presence of chloroquine, LC3-II levels rose almost proportionally across all conditions (Fig. 5B), suggesting that the effects of HNRNPK and TFAP2C on autophagy occur at the level of autophagosome formation, rather than autophagosome-lysosome fusion and degradation."
We have corrected the reference to Supp. Fig. 5E.
Reviewer #1 (Significance (Required)):
The study provides mechanistic insight into how HNRNPK modulates prion propagation. The paper is limited to cell models, and the authors note that long term treatment with mTor inhibitors reduced PrPSc levels in an in vivo model.
The primary audience will be other prion researchers. There may be some broader interest in the mTor pathway and the role of HNRNPK in other neurodegenerative diseases.
Reviewer #2 (Evidence, reproducibility and clarity (Required)):
The manuscript "Prion propagation is controlled by a hierarchical network involving the nuclear Tfap2c and hnRNP K factors and the cytosolic mTORC1 complex" by Sellitto et al aims to examine how heterogenous nuclear ribonucleoprotein K (hnRNPK), limits pion propagation. They perform a synthetic - viability CRISPR- ablation screen to identify epistatic interactors of HNRNPK. They found that deletion of Transcription factor AP-2g (TFAP2C) suppressed the death of hnRNP-K depleted LN-229 and U-251 MG cells whereas its overexpression hypersensitized them to hnRNP K loss. Moreover, HNRNPK ablation decreased cellular ATP, downregulated genes related to lipid and glucose metabolism and enhanced autophagy. Simultaneous deletion of TFAP2C reversed these effects, restored transcription and alleviated energy deficiency. They state that HNRNPK and TFAP2C are linked to mTOR signalling and observe that HNRNPK ablation inhibits mTORC1 activity through downregulation of mTOR and Rptor while TFAP2C overexpression enhances mTORC1 downstream functions. In prion infected cells, TFAP2C activation reduced prion levels and countered the increased prion propagation due to HNRNPK suppression. Pharmacological inhibition of mTOR also elevated prion levels and partially mimicked the effects of HNRNPK silencing. They state their study identifies TFAP2C as a genetic interactor of HNRNPK and implicates their roles in mTOR metabolic regulation and establishes a causative link between these activities and prion propagation.
This is an interesting manuscript in which a lot of work has been undertaken. The experiments are on the whole well done, carefully documented and support most of the conclusions drawn. However, there are places where it was quite difficult to read as some of the important results are in the supplementary Figures and it was necessary to go back and forth between the Figs in the main body of the paper and the supplementary Figs. There are also Figures in the supplementary which should have been presented in the main body of the paper. These are indicated in our comments below.
We have the following questions /points:
Major comments:
1) A plasmid harbouring four guide RNAs driven by four distinct constitutive promoters is used for targetting HNRNPK- is there a reason for using 4 guides- is it simply to obtain maximal editing - in their experience is this required for all genes or specific to HNRNPK?
Response: The use of four guide RNAs driven by distinct promoters is chosen to maximize editing efficiency for HNRNPK. As previously demonstrated by J. A. Yin et al. (Ref. 32), this system provides better efficiency for gene knockout (or activation). For HNRNPK, achieving full knockout was crucial for observing a complete lethal phenotype, which made the four guide RNAs approach fundamental. However, other knockout systems, while potentially less efficient, have been shown to work well in other circumstances. We have now included this explanation in the revised manuscript as follows:
"We employed a plasmid harboring quadruple non-overlapping single-guide RNAs (qgRNAs), driven by four distinct constitutive promoters, to target the human HNRNPK gene and maximize editing efficiency in polyclonal LN-229 and U-251 MG cells stably expressing Cas9 (32)."
2) Is there a minimal amount of Cas9 required for editing?
Response: We did not observe a correlation between Cas9 levels and activity, yet the C3 clone was the one with higher Cas9 expression and higher activity (Supp. Fig. 1A-B). We agree that comments about the amount of Cas9 expression may be misleading here. Thus, in the first result paragraph of the revised manuscript, we have now modified the text "we isolated by limiting dilutions LN-229 clones expressing high Cas9 levels" to "we isolated by limiting dilutions LN-229 single-cell clones expressing Cas9".
3) It is stated that cell death is delayed in U251-MG cells compared to LN-229-C3 cells- why? Also, why use glioblastoma cells other than that they have high levels of HNRNPK? Would neuroblastoma cells be more appropriate if they are aiming to test for prion propagation?
Response: As shown in Fig. 1A, U251-MG cells reached complete cell death at day 13, while LN-229 C3 reached it already at day 10. The percentage of viable U251-MG cells is higher (statistically significant) than LN-229 C3 cells at all time points before day 13, when both lines show complete death. The underlying reasons for this partial and relative resistance are probably multiple, but we clearly showed in Fig. 2 that TFAP2C differential expression is one modulator of cell sensitivity to HNRNPK ablation.
We selected glioblastoma cells because their high expression of HNRNPK was essential for developing our synthetic lethality screen strategy, and we have now clarified it in the revised manuscript as follows:
"As model systems, we chose the human glioblastoma-derived LN-229 and U-251 MG cell lines, which express high levels of HNRNPK (2, 3), a key factor for optimizing our synthetic lethality screen."
While neuroblastoma cells might be more relevant in terms of prion neurotoxicity, glial cells, despite their resistance to prion toxicity, are fully capable of propagating prions. Prion propagation in glial cells has been shown to play crucial roles in mediating prion-dependent neuronal loss in a non-autonomous manner (see 10.1111/bpa.13056). This makes glioblastoma cells a valuable model for studying prion propagation (that is the focus of our study), despite the lack of direct toxicity (which is not the focus of our study). We have now added this explanation to the revised manuscript as follows:
"Therefore, we continued our experiments using LN-229 cells, which provide a relevant model for studying prions, as glial cells can propagate prions and contribute to prion-induced neuronal loss through non-cell-autonomous mechanisms."
4) Human CRISPR Brunello pooled library- does the Brunello library use constructs which have four independent guide RNAs as used for the silencing of HNRPNK?
Response: No, the Human CRISPR Brunello pooled library does not use constructs with four independent guide RNAs (qgRNAs). Instead, each gene is targeted by 4 different single-guide RNAs (sgRNAs), each expressed on a separate plasmid. We have now clarified this in the main text of the revised manuscript as follows:
"To identify functionally relevant epistatic interactors of HNRNPK, we conducted a whole-genome ablation screen in LN-229 C3 cells using the Human CRISPR Brunello pooled library (33), which targets 19,114 genes with an average of four distinct sgRNAs per gene, each expressed by a separate plasmid (total = 76,441 sgRNA plasmids)."
5) To rank the 763 enriched genes, they multiply the -log10FDR with their effect size - is this a standard step that is normally undertaken?
Response: The approach of ranking hits using the product of effect size and statistical significance is a well-established method in CRISPR screening studies. This strategy has been explicitly used in high-impact work by Martin Kampmann and others (see https://doi.org/10.1371/journal.pgen.1009103 and https://doi.org/10.1016/j.neuron.2019.07.014 as references). We have now added both references to the revised manuscript.
6) The 32 genes selected- they were ablated individually using constructs with one guide RNA or four guide RNAs?
Response: The 32 genes selected were ablated individually using constructs with quadruple-guide RNAs (qgRNAs), as this approach was intended to maximize editing efficiency for each gene. We have now clarified this in the main text of the revised manuscript as follows:
"We ablated each gene individually using qgRNAs and then deleted HNRNPK."
7) The identified targets were also tested in U251-MG cells and nine were confirmed but the percent viability was variable - is the variability simply a reflection of the different cell line?
Response: The variability in percent viability observed in U251-MG cells likely reflects the inherent differences between cell lines, which can contribute to varying levels of susceptibility to gene ablation, even for the same targets. We have now highlighted these small differences in the main text of the revised manuscript as follows:
"We confirmed a total of 9 hits (Fig. 1H), including the ELPs gene IKBAKP and the transcription factor TFAP2C, the two strongest hits identified in LN-229 C3 cells. However, in the U251-Cas9 the rescue effect did not always fall within the exact range observed in LN-229 C3 cells, likely due to intrinsic differences between the two cell lines."
8) The two strongest hits were IKBAKP and TFAP2C. As TFAP2C is a transcription factor - is it known to modulate expression of any of the genes that were identified to be perturbed in the screen? Moreover, it is stated that it regulates expression of several lncRNAs- have the authors looked at expression of these lncRNAs- is the expression affected- can modulation of expression of these lncRNAs modulate the observed phenotypic effects and also some of the targets they have identified in the screen?
Response: While TFAP2C is a transcription factor known to regulate the expression of several genes and lncRNAs, we did not identify any of its known target genes among the hits of our screen. However, our RNA-seq data and RT-qPCR (data not shown) indicate that the expression of lncRNA MALAT1 and NEAT1 (reported to interact with both HNRNPK and TFAP2C; ref 37, 41, 47) is strongly affected by HNRNPK ablation and to a lesser extent by TFAP2C deletion. However, the double deletion condition does not appear to change these lncRNA levels beyond what is observed with HNRNPK ablation alone. Therefore, we concluded that these changes do not play a primary role in the phenotypic effects observed in our study. Thus, although interesting, we believe that the description of such observations goes beyond the scope of this manuscript and the relevance of this work.
9) As both HNRNPK and TFAP2C modulate glucose metabolism, the authors have chosen to explore the epistatic interaction. This is most reasonable.
Response: We do not have further comments on this point.
10) The orthogonal assay to confirm that deletion of TFAP2C supresses cell death upon removing HNRNPK- was this done using a single guide RNA or multiple guides - is there a level of suppression required to observe rescue? Interestingly ablation of HNRNPK increases TFAP2C expression in LN-229-C3 whereas in U251-Cas9 cells HNRNPK ablation has the opposite effect- both RNA and protein levels of TFAP2C are decreased - is this the cause of the smaller protective effect of TFAP2C deletion in this cell line?
Response: TFAP2C deletion was performed using quadruple-guide RNAs (gqRNAs). We have clarified this point by addressing the reviewer #2's point 6 in "Major comments".
We did not directly test the threshold of TFAP2C inhibition required to suppress HNRNPK ablation-induced cell death. We did not exclude that other effectors may take a role in the smaller protective effect of TFAP2C deletion in the U251-Cas9 cells, however, multiple lines of evidence from our study suggest that TFAP2C expression levels influence cellular sensitivity to HNRNPK loss:
1) Both LN-229 C3 and U251-Cas9 cells are less sensitive to HNRNPK ablation upon TFAP2C deletion (Fig. 1G-H, Fig. 2A-B, Supp. Fig.3A-B).
2) We observed a correlation between endogenous TFAP2C levels and HNRNPK ablation sensitivity. U251-Cas9 cells, where TFAP2C expression is reduced upon HNRNPK ablation (in contrast to LN-229 C3 cells, where HNRNPK ablation leads to an increase in TFAP2C expression) (Fig. 2C-F), are a) less sensitive to HNRNPK deletion than LN-229 C3 (Fig. 1A, 2A-B) and b) the protective effect of TFAP2C deletion is less pronounced than in LN-229 C3 (Fig. 1G-H, Fig. 2A-B, Supp. Fig.3A-B).
3) TFAP2C overexpression experiments (Fig. 2G) establish a causal relationship to the former correlation: TFAP2C overexpression increased U251-Cas9 sensitivity to HNRNPK ablation.
As clearly mentioned in the manuscript, we believe that, taken together, these findings strongly demonstrate a causal role for TFAP2C in modulating sensitivity to HNRNPK loss. Thus, despite the differences in the expression, the proposed viability interaction between TFAP2C and HNRNPK is conserved across cell lines.
To further strengthen our conclusions, we have now added LN-229 C3 TFAP2C overexpression in Fig. 2G (also attached below for your convenience). As for the U251-Cas9, LN-229 C3 cells show increased sensitivity to HNRNPK ablation upon TFAP2C overexpression.
11) Nuclear localisation studies indicate that the HNRNPK and TFAP2C proteins colocalise in the nucleus however the co-IP data is not convincing- although appropriate controls are present, the level of interaction is very low - the amount of HNRNPK pulled down by TFAP2C is really very low in the LN-229C3 cells and even lower in the U251-Cas9 cells. Have they undertaken the reciprocal co-IP expt?
Response: We rephrased our text to better highlight this as also mentioned in our response to reviewer #1 (Point 1 - Major comments). However, as also noted by the reviewer, the experiments included all the relevant controls. Thus, the results are solid and confirm a degree of co-immunoprecipitation (although weak). As detailed in our response to reviewer #1 (Point 1 - Major comments), to strengthen our conclusion, we have now repeated the experiment in low-detergent conditions and used benzonase nuclease for DNA digestion. We also have performed the reciprocal experiment as suggested by the reviewer, confirming the initial results. In our opinion, these additional experiments support the conclusion that Tfap2c and hnRNP K co-immunoprecipitate through a weak, but direct, interaction.
12) They state that LN-229 C3 ∆TFAP2C and U251-Cas9 ∆TFAP2C were only mildly resistant to the apoptotic action of staurosporin Fig 3E and F - I accept they have undertaken the stats which support their statement that at high concentrations of staurosporin the LN-229 C3 ∆TFAP2C cells are less sensitive but the U251-Cas9 ∆TFAP2C decreased sensitivity is hard to believe. Has this been replicated? I agree that HNRNPK deletion causes apoptosis in both LN-229 C3 and U251-Cas9 cells and this is blocked by Z-VAD-FMK - however the block is not complete- the max viability for HNRNPK deletion in LN-229 C3 cells is about 40% whereas for U251-Cas9 cells it is about 30% - does this suggest that cells are being lost by another pathway. Have they tested concentrations higher than 10nM?
Response: The experiments in FIG. 3E-F have been replicated four times, as stated in the figure legend. We agree that TFAP2C plays a limited role in response to staurosporine-induced apoptosis, particularly in U251-Cas9 cells. To ensure clarity, we have now modified our previous sentence as follows:
"LN-229 C3ΔTFAP2C cells were only mildly resistant to the apoptotic action of staurosporine, and U251-Cas9ΔTFAP2C showed even lower and minimal recovery (Fig. 3E-F). These results indicate that TFAP2C plays a limited role in apoptosis regulation and suggest that its suppressive effect on HNRNPK essentiality is not mediated through direct modulation of apoptosis but rather through upstream processes that eventually converge on it."
The incomplete blockade of apoptosis by Z-VAD-FMK suggests that HNRNPK ablation may activate alternative, non-caspase-mediated cell death pathways. Regarding this point, we decided to not test Z-VAD-FMK above 10 nM as we noted that the rescue effect at the lowest concentration (2nM) was not proportionally increasing at higher concentrations, suggesting we already reached saturation. We have now added and clarified these observations in the revised manuscript as follows:
"Z-VAD-FMK decreased cell death consistently and significantly in LN-229 C3 and U251-Cas9 cells transduced with HNRNPK ablation qgRNAs (Fig. 3C‑D), confirming that HNRNPK deletion promotes cell apoptosis. However, we observed that viability recovery plateaued already at the lowest concentration (2 nM) without further increase at higher doses, suggesting a saturation effect. This indicates that while caspase inhibition alleviates part of the cell death, HNRNPK loss triggers additional mechanisms beyond apoptosis".
Following the suggestion of the reviewer, we have now also tested two higher concentrations of Z-VAD (20 and 50nM) in LN-229 cells. At these concentrations, we observed a slight decrease in cell viability in the NT condition, with a rescue effect in the HNRNPK-ablated cells comparable to what was observed at 2-10nM Z-VAD. For this reason, we did not include these data in the revised manuscript, and we attached them here for transparency.
13) The RNA-seq comparisons- the authors use log2 FC Response: We used a log2 FC threshold of >0.5 and 0.25) is commonly used in RNA-seq studies to capture biologically relevant shifts (e.g.,https://doi.org/10.1371/journal.ppat.1012552; https://doi.org/10.1371/journal.ppat.1008653; https://doi.org/10.1016/j.neuron.2025.03.008; https://doi.org/10.15252/embj.2022112338). We complemented this analysis with Gene Set Enrichment Analysis (GSEA) to assess coordinated changes in biological/genetic pathways, ensuring that our conclusions are not based on isolated, minor expression changes nor on arbitrary thresholds. Finally, to enhance our result robustness, we applied False Discovery Rate (FDR) statistics, which is more stringent than a p-value cutoff. We hope this clarification strengthens the reviewer's confidence in the significance of the observed changes.
14) It is stated" Accordingly, we observed increased AMPK phosphorylation (pAMPK) upon ablation of HNRNPK, which was consistently reduced in LN-229 C3ΔTFAP2C cells (Supp. Fig. 5B). LN-229 C3ΔTFAP2C; ΔHNRNPK cells also showed a partial reduction of pAMPK relative to LN-229 C3ΔHNRNPK cells (Supp. Fig. 5B). These results suggest that hnRNP K depletion causes an energy shortfall, leading to cell death.
Response: I am not totally convinced by the data presented in this Fig. The authors have quantified the band intensity and present the ratio of pAMPK to AMPK. Please note that the actin levels are variable across the samples - did they normalise the data using the actin level before undertaking the comparisons? Also, if the authors think this is an important point which supports their conclusion, then it should be in the main body of the paper rather than the supplementary. If AMPK is being phosphorylated, this should lead to activation of the metabolic check point which involves p53 activation by phosphorylation. Activated p53 would turn on p21CIP1 which is a very sensitive indicator of p53 activation.
We also refer the reviewer to our response to reviewer #1 (Point 2 - Major comments). We understand the point of the reviewer as pAMPK/Actin (absolute AMPK phosphorylation) may provide additional context regarding the downstream effects of AMPK activation, which, however, is not the primary scope of our experiment. We believe that in our specific case, a) the pAMPK/AMPK ratio is the most appropriate metric, as it reflects the energy status of the cell (ATP/AMP levels), which was our main point to assess in this experiment, and b) phospho-protein/total protein is the standard approach for quantifying phosphorylation ratio. For completeness, we have now included pAMPK/Actin quantifications in Supp. Fig. 6B of the revised manuscript (also attached below). pAMPK/Actin levels follow the same trend of pAMPK/AMPK in HNRNPK and TFAP2C single ablations. The pAMPK/AMPK partial rescue in HNRNPK;TFAP2C double ablation relative to HNRNPK single deletion is instead not observed at pAMPK/Actin level. We have now added the pAMPK/Actin quantification and this observation to the revised manuscript as follows:
"Accordingly, we observed increased AMPK phosphorylation (pAMPK/AMPK ratio and pAMPK/Actin) upon ablation of HNRNPK, with a trend toward reduction in LN-229 C3ΔTFAP2C cells (Supp. Fig. 6B). LN-229 C3ΔTFAP2C;ΔHNRNPK cells also showed a reduction of pAMPK/AMPK ratio relative to LN-229 C3ΔHNRNPK cells, although absolute AMPK phosphorylation (pAMPK/Actin) remained high (Supp. Fig. 6B)."
We prefer to keep the AMPK blots in Supplementary Fig. 6B, as we believe the main take-home message of the manuscript should remain centered on mTORC1 activity.
15) We also do not understand why the mTOR Suppl. Fig. 5E is not in the main body of the paper. It's clear that RNA and protein levels of mTOR were downregulated in LN-229 C3ΔHNRNPK cells but were partially rebalanced by the ΔTFAP2C- however the ΔTFAP2C;ΔHNRNPK double deletion levels are only slightly higher than the ΔHNRNPK - they are not at the level NT or even ΔTFAP2C (Fig. 4C, Supp. Fig. 5E).
Response: We moved the mTOR blot to Fig.5D of the revised manuscript. About the low rescue effect, this is in line with all the other observations where a full rescue of the effects of HNRNPK ablation is never achieved, but is only partial. As suggested by reviewer #3 (Figure 5 - Point 2), we have now added RT-qPCR in Fig.5C, which corroborates these data.
16) The authors state: "Deletion of HNRNPK diminished the highly phosphorylated forms of 4EBP1, which instead were preserved in both LN-229 C3ΔTFAP2C and LN-229 C3ΔTFAP2C;ΔHNRNPK cells (Fig. 5C). Similarly, the S6 phosphorylation ratio was reduced in LN-229 C3ΔHNRNPK cells and was restored in the ΔTFAP2C;ΔHNRNPK double-ablated cells (Fig. 5C)."
WE are not convinced that p4EBP1 is preserved in the LN-229 C3ΔTFAP2C cells - there is a very faint band which is at a lower level than the band in the LN-229 C3ΔHNRNPK cells. However, when both HNRNPK and TFAP2C were ablated, the p4EBP1 band is clear cut. I agree with the quantitation that deletion of HNRNPK and TFAP2C both reduce the level of 4EBP1 - the reduction is greater with TFAP2 but when both are deleted together the levels of 4EBP1 are higher and p4EBP1 is clearly present. In quantifying the S6 and pS6 levels, did the authors consider the actin levels- they present a ratio of the pS6 to S6. I may be lacking some understanding but why is the ratio of pS6/S6 being calculated. Is the level of pS6 not what is important - phosphorylation of S6 should lead it to being activated and thus it's the actual level of pS6 that is important, not the ratio to the non-phosphorylated protein.
Response: In Fig. 5C, the three-band pattern of 4EBP1 is clearly visible in the NT+NT or WT condition, with the top band representing the highest phosphorylation state. Upon HNRNPK deletion, this top band almost completely disappears, mimicking the effect of our starvation control (Starv.). This top band remains clearly visible in both TFAP2C-ablated and double-ablated cells, supporting our conclusion. In our original text, we referred to the "highly phosphorylated forms" of 4EBP1, which might have caused some confusion, suggesting we were evaluating the two top bands. We are specifically referring only to the very top band (high p4EBP1), which represents the most highly phosphorylated form of 4EBP1. This is the relevant phosphorylated form to focus on, as it is the only one that disappears in the starvation control (Starv.) or upon mTORC1/2 inhibition with Torin-1 (Fig. 7B).
To better clarify these points, we have now more clearly indicated the "high p4EBP1" band with an asterisk in Fig. 5E, added quantification of high p4EBP1/4EBP1, and rephrased the text as follows:
"Deletion of HNRNPK diminished the highest phosphorylated form of 4EBP1 (high p4EBP1, marked with an asterisk), mimicking the effect observed in starved cells (Starv.). This high p4EBP1 band was preserved in both LN-229 C3ΔTFAP2C and LN-229 C3ΔTFAP2C;ΔHNRNPK cells (Fig. 5C).".
Regarding pS6 quantification, we added pS6/Actin quantification in Supp. Fig. 6E and F of the revised manuscript, also attached here for your convenience.
17) When determining ATP levels, do they control for cell number? HNRNPK depletion results in lower ATP levels, co-deletion of TFAP2C rescues this. But this could be because there is less cell-death? So, more cells express ATP. Have they controlled for relative numbers of cells.
Response: As described in the Materials and Methods , we normalized ATP levels to total protein content, which is a standard approach for this type of quantification (see DOI:10.1038/nature19312).
18) The construction of the HovL cell line that propagate ovine prions - very few details are provided of the susceptibility of the cell line to PG127 prions.
Response: As with other prion-infected cell lines, HovL cells do not exhibit any specific growth defects, susceptibilities, or phenotypes beyond their ability to propagate prions. This is consistent with established observations in prion research, where immortalized cell lines (and in general in vitro cultures) normally do not show cytotoxicity upon prion infection and, therefore, are used as models for prion propagation rather than for prion toxicity (see https://doi.org/10.1111/jnc.14956 for reference).
We now expanded the relevant section, including technical and conceptual details in the main text of the revised manuscript as follows:
"As reported for other ovinized cell models (66), HovL cells were susceptible to infection by the PG127 strain of ovine prions and capable of sustaining chronic prion propagation, as shown by proteinase K (PK)-digested western blot and by detection of PrPSc using the anti-PrP antibody 6D11, which selectively stains prion-infected cells after fixation and guanidinium treatment (67) (Supp. Fig. 7C-E). Consistent with most prion-propagating cell lines (68), HovL cells did not exhibit specific growth defects, susceptibilities, or overt phenotypes beyond their ability to propagate prions."
19) It is stated that HRNPK depletion from HovL cells increases PrpSC as determined by 6D11 fluorescence, but in the manuscript HRNPK depletion results in cell death. How does this come together?
Response: As explicitly stated in the main text and shown in Fig.6-7, HNRNPK is downregulated (via siRNAs) in the prion experiments rather than fully deleted (via CRISPR) as in the first part of the manuscript. As shown in Supp. Fig. 8B, this downregulation does not affect cell viability within the experimental time window. Therefore, the observed increase in PrPSc levels upon HNRNPK downregulation, as determined by western blot and 6D11 staining, is independent of any potential cell death effects. Moreover, the same siRNA downregulation approach was used by M. Avar et al. (Ref. 26) in comparable experiments, yielding similar outcomes.
20) They show that mTOR inhibition mimics the effect of HNRNPK deletion, why didn't they overexpress mTOR and see if that rescues this? This would indicate a causal relationship.
Response: We appreciate the reviewer's suggestion. We agree that the proposed rescue strategy would be the best approach to indicate a causal relationship. However, we linked the activity of the mTORC1 complex (and not only that of mTOR) to prion propagation. Overexpression of only mTOR would not restore mTORC1 full function, as Rptor would still be downregulated in the context of HNRNPK siRNA silencing (Fig. 7A and Supp. Fig. 8E). Moreover, our RNA-seq data (Supp. Table 5) from HNRNPK ablation indicate the downregulation of other mTORC1 components (namely Pras40 (AKT1S1) and mLST8). Therefore, the rescue of the mTORC1 activity by an overexpression strategy would be a very challenging approach. Given these complexities, to infer causality, we used mTORC1 inhibition (via rapamycin and Torin1) to mimic the effects of HNRNPK downregulation in reducing mTORC1 activity (FIG. 7B).
For clarification, we have now highlighted in Fig. 4C that HNRNPK ablation downregulates also AKT1S1 and mLST8, other than mTOR and Rptor (also attached below), and we have discussed this in the main text as well. We also have clarified in the revised manuscript (where we sometimes inadvertently referred to it as just mTOR inhibition) that the observed effects are due to mTORC1 inhibition, and not simply mTOR inhibition.
21) Flow cytometric data: supplementary Fig of Fig6d. - when they are looking at fixed cells the gating strategy for cells results in the inclusion of a lot of debris. The gate needs to be moved and be more specific to ensure results are interpreted properly. Same with the singlet gating. It's not tight enough, they include doublets as well which will skew their data. The gating strategy needs to be regated.
Response: We have reanalyzed the flow cytometry data in Fig. 6D with a more stringent gating approach to better exclude debris and ensure proper singlet selection. We confirm that there is no change in the final interpretation of the results after applying the updated gating strategy.
Reviewer #2 (Significance (Required)):
The manuscript "Prion propagation is controlled by a hierarchical network involving the nuclear Tfap2c and hnRNP K factors and the cytosolic mTORC1 complex" by Sellitto et al aims to examine how heterogenous nuclear ribonucleoprotein K (hnRNPK), limits pion propagation. They perform a synthetic - viability CRISPR- ablation screen to identify epistatic interactors of HNRNPK. They found that deletion of Transcription factor AP-2g (TFAP2C) suppressed the death of hnRNP-K depleted LN-229 and U-251 MG cells whereas its overexpression hypersensitized them to hnRNP K loss. Moreover, HNRNPK ablation decreased cellular ATP, downregulated genes related to lipid and glucose metabolism and enhanced autophagy. Simultaneous deletion of TFAP2C reversed these effects, restored transcription and alleviated energy deficiency.
Reviewer #3 (Evidence, reproducibility and clarity (Required)):
Summary: Using a CRISPR-based high throughput abrasion assay, Sellitto et al. identified a list of genes that improve cell viability when deleted in hnRNP K knockout cells. Tfap2c, a transcription factor, was identified as a candidate with potential overlap with a hnRNP K function like modulating glucose metabolism. The deletion of Tfap2c in hnRNP K-deletion background prevented caspase-dependent apoptosis observed in hnRNP K single-deletion cells. Further analysis of bulk RNA-seq in hnRNP K/TFAP2C single- and double-deletion cells revealed the impairment in cellular ATP level. Accordingly, activation of AMPK led to perturbed autophagy in hnRNP K deleted cells. Moreover, the reduction and/or inactivation of the downstream mTOR protein resulted in the reduced phosphorylation of S6. Conversely, the phosphorylation of S6 and E4BP1 can be increased by TFAP2C overexpression. Finally, the pharmacological inhibition of the mTOR pathway increased the PrPSC level. This is an interesting paper potentially providing new mechanical insight of hnRNPK function and its interaction with TFAP2C. However, inconsistencies in TFAP2C expression across cell lines and conflicting mechanistic interpretations complicate conclusions. Co-IP experiments suggested hnRNP K and Tfap2c may interact, though further validation is needed. Several figures require additional clarification, statistical analysis, or experimental validation to strengthen conclusions.
Major comments:
1) Different responses of the TFAP2C expression level to deletion of hnRNPK in the two cell lines (LN-229 C3 and U251-Cas9) should be more adequately addressed. The manuscript focuses on the interaction between hnRNPK and TFAP2C, yet the hnRNPK deletion causes different changes in TFAP2C level in two different lines. Furthermore, in studies where the mechanistic link between hnRNPK and TFAP2C is being investigated, only results from the LN-229 line are presented (Figure 4-7). Thus, it is not clear whether these mechanisms also apply to another line, U251-Cas9, where hnRNPK deletion has the opposite effect on the TFAP1C level. Thus, key experiments should be performed in both lines.
Response: The opposite effects of hnRNPK ablation on TFAP2C expression between LN-229 C3 and U251-Cas9 cells likely reflect intrinsic differences between the two cell lines. However, the viability interaction between hnRNPK and TFAP2C is conserved in both cell models (Fig. 1G-H, 2A-B, Supp. Fig. 3A-B), suggesting that shared molecular functions at the interface of this interaction exist across the lines. In fact, we believe that the opposite effect of hnRNPK ablation on TFAP2C expression in the two lines strengthens (rather than weakens) our model by highlighting how TFAP2C expression modulates cellular sensitivity to HNRNPK ablation, as detailed in our response to Reviewer #2 (Point 10 - Major comments).
Regarding the mechanistic studies presented in FIG. 4-7, our initial goal in using two cell lines was to validate the functional viability interaction between HNRNPK and TFAP2C, as identified in our screening (performed in LN-229 C3 cells). After confirming this interaction, we chose to focus only on LN-229 C3 (beginning with RNA-seq analysis, which then led to subsequent mechanistic studies), as this provided the necessary foundation to investigate prion propagation in HovL cells (derived from LN-229). As a U251 model propagating prions does not exist, we are technically limited in performing prion experiments only in HovL and we do not believe that conducting additional experiments in U251 cells would add substantial value to our work or further our investigation.
We hope this explanation clarifies our rationale and addresses the reviewer's concerns.
2) Although a lot of data are presented, it is not clear how deletion of the TFAP2C reverses the toxicity caused by deletion of hnRNPK. Specifically, the first half of the paper seems to suggest an opposite mechanism than the second half of the paper. In Figure 2-4, the authors suggest a model that TFAP2C deletion has the opposite effect of hnRNPK deletion, thus rescuing toxicity. However, in Figure 5-6, it is suggested TFAP2C overexpression has the opposite effect of hnRNPK deletion. This two opposite effect of TFAP2C make it difficult to understand the models that the authors are proposing. Please also see below comment 2 for Figure 5.
Response: We respectfully disagree with the notion that the first and second halves of the manuscript propose contradictory mechanisms.
In Fig. 2-4, we describe the phenotypic rescue of cell viability upon TFAP2C deletion in hnRNPK-deficient cells. At this stage, we are not proposing a specific molecular mechanism but simply observing a rescue of viability and highlighting underlying transcriptional differences. There is no implication of an opposite molecular mechanism involving the individual activities of hnRNPK and TFAP2C; rather, we focused on the broader effect of TFAP2C deletion on the viability of HNRNPK-lacking cells. In Fig. 5, we isolated a partial mechanism underlying this interaction. We state that: "These data specify a role for TFAP2C in promoting mTORC1-mediated cell anabolism and suggest that its overexpression might hypersensitize cells to HNRNPK ablation by depleting the already limited ATP available, thus making its deletion advantageous". In the discussion, we now further reviewed our explanation: "HNRNPK deletion might cause a metabolic impairment leading to a nutritional crisis and a catabolic shift, whereas TFAP2C activation could promote mTORC1 anabolic functions. Thus, Tfap2c removal may rewire the bioenergetic needs of cells by modulating the mTORC1 signaling and augmenting their resilience to metabolic stress like the one induced by HNRNPK ablation". Therefore, we propose that TFAP2C expression might be particularly detrimental in hnRNPK-deficient cells, as it could push the cell into an anabolic biosynthetic state, further depleting energy stores that the cell is attempting to conserve in response to hnRNPK depletion. Removal of TFAP2C alleviates this metabolic strain. In our view, there is no contradiction between our observations.
We hope this explanation clarifies our rationale and resolves any perceived inconsistency in our model. To further enhance the understanding of our interpretations, we have now also added (in substitution of Fig. 5E of the original manuscript) a graphical scheme (Fig. 5G of the revised manuscript) to visually explain and illustrate our model (attached below for your convenience).
3) Similar to the point above, the first half of the paper focuses on hnRNPK deletion-induced toxicity (Fig. 1-5), while the second half of the paper focuses on hnRNPK deletion-induced PrPSC level (Fig. 6-7). The mechanistic link between these two downstream effects of hnRNPK deletion is not clear and thus, it is difficult to understand the reason that hnRNPK deletion-induced toxicity can be rescued by TFAP2C deletion, while hnRNPK deletion-induced PrPSC level increase can be rescued by TFAP2C overexpression.
Response: Our study is not aimed at comparing viability and prion propagation as interconnected phenotypes but rather at identifying molecular processes regulated by the HNRNPK-TFAP2C interaction. Our study identifies mTORC1 activity as a molecular process at the interface of the HNRNPK-TFAP2C. HNRNPK knockout (or knockdown, which does not affect viability, and therefore is used in the prion section of the manuscript) tones mTORC1 activity down, while TFAP2C overexpression enhances it. This finding suggested an explanation for the viability interaction we observed (see reply to reviewer #3 - Point 2 -Major comments) and it provided a partial mechanism (mTORC1 activity) to explain the effect of HNRNPK knockdown and TFAP2C overexpression on prions.
We hope this clarification addresses the reviewer's concern.
Abstract:
1) Please rephrase and clarify "We linked HNRNPK and TFAP2C interaction to mTOR signaling..." by distinguishing functional, genetic, and direct (molecule-to-molecule) interactions.
Response: 1) We have now clarified it in the text of the revised manuscript as follows:
"We linked HNRNPK and TFAP2C functional and genetic interaction to mTOR signaling, observing that HNRNPK ablation inhibited mTORC1 activity through downregulation of mTOR and Rptor, while TFAP2C overexpression enhanced mTORC1 downstream functions."
2) A sentence reads, "...HNRNPK ablation inhibited mTORC1 activity through downregulation of mTOR and Rptor," although the downregulation of Rptor is observed only at the RNA level. The change in Rptor protein expression level is not reported in the manuscript. Please consider adding an experiment to address this or rephrase the sentence.
Response: 2) We have now added the experiment in Supp. Fig. 9A of the revised manuscript. The blot shows that hnRNP K depletion reduces both mTOR and Rptor protein levels. "hnRNP K depletion inhibited mTORC1 activity through downregulation of mTOR and Rptor".
Figure 2:
- H and I. Co-IP experiments were done using anti-TFAP2C antibody to the bead. Although the TFAP2C bands show robust signals on the blots, indicating successful enrichment of the protein, hnRNP K bands are very faint. Has the experiment been done by conjugating the hnRNP K antibody to the beads instead? Was the input lysate enriched in the nuclear fraction? Did the lysis buffer include nuclease (if so, please indicate in the figure legend and the methods section)? Addressing these would make the argument, "We also observed specific co-immunoprecipitation of hnRNP K and Tfap2c in LN-229 C3 and U251-Cas9 cells (Fig. 2H-I, Supp. Fig. 3L), suggesting that the two proteins form a complex inside the nucleus" stronger, providing information on potential direct binding.
Response: 1. We refer the reviewer to our response to reviewers #1 and #2 regarding the weak interaction, the nuclease treatment, and the HNRNPK IP (reviewer #1 Point 1 and reviewer #2 Point 11 - Major comments). As for the co-IP input, it was not enriched in the nuclear fraction, but as shown in Supp. Fig. 4A-B hnRNPK and Tfap2c are exclusively nuclear.
Figure 3:
- C and D. Please add a sentence in the figure legend explaining which means the multiple comparisons were made between (DMSO vs each drug concentration?). Graphing individual data points instead of bars would also be helpful and more informative. Please discuss the lack of dose dependency.
Response: 1. We have now added information about the comparison in the figure legend ("Multiple comparison was made between Z-VAD-FMK and DMSO treatments in ΔHNRNPK cells."), modified the graph to show the individual data points (attached below for your convenience), and expanded the discussion as detailed for reviewer #2 (Point 14 - Major comments). (For completeness, we have also modified Supp. FIG. 5F to show individual data points, and we have combined the graphs (the DMSO control was shared across treatments)).
Supplemental Figure 4 (Now shifted in Supplemental Figure 5):
A. Although the trend can be observed, the deletion of hnRNP K does not significantly reduce the GPX4 protein level in LN-229 C3. Therefore, the following statement requires more data points and additional statistical analysis to be accurate: "In LN-229 C3 and U251-Cas9 cells, the deletion of HNRNPK reduced the protein level of GPX4, whereas TFAP2C deletion increased it (Supp. Fig. 4A-B)."
A and B. The results are confusing, considering the previous report cited (ref 49) shows an increase in GPX4 with TFAP2C. It may be possible that the deletion of TFAP2C upregulates the expression of proteins with similar functions (e.g., Sp1). If this is the case, the changes in GPX4 expression observed here are a consequence of TFAP2C deletion and may not "suggest a role for HNRNPK and TFAP2C in balancing the protein levels of GPX4."
Response: 1. We agree with the reviewer that in LN-229 C3 cells the reduction of GPX4 protein levels upon HNRNPK deletion did not reach statistical significance in our initial Western blot analysis. To address this concern, we performed six additional independent experiments and repeated the statistical analysis. Although the trend toward reduced GPX4 protein levels remained consistent, statistical significance was still not achieved (p > 0.05). Importantly, this trend is supported by our RNA-seq dataset (Supplementary Table 5), which shows decreased GPX4 expression upon HNRNPK deletion. We have now revised the text to more accurately reflect the experimental observations and to avoid overstating the effect in LN-229 C3 cells as follows:
"In LN-229 C3 and U251-Cas9 cells, deletion of HNRNPK was associated with reduced glutathione peroxidase 4 (GPX4) protein abundance (although not statistically significant in LN-229 C3; p ≈ 0.08), whereas deletion of TFAP2C increased it (Supp. Fig. 5A-B)."
The six new experimental replicas have been added to the uncropped western blot section.
__Response: __2. Concerning the potential role of TFAP2C deletion in upregulating proteins with similar functions, we recognize the reviewer's perspective. However, our primary focus is on the observed trends rather than a definitive mechanistic conclusion. We clarified our wording to acknowledge this possibility while maintaining the relevance of our findings within the broader context of hnRNPK and TFAP2C interactions.
"This last result was interesting as a previous study reported that Tfap2c enhances GPX4 expression (51). Thus, the observed increase upon TFAP2C deletion suggests additional layers of regulation, potentially involving compensatory mechanisms."
Supplemental Figure 5 (Now shifted in Supplemental Figure 6):
- B. To obtain statistical significance and strengthen the conclusion, more repeated Western blot experiments can be done to quantify the pAMPK/AMPK ratio.
Response: We included three more experiments as detailed in our response to reviewer #1 (Point 2 - Major comments) and reviewer #2 (Point 14 - Major comments).
Figure 5:
B. I believe statistical analysis with two replicates or less is not recommended. Although the assay is robust, and the blot is convincing, please consider adding more replicates if the blot is to be quantified and statistically analyzed.
"Interestingly, RNA and protein levels of mTOR were downregulated in LN-229 C3ΔHNRNPK cells but were partially rebalanced by the ΔTFAP2C;ΔHNRNPK double deletion (Fig. 4C, Supp. Fig. E)." The statement is based on a slight difference at the protein level between the single deletion and the double deletion, as well as the observation from the bulk RNA-seq data. mTOR (and Rptor) mRNA level can be assessed by RT-qPCR to validate and further support the existing data. It is also curious why deletion of TFAP2C alone, also induced decrease in mTOR, but double deletion rescued mTOR level slightly compared to deletion of HNRNPK alone.
C. The main text refers to the changes in the level of phosphorylated E4BP1, stating, "Deletion of HNRNPK diminished the highly phosphorylated forms of 4EBP1, which instead were preserved in both LN-229 C3ΔTFAP2C and LN-229 C3ΔTFAP2C;ΔHNRNPK cells (Fig. 5C)." However, the quantification was done on the total E4BP1, which may be because separating pE4BP1 and E4BP1 bands on a blot is challenging. Please consider using phospho-E4BP1 specific antibody or rephrase the sentence mentioned above. The current data suggest the single- and double-deletion of hnRNP K/TFAP2C affect the overall stability of E4BP1, which may be a correlation and not due to the mTOR activity as claimed in "We conclude that HNRNPK and TFAP2C play an essential role in co-regulating cell metabolism homeostasis by influencing mTOR and AMPK activity and expression." How does the cap-dependent translation (or total protein level) change in TFAP2C deleted and overexpressing cells?
Response: 1. We added two additional experiments as detailed in our response to reviewer #1 (Point 3 - Major comment).
__Response: __2. Deletion of TFAP2C does not decrease mTOR levels as shown from the quantification in Fig. 5D. To further support our results, we have now included RT-qPCR in FIG. 5C as suggested by the reviewer. Data are also attached here for your convenience.
__Response: __3. Regarding the assessment of phosphorylated 4EBP1, we think we achieved a clear separation of the differently phosphorylated forms of 4EBP1 in our blots, and we have now added the quantification for High p4EBP1/4EBP1 in Fig. 5E (see also our response to reviewer #2 Point 16 - Major comments). The quantification of total 4EBP1 represents an additional dataset, and we do not claim that 4EBP1 stability is affected by HNRNPK and TFAP2C directly through mTOR, which could be, in fact, correlative. We claim that HNRNPK and TFAP2C modulate mTORC1 and AMPK metabolic signaling as shown by the changed phosphorylation of 4EBP1, S6, AMPK, and ULK1 (Fig. 5C-E, Supp. FIG. 6B, D) and by the regulation of autophagy (Fig. 5B, Supp. Fig. 6C); we did not directly check cap-dependent translation.
We have now rephrased our text to ensure clarity as follows:
"We conclude that HNRNPK and TFAP2C play a role in co-regulating mTORC1 and AMPK expression, signaling, and activity."
Figure 6:
A. Did the sihnRNP K increase the TFAP2C level?
A and C. Are the total PrP levels lower in TFAP2C overexpressing cells compared to mCherry cells when they are infected?
D. Do the TFAP2C protein levels differ between 2-day+72-h and 7-day+96-h?
__Response: __1. Yes, it does. We have now provided the quantification in Fig. 6A, C, and Supp. Fig. 8A (also attached below for your convenience).
__Response: __2. We have now provided the quantification in Fig. 6A and Supp. Fig. 8A. The total PrP does not change in TFAP2C overexpressing cells. Total PrP consists of both PK-resistant PrP (PrPSc) and PK-sensitive PrP (PrPC plus potential other intermediate species), with PrPSc typically present at much lower levels. In our model, PrPC is exogenously expressed at high levels via a vector and remains constant across conditions (Fig. 6C and Supp. Fig. 8C). As a result, any changes in PrPSc may not necessarily reflect on total PrP levels.
__Response: __3. No, there is no statistically significant change. We have now added a representative western blot and the quantification of 3 independent replicates in Supp. Fig. 8D. The other two western blots are only shown in the uncropped western blots section. This dataset is also attached here for your convenience.
Figure 7:
- I agree with the latter half of the statement: "These findings suggest that HNRNPK influences prion propagation at least in part through mTORC1 signaling, although additional mechanisms may be involved." The first half requires careful rephrasing since (A) Independent of the background siRNA treatment, TFAP2C overexpression by itself can modulate PrPSC level as seen in Fig 6A and B, (B) Although the increase in TFAP2C level is observed with the hnRNP K deletion (Fig 1; LN-229 C3), sihnRNP K treatment may or may not influence the TFAP2C level (Fig 6; quantified data not provided), and (C) In the sihnRNP K-treated cells, E4BP1 level is increased compared to the siNT-treated cells, which was not observed hnRNP K-deleted cells. Discussions and additional experiments (e.g., mTOR knockdown) addressing these points would be helpful.
__Response: __A, B) We respectfully disagree with the possibility that HNRNPK downregulation may increase prion propagation via TFAP2C upregulation. As shown in Fig. 6A-B, D and in Supp. Fig. 8A, TFAP2C overexpression reduces, rather than increases, prion levels. Therefore, it would be inconsistent to suggest that HNNRPK siRNA promotes prion propagation through TFAP2C upregulation (quantification is now provided, see reviewer #3 - Figure 6 - Point 1). C) Concerning 4EBP1 levels, we have quantified the total 4EBP1 (also attached below) and expanded the discussion on potential discrepancies between HNRNPK knockout and knockdown, as the former affects cell viability, while the latter does not. However, as explained also in the previous reply to reviewer #3 - Figure 5 - Point 3, our focus is on the highly phosphorylated band of 4EBP1 (High p4EBP1), which is the direct target of mTORC1 activity. In both the hnRNPK knockout LN-229 C3 (Fig. 5E) and knockdown HovL models (Fig. 7B), phosphorylation of 4EBP1, along with phosphorylation of S6, is clearly reduced (we have now included quantification for Fig. 7B), reinforcing our conclusion that mTORC1 activity is affected by hnRNPK depletion. As the reviewer noted, we do not claim that mTORC1 is the sole mediator of hnRNPK's effect on prion regulation. However, we think that our interpretation of a potential and partial role of mTORC1 inhibition in the effect of HNRNPK downregulation on prion propagation is in line with the data presented in Fig. 6-7 and Supp. Fig. 8-9. For further clarification, we expanded the text according to the new experiments and analysis, and we added mTOR and Raptor siRNA knockdown (Supp. Fig.9C) to further support our conclusions (also attached below for your convenience).
Minor comments:
- Please clarify "independent cultures." Does this mean technical replicates on the same cell culture plate but different wells or replicated experiments on different days?
__Response: __We have now clarified in each figure legend. "Individually treated wells" means different parental cultures grown and treated separately on the same day. n represents independent experiments on different days.
Fig 2G. Please explain how the sigmoidal curves were fitted to the data points under the materials and methods section.
Fig 3E and F. Please refer to the comment on Fig 2G above.
__Response: __We have now added the explanation in Materials and Methods as follows:
"Curve Fitting
For sigmoidal curve fitting, we used GraphPad Prism (version X, GraphPad Software). Data in Figure 2G were fitted using nonlinear regression with a least squares regression model. For Figures 3E and 3F, data fitting was performed using an asymmetric sigmoidal model with five parameters (5PL) and log-transformed X-values (log[concentration])."
3.Fig S3 F/H. Quantification of gel bands would be helpful when comparing protein expression changes after different treatments, as band intensities look different across.
__Response: __We have now added the quantifications in Supp. FIG. 3D-H (attached below for your convenience). They confirm that there are no significant differences in the means of the normalized values.
- Supp Fig 5C and F. These panels can be combined with the corresponding panels in main Figure 5 if space allows so that the readers do not have to flip pages between the main text and Supplemental material.
__Response: __We have now combined the panels. Previous Supp. FIG. 5C and F are now shown in FIG. 6C and E, respectively.
Reviewer #3 (Significance (Required)):
This is an interesting paper potentially providing new mechanical insight of hnRNPK function and its interaction with TFAP2C. It is also important to understand how hnRNPK deletion induces prion propagation and develop methods to mitigate its spread. However, inconsistencies in TFAP2C expression across cell lines and conflicting mechanistic interpretations complicate conclusions. I have expertise in RNA-binding protein, cell biology, and prion disease.
Note: This preprint has been reviewed by subject experts for Review Commons. Content has not been altered except for formatting.
Learn more at Review Commons
Summary:
Using a CRISPR-based high throughput abrasion assay, Sellitto et al. identified a list of genes that improve cell viability when deleted in hnRNP K knockout cells. Tfap2c, a transcription factor, was identified as a candidate with potential overlap with a hnRNP K function like modulating glucose metabolism. The deletion of Tfap2c in hnRNP K-deletion background prevented caspase-dependent apoptosis observed in hnRNP K single-deletion cells. Further analysis of bulk RNA-seq in hnRNP K/TFAP2C single- and double-deletion cells revealed the impairment in cellular ATP level. Accordingly, activation of AMPK led to perturbed autophagy in hnRNP K deleted cells. Moreover, the reduction and/or inactivation of the downstream mTOR protein resulted in the reduced phosphorylation of S6. Conversely, the phosphorylation of S6 and E4BP1 can be increased by TFAP2C overexpression. Finally, the pharmacological inhibition of the mTOR pathway increased the PrPSC level. This is an interesting paper potentially providing new mechanical insight of hnRNPK function and its interaction with TFAP2C. However, inconsistencies in TFAP2C expression across cell lines and conflicting mechanistic interpretations complicate conclusions. Co-IP experiments suggested hnRNP K and Tfap2c may interact, though further validation is needed. Several figures require additional clarification, statistical analysis, or experimental validation to strengthen conclusions.
Major comments:
Abstract.
Figure 2.
Figure 3.
Supplemental Figure 4.
Supplemental Figure 5.
Figure 5.
Figure 6.
Figure 7.
Minor comments:
This is an interesting paper potentially providing new mechanical insight of hnRNPK function and its interaction with TFAP2C. It is also important to understand how hnRNPK deletion induces prion propagation and develop methods to mitigate its spread. However, inconsistencies in TFAP2C expression across cell lines and conflicting mechanistic interpretations complicate conclusions. I have expertise in RNA-binding protein, cell biology, and prion disease.
Note: This preprint has been reviewed by subject experts for Review Commons. Content has not been altered except for formatting.
Learn more at Review Commons
The paper by Sellitto describes studies to determine the mechanism by which hnRNPK modulates the propagation of prion. The authors use cell models lacking HNRNPK, which is lethal, in a CRISPR screen to identify genes that suppress lethality. Based on this screen to 2 different cell lines, gene termed Tfap2C emerged as a candidate for interaction with HNRNPK. The show that Tfap2C counteracts the actions of HNRNPK with respect to prion propagation. Cells lacking HNRNPK show increased PrPSc levels. Overexpression of Tfap2C suppesses PrPSc levels. These effects on PrPSc are independent of PrPC levels. By RNAseq analysis, the authors hone in on metabolic pathways regulated by HNRPNK and Tfap2C, then follow the data to autophagy regulation by mTor. Ultimately, the authors show that short-term treatments of these cell models with mTor inhibitors causes increased accumulation of PrPSc. The authors conclude that the loss of HNRNPK leads to a reduced energy metabolism causing mTor inhibition, which is reduces translation by dephosphorylation of S6.
Major Comments
Fig H and I, Fig 3L. The interaction between Tfap2C and HNRNPK is pretty weak. The interaction may not be consequential. The experiment seems to be well controlled, yielding limited interaction. The co-ip was done in PBS with no detergent. The authors indicate that the cells were mechanically disrupted. Since both of these are DNA binding proteins, is it possible that the observed interaction is due to proximity on DNA that is linking the 2 proteins, including a DNAase treatment would clarify.
Supplemental Fig 5B - The western blot images for pAMPK don't really look like a 2 fold increase in phosphorylation in HNRNPK deletion.
Fig. 5A - I don't think it is proper to do statistics on an of 2. Fig 6D. The data look a bit more complicated than described in the text. At 7 days, compared to 2 days, it looks like there is a decrease in % cells positive for 6D11. Is there clearance of PrPSc or proliferation of un-infected cells? The authors might consider a different order of presenting the data. Fig 6 could follow Fig. 2 before the mechanistic studies in Figs 3-5. The authors use SEM throughout the paper and while this is often used there has been some interest in using StdDev to show the full scope of variability.
Discussion The discrepancy between short-term and long-term treatments with mTor inhibitors is only briefly mentioned with a bit of a hand-waving explanation. The authors may need a better explanation.
Minor Comments
Page 12 - no mention of chloroquine in the text or related data.
Page 12 - Supp. Fig. E - should be 5E
The study provides mechanistic insight into how HNRNPK modulates prion propagation. The paper is limited to cell models, and the authors note that long term treatment with mTor inhibitors reduced PrPSc levels in an in vivo model.
The primary audience will be other prion researchers. There may be some broader interest in the mTor pathway and the role of HNRNPK in other neurodegenerative diseases.
en el enunciado se desarrollan, en forma de párrafos, los siguientes aspectos:La descripción del problema: Lo que se quiere explicar o solucionarLas causas del problema: Las que producen el problema, como factores culturales, económicos o políticosLas consecuencias del problema: Lo que ocasiona el problema y se quiere definir, medir, analizar, mejorar o controlar.Los indicadores: Las características específicas, observables y medibles relacionadas con el problema de investigación
Esto nos demuestra la importancia que tiene decir que pasa, por qué y los efectos que tiene además de que nos ayuda a saber el problema y como justificarlo en la investigación.
el título de la investigación y se condensa en una frase que exprese la esencia de la idea.
Esto nos recuerda que el titulo no debe de ser largo, si no breve y conciso. El titulo debe facilitar comprender de que trata la investigación.
Las referencias presentan las fuentes de la investigación con el formato requerido por la institución para la que se trabaja
Es muy importante tener el respaldo con fuentes confiables y tener cuidado al citar, debemos usar las normas APA para evitar que sea plagio y aportar rigor a la investigación
es importante que se verifique la capacidad de realizar la investigación. Para ello se debe tomar en cuenta la disponibilidad de:Recursos humanosRecursos materialesRecursos financierosRecursos temporales
Esto nos indica que la investigación tiene que ser realista para que se pueda llevar a cabo y pueda desarrollarse.
La justificación explica el porqué de la investigación: por qué el proyecto es importante y necesario.
Esto nos indica que debemos tener una justificación clara y realista porque nos permite demostrar el valor de la investigación.
son las guías del estudio y durante todo su desarrollo deben procurarse. Además, han de ser congruentes entre sí.
Esto nos indica que son una guía constante, porque en el trayecto de la investigacion debemos cumplirlos, por eso tienen que ser reales y claros.
De la idea de investigación nace la pregunta central de investigación y las preguntas auxiliares de investigación
Esto nos dice lo mas importante hasta el momento, ya que esto destaca que siempre las preguntas nos ayudan y son la base de toda la investigación.
When Montezuma had finished, La Malinche translated his address into Spanish so that the Captain could understand it. Cortés replied in his strange and savage tongue, speaking first to La Malinche: “Tell Montezuma that we are his friends. There is nothing to fear. We have wanted to see him for a long time, and now we have seen his face and heard his words. Tell him that we love him well and that our hearts are contented.”
I think this very crucial because La Malinche becomes the bridge between the two worlds, interpreting for both of them.
Apoyo ventilatorio mecánico ++ El inicio de la ventilación con presión positiva no invasiva (NIPPV, noninvasive positive-pressure ventilation) en pacientes con insuficiencia respiratoria, definida como PaCO2 > 45 mmHg y pH ≤ 7.35
ventilacion con presion positiva no invasiva
A conceção das e-atividades deve tersempre em vista a avaliação
Este excerto reforça uma ideia central na docência a distância: as e-atividades não são apenas “tarefas online”, mas dispositivos pedagógicos com intencionalidade. Ao articular produção de conhecimento e desenvolvimento de competências, o texto lembra-nos que a avaliação deve ser parte integrante desde o início do design da atividade, e não surgir apenas como etapa final. Esta perspetiva aproxima-se de uma avaliação formativa e reguladora, essencial em contextos a distância.
desenho de uma e-atividade
Na minha opinião, é importante referir que o desenho das e-atividades apresentado no texto termina a sua análise em 2020, ou seja, num período anterior à integração generalizada da Inteligência Artificial generativa nos contextos educativos. Por isso, embora o modelo apresentado continue pedagogicamente válido, considero que ele já não responde totalmente aos desafios e possibilidades atuais do ensino digital.
Refletindo sobre o desenho das e-atividades à luz da IA, penso que hoje é necessário repensar o microdesign, não apenas em termos de objetivos, tarefas e ferramentas, mas também em relação ao papel explícito da IA na atividade. O desenho deve clarificar quando, como e para quê a IA pode ser usada, garantindo que apoia a aprendizagem sem substituir o envolvimento cognitivo do estudante.
A meu ver, a IA introduz novas oportunidades no desenho das e-atividades, como a personalização do percurso de aprendizagem, o feedback imediato e a adaptação das tarefas ao ritmo do aluno. No entanto, exige também um maior cuidado na formulação das atividades, privilegiando processos, reflexão e tomada de decisão, para evitar respostas automáticas ou pouco significativas.
Assim, considero que atualizar o desenho das e-atividades implica ir além do modelo pré-2020, integrando a IA como um elemento pedagógico consciente e regulado. Só desta forma será possível manter a centralidade do estudante, promover autonomia real e garantir que as e-atividades continuam a favorecer a construção de conhecimento num contexto educativo marcado pela presença da Inteligência Artificial.
Fornecer feedback: Após a conclusão da atividade deve serfornecido feedback construtivo aos alunos, destacando o queeles fizeram bem e onde podem melhorar
Sim, o feedback é importante. Em algumas e-atividades, como o caso de questionários com escolha múltipla, podem ser automatizados e isso permite ao aluno receber esse feedback na hora (quando a sua mente ainda está dentro da atividade). Mas também podem ser dadas diretrizes de autoavaliação que podem dar uma certa autonomia aos alunos. Para esclarecer um pouco este último ponto, vou à minha área de ensino (matemática). Se a atividade for, por exemplo, determinar a solução de um dado problema, o aluno pode (e deve ser encorajado a fazer) verificar se o resultado (que obteve através do método que está aprender) é de facto solução do problema através métodos alternativos (note que em geral é mais fácil verificar uma solução do que encontrar uma solução para a maioria dos problemas). Isto para além de dar autonomia, permite organizar o conhecimento encontrando pontos de relacionamento.
Mais do que a competência do docente ou do formador/a é necessário perceber, na minha opinião, que a relação entre abordagem pedagógica e e atividades funciona de forma dialógica, não hierárquica. Isto significa que a abordagem pedagógica é a visão, o enquadramento, a filosofia que impele a criação, a criatividade e a inovação no desenvolvimento de e-atividades. Se optamos por uma perspetiva Construtivista disponibilizamos e atividades colaborativas, projetos, coautoria. Se seguirmos a Aprendizagem Baseada em Projetos (PBL) propomos desafios, casos, simulações. Se nos focarmos no Conectivismo as tarefas são mediadas por e-atividades ligadas às redes e à participação em comunidades. Se usarmos uma Pedagogia Crítica então na base estarão os debates, a reflexão, a produção, em diferentes meios. As e atividades, por sua vez, são também desenhadas para materializar cada uma dessas visões ou todas em conjunto. As e-atividades também definem a abordagem, porque ao idealiza-las temos de perceber que tipo de interação é possível, que ferramentas potenciam e a que práticas nos referimos, que ritmos e dinâmicas emergem, que competências realmente se desenvolvem. Esta sinergia contínua, obriga a ajustar a abordagem, a repensar estratégias, a afinar objetivos. Em resumo: a abordagem orienta o desenho das e-atividades e as e-atividades refinam a abordagem.
As e atividades não são apenas as “tarefas online” são o reflexo de um mecanismo vivo, onde a abordagem pedagógica se manifesta, se testa, se afina e se concretiza. Implicam uma intencionalidade própria que se transforma em ação, através da qual o estudante se transforma em autor do seu conhecimento e da sua própria aprendizagem. Parafraseando a Professora Maria Barbas, as e-atividades são o “centro nevrálgico” da experiência digital, a “faísca” que acende o percurso de aprendizagem; uma espécie de “laboratório” onde competências, objetivos e estratégias ganham forma; e, sem dúvida, o “espaço de interação” entre estudantes, conteúdos, ferramentas e avaliação.
Barberà (2004). La educación en red. Barcelona: Paidós
La educación en red (Barberà, 2004) continua a ser uma obra relevante pelos seus fundamentos e pelo foco na mediação pedagógica, mas reflete uma geração anterior da educação em rede, anterior à generalização das redes sociais, à ubiquidade móvel e à incorporação da Inteligência Artificial, num contexto tecnológico e pedagógico muito diferente do atual. A bibliografia confirma a desatualização deste texto de Maria de Fátima Goulão [
dicar o que os alunos precisam fazer,como devem fazê-lo
Dizer a@s estudantes do ensino superior o que devem fazer e como devem fazê-lo não @s ajuda muito a desenvolver a autonomia e há ferramentas de IA que @s ajudam mais do que 1 docente que esteja lá para lhes dizer o que fazer e como fazer... Esta visão do ensino-aprendizagem está mesmo muito ultrapassada
Identificar o objetivo da aprendizagem: O que se quer que osalunos aprendam com a atividade.
Outra estratégia é deixar @s estudantes decidir o que querem aprender com a atividade e, a partir daí, então definir objetivos com el@s.
os itens a ter em conta são o conhecimento dos critérios de avaliaçãoe a adequação do tempo para a realização da tarefa.
Concordo totalmente e a Micro-credencial ganharia em melhorar nesta dimensão.
é tambémrelevante que as atividades propostas ao longo da ação formativa sejamdiversificadas e estejam de acordo com o nível educativo dos alunos;
Concordo totalmente. Se estivermos a falar com estudantes docentes do ensino superior, temos de propor atividades que estejam de acordo com o nível educativo "destes alunos".
onde seinclui o pensamento crítico, a resolução de problemas, a colaboração ea comunicação.
Para se conseguir pensamento crítico tem que se valorizar o pensamento crítico, o que é muitíssimo difícil para algumas pessoas. Um dos probemas é que, muitas vezes, a prática mostra que está tudo centrado predominantemente na exposição prolongada do docente, que responde ao pensamento crítico d@s estudantes de forma defensiva, em vez de o encorajar, seguindo modelos pedagógicos de transmissão de conteúdos com retórica colaborativa, que impedem um verdadeiro ecossistema de aprendizagem em rede.
as estratégias mais adequadas para aumentar o envolvimento e amotivação dos alunos
e, entre outras, quais são? As da Universidade Aberta?
participar ativamente da aprendizagem
não percebo
mundodigital atual
Atual? com referências de há mais de 10 anos? Sem uma única referência à Inteligência Artificial e à forma como @s estudantes aprendem? Tenho mais uma vez muita dificuldade em perceber o que se defende aqui
As diferenças fundamentais das e-atividades, relativamente a contextospresenciais, encontram-se na possibilidade que a rede nos oferece aofavorecer contextos interativos com a informação, como entre, por umlado professores e alunos; por outro, entre alunos entre si
Tenho alguma dificuldade intelectual em compreender a diferença, já que não há diferença nenhuma. As atividades presenciais também permitem favorecer contextos interativos com a informação, entre profs e estudantes e estudantes entre si. É que não percebo mesmo o que a senhora está a dizer.
al, as e-atividades são o elemento que facilita ainter-relação entre o Ensino e a Aprendizagem.Figura 3.3. | Papel da e-atividadeAs diferenças fundamentais das e-atividades, relativamente a contextospresenciais, encontram-se na possibilidade que a rede nos oferece aofavorecer contextos interativos com a informação, como entre, por umlado professores e alunos; por outro, entre alunos entre si. Esta possibilidadepermitirá realizar tarefas individuais, mas também de grupo, colaborativas.Falamos agora de estratégias de ensino e de aprendizagem no contextodigital como sendo aquelas que são utilizadas para apoiar a aprendizagemmediada pela tecnologia. As e-atividades são uma forma de estratégia deaprendizagem digital que envolve a utilização de atividades interativas,recursos e ferramentas digitais para apoiar a aprendizagem dos alunosCAPÍTULO 3
Pode facilitar, mas não tem de haver ensino nenhum. Em educação não formal, não se ensina, aprende-se sem ser ensinado. Ou seja, e-atividade » aprendizagem. O esquema é de 2014, muito desatualizado.
estratégias de ensino devem ser avaliadas regularmente
Muito bem! Seria bom que assim fosse na Micro-Credencial Docência em Rede.
Mais uma vez não faz sentido falar de conhecimentos e competências. Seria bom explicar à autora que os conhecimentos e as habilidades são dimensões das competências... Na página 36, a autora fala de habilidades, competências e conhecimentos! Não faz mesmo ideia do que são competências.
gumas das estratégias de aprendizagem mais incluem,a organização de informações – fazer resumos, criar mapas mentais, porexemplo; a elaboração de conceitos – relacionar novas informações comconhecimentos já existentes, fazer analogias, entre outro
Tudo isto é atualmente feito pel@s estudantes com recurso a IA. O texto está muito desatualizado. Referências bibliográficas de 2004, 2006 e 2011... @s estudantes precisam hoje de aprender outras coisas (entre outras, a usar a IA) e com outros métodos.
shows low stabilityin the environment (La Rosa et al., 2020a), the presence of viral geneticmaterial in the stool of positive subjects could reflect the abundance ofSARS-CoV-2 RNA content in untreated wastewaters
how did they discover this fact in the first place?
Anti-CD40 antibody (Clone 2C10R4; NHP Reagent Resource, Boston, MA, USA)
DOI: 10.1111/xen.12330
Resource: (NIH Nonhuman Primate Reagent Resource Cat# PR-4047, RRID:AB_2716325)
Curator: @giovanni.decastro
SciCrunch record: RRID:AB_2716325
Document de Synthèse : Déploiement et Relance de la Démarche « Promeneurs du Net » dans le Nord (59)
La démarche Promeneurs du Net (PdN) constitue une extension de l'action éducative en milieu physique vers l'espace numérique.
Portée par la Caisse d'Allocations Familiales (CAF) du Nord en partenariat avec la Fédération des Centres Sociaux, cette initiative vise à répondre à la présence accrue des jeunes de 12 à 25 ans sur les réseaux sociaux.
Après une période de mise en veille depuis 2019, le dispositif fait l'objet d'une relance stratégique intégrée à la Convention d'Objectifs et de Gestion (COG) 2023-2027.
Le déploiement est progressif, ciblant prioritairement les arrondissements d'Avesnes-sur-Helpe, Cambrai, Valenciennes et Douai, avant de s'étendre à Lille et Dunkerque en 2026.
L'objectif central est de professionnaliser la présence des acteurs de la jeunesse en ligne pour offrir un accompagnement bienveillant, prévenir les risques (cyberharcèlement, infox) et valoriser les compétences numériques des jeunes.
--------------------------------------------------------------------------------
• Historique : Inspirée d'une initiative suédoise des années 2000, la démarche a été introduite en France en 2012 (Manche) avant d'être généralisée par la CNAF en 2017.
• Situation dans le Nord : Déployée entre 2017 et 2019, la démarche a été suspendue avant d'être redynamisée en 2023. Elle s'inscrit désormais dans le Schéma Départemental des Services aux Familles.
La branche famille s'engage sur plusieurs axes majeurs :
1. Structuration de l'offre : Développer un accompagnement adapté aux besoins des adolescents.
2. Éducation aux médias : Renforcer les compétences critiques des jeunes face aux écrans.
3. Soutien à la parentalité : Accompagner les parents sur les thématiques des usages numériques.
Au 31 décembre 2023, le réseau national comptabilisait :
• Plus de 3 200 Promeneurs du Net actifs.
• Environ 316 000 jeunes suivis ou accompagnés.
• Une moyenne de 96 jeunes par professionnel labellisé.
• Un temps de présence en ligne moyen de 4 heures par semaine.
--------------------------------------------------------------------------------
Le Promeneur du Net est un professionnel de la jeunesse (animateur, éducateur, conseiller) qui poursuit sa mission éducative sur Internet. Sa présence est :
• Mandatée : Officiellement reconnue et cadrée par l'employeur.
• Bienveillante : Fondée sur l'écoute, le non-jugement et la non-intrusivité.
• Identifiée : Le professionnel utilise des comptes clairement identifiés comme "Promeneur du Net".
| Domaine | Actions spécifiques | | --- | --- | | Lien Social | Favoriser les échanges et la socialisation en ligne. | | Prévention | Veille éducative, lutte contre le cyberharcèlement et la radicalité. | | Information | Diffusion d'informations généralistes ou ciblées (santé, insertion). | | Citoyenneté | Développement de l'esprit critique face aux discours manipulatoires. | | Accompagnement | Soutien aux initiatives de jeunes et aux projets collaboratifs. |
--------------------------------------------------------------------------------
Le dispositif s'adresse aux jeunes de 12 à 25 ans. Les structures concernées incluent :
• Centres sociaux et Espaces de Vie Sociale (EVS).
• Missions locales et clubs de prévention.
• Services jeunesse des collectivités territoriales.
• Associations locales et structures spécialisées (addictions, culture).
• Note : Les bénévoles et les activités à caractère commercial sont strictement exclus.
Présence Numérique et Réseaux Sociaux
Initialement centré sur Facebook, le dispositif s'est diversifié pour suivre les usages des jeunes :
• Réseaux prioritaires : Instagram, Snapchat, TikTok.
• Messageries et outils : WhatsApp, Discord.
• Horaires : Environ 30 % des professionnels interviennent sur des horaires atypiques (soirées, week-ends) pour correspondre aux pics de présence des jeunes.
--------------------------------------------------------------------------------
Le déploiement est organisé en deux phases temporelles :
1. Phase 1 (En cours) : Arrondissements d'Avesnes-sur-Helpe, Cambrai, Valenciennes et Douai.
2. Phase 2 (Courant 2026) : Arrondissements de Lille et Dunkerque.
La coordination est externalisée auprès de la Fédération des Centres Sociaux. Ses missions sont :
• Accompagnement : Soutien technique et méthodologique quotidien des professionnels.
• Formation : Organisation de la formation initiale et continue.
• Pilotage : Co-animation du projet avec les partenaires institutionnels (CAF, Département, État, MSA).
• Neutralité : La coordination accompagne toutes les structures, qu'elles soient adhérentes ou non à la Fédération.
--------------------------------------------------------------------------------
L'accession au titre de Promeneur du Net suit un protocole rigoureux en cinq étapes :
1. Candidature : Envoi d'un dossier simplifié (fiche structure et fiche candidat) et signature de la Charte Promeneur du Net.
2. Commission de Labellisation : Examen du dossier par un comité technique (CAF, État, Département, MSA, Fédération).
3. Formation Initiale : Participation obligatoire à une journée de formation (posture éducative, outils, réseau).
4. Entretien de Mise en Place : Échange sur site entre la coordination, le professionnel et la direction de la structure (environ 4h) pour valider les moyens matériels et le temps dédié.
5. Labellisation Officielle : Création des comptes professionnels, définition de la ligne éditoriale et inscription sur la cartographie nationale.
Pour les structures bénéficiant d'un agrément Prestation de Service (PS) Jeune, l'inscription dans la démarche Promeneur du Net est une obligation contractuelle mentionnée dans le cahier des charges national.
Cette participation sera une condition examinée lors du renouvellement des agréments.
--------------------------------------------------------------------------------
La coordination propose plusieurs outils pour rompre l'isolement du professionnel :
• Espaces de discussion : Utilisation d'outils collaboratifs (type Mattermost ou Discord) pour l'échange de pratiques.
• Points du Net : Webinaires et conférences thématiques (8 par an) sur des sujets comme l'intelligence artificielle, la protection des données ou la radicalité en ligne.
• Rencontres physiques : Deux temps d'échange de pratiques par an en présentiel.
• Évaluation annuelle : Suivi de l'activité via un outil simplifié pour recenser le nombre de jeunes contactés et les problématiques rencontrées.
--------------------------------------------------------------------------------
• Dépôt des dossiers : Jusqu'au 6 février pour la prochaine salve.
• Commission de labellisation : Fixée au 2 mars.
• Dates de formation initiale :
◦ 27 mars 2024. ◦ 15 mai 2024.
• Fréquence des commissions : Une instance de labellisation se réunit mensuellement pour assurer un traitement fluide des candidatures "au fil de l'eau".
They didn’t want to show Americans depicted like this. There were people who wanted to burn the files, to destroy these pictures and their negatives, everything
La idea de que le molestaba a los Americanos mostrar estas fotos de su realidad, se me hace muy hipócrita para lo que hacen en otros lugares del mundo. Donde, usualmente fotógrafos extranjeros, toman fotos explícitamente en situaciones similares.
The backstory about that, which is rarely told, is that Lange was driving home to Berkeley, California, when she looked out the window of her car and she saw a migrant camp over on the side of the road. She thought to herself, I wonder what that’s all about, and drove in, only to discover something really quite horrible. What she learned was that an early frost had wiped out the pea crop and the farmers essentially had no work and were starving — some to starving to death.
Me reflejo en esto porque mi madre no habla ingles, me puedo imaginar a mi madre poniéndose en una mala situación por no conocer el contexto de lo que esta pasando, como le paso a la "Migrant Mother" de la foto.
In the convict camp in Greene County
Me encanta esta fotografía porque están bailando en lo que parece una cárcel (convict camp). Me pregunto por qué estarían ellos ahí. Uno está bailando, otro toca la guitarra, y el otro aplaudiendo. Los demos no participan, pero hay un hombre hasta el fondo que los observa (creo que es un guardia). No me puedo imaginar cómo se dio ese momento, pero me gustaría creer que ellos tuvieron esperanza o, al menos, un breve encuentro con la felicidad.
Synthèse de la Conférence de Pierre Périer : Les Enjeux de la Coéducation et du Lien École-Famille
Ce document de breffage synthétise les interventions de Pierre Périer, sociologue et professeur en sciences de l’éducation, lors de sa conférence sur les relations entre l’école et les familles, particulièrement au sein des quartiers populaires et en contexte de précarité.
La réussite du plus grand nombre d’élèves dépend d’un enjeu majeur : la construction d’un lien solide et cohérent entre l’école et les familles.
Pierre Périer démontre que si la « coéducation » est devenue un mot d’ordre institutionnel, sa mise en œuvre se heurte à des obstacles structurels, symboliques et sociaux.
Les familles les plus précaires, souvent qualifiées d’« invisibles », ne sont pas démissionnaires mais se trouvent disqualifiées par des règles du jeu scolaire dont elles ne maîtrisent pas les codes.
Pour réussir cette alliance, l’institution doit passer d’une logique descendante de « formatage » des parents à une logique de reconnaissance des « parents réels », en s'appuyant sur des médiateurs tiers et en rendant les attentes scolaires explicites.
--------------------------------------------------------------------------------
L'intérêt croissant pour le lien école-famille s'inscrit dans un contexte de défis sociétaux profonds que l’école ne peut résoudre seule.
• La lutte contre l’échec scolaire : L'objectif est d'assurer la réussite du plus grand nombre et d'éviter que l'échec ne touche systématiquement les mêmes catégories sociales.
L'échec scolaire a des conséquences lourdes sur l'identité et l'insertion des jeunes.
• L'exigence d'équité : L'école doit devenir plus juste vis-à-vis de la diversité des élèves.
• La gestion de la diversité : L'école fait face à une hétérogénéité croissante (origines, trajectoires, formes familiales).
Cette complexité nécessite une meilleure connaissance des familles par l'institution.
• La quête de sens : Le lien école-famille est le levier de la « mobilisation scolaire ».
Si l’enfant perçoit une continuité et une cohérence entre sa famille et sa classe, il donne plus de sens aux savoirs et persévère davantage.
Pierre Périer souligne la nécessité de définir les termes utilisés pour éviter qu'ils ne deviennent des évidences non questionnées (une « doxa »).
| Terme | Définition et Enjeux | | --- | --- | | Coéducation | Finalité reposant sur une responsabilité partagée dans l'éducation et la réussite de l'enfant. | | Coopération | Méthode basée sur l'action réciproque : l'action de l'un doit renforcer l'action de l'autre. Cela suppose de connaître précisément ce que fait le partenaire. | | Collaboration | Fait de « faire ensemble » avec des moyens qui peuvent être différents pour atteindre un objectif énoncé. | | Alliance éducative | Terme récent soulignant la nécessité de construire un front commun entre divers acteurs. |
Note cruciale : La coéducation ne signifie pas que les parents et les enseignants doivent faire la même chose ou agir à parts égales. Elle nécessite une division du travail éducatif claire et explicitée.
L’analyse sociologique révèle que la difficulté de liaison provient souvent de la nature même de l’institution scolaire.
C’est l’institution scolaire qui définit seule les règles du jeu, les modalités de rencontre et l’image du « bon parent ».
Ce schéma descendant exclut ceux qui n’ont pas les ressources pour s'y conformer.
• Le seuil de l'école : Le portail représente une frontière symbolique.
En le franchissant, l'individu passe du statut de « parent » à celui de « parent d'élève », un rôle normé par l'école.
• Le rapport au temps et à la langue : Les réunions et les prises de rendez-vous supposent une familiarité avec les usages sociaux de l'école.
Pour beaucoup de parents vulnérables, prendre rendez-vous est une démarche intimidante qui nécessite de se sentir légitime.
• La peur de l'intrusion : Les familles les plus précaires redoutent que l'école soit intrusive dans leur vie privée ou que leur parole ne les discrédite (sentiment de honte ou d'ignorance).
L'école impose des normes (ex: l'aide aux devoirs) qui renforcent les inégalités.
Demander aux parents de superviser les devoirs favorise les familles dotées de capital culturel et pénalise celles dont les parents ont eu une scolarité courte ou douloureuse.
Face à l'impossibilité pour l'école de tout résoudre seule, les acteurs socio-éducatifs et culturels du territoire jouent un rôle de « pont ».
• Créer un maillage territorial : Aucun parent ne doit rester isolé.
Les structures de quartier permettent une « capillarité » sociale reliant les familles à l'institution par des voies détournées.
• L’effet Pygmalion : Les acteurs tiers peuvent renvoyer une image positive aux jeunes qui doutent de leurs capacités.
En valorisant d'autres compétences, ils aident l'élève à reprendre confiance et à redonner du sens à sa scolarité.
• L'émancipation : Ces médiations permettent aux jeunes et aux parents de « s'autoriser à être différents » de l'image d'échec que l'institution peut parfois leur renvoyer.
Pierre Périer propose plusieurs principes directeurs pour transformer les pratiques de terrain :
1. Interconnaissance et Reconnaissance : Il est crucial de se connaître entre acteurs (qui fait quoi ?).
Un premier contact positif et non scolaire dès le mois de septembre est essentiel pour bâtir une base de confiance avant l'émergence d'éventuels problèmes.
2. Légitimation et Autorisation : Il faut faire des parents des « auteurs » et non de simples « acteurs » de projets.
Cela implique de partir de ce qu'ils proposent (les « parents réels ») plutôt que d'attendre qu'ils s'adaptent à un cadre pré-établi.
3. Explicitation : « Plus c’est explicite, plus c’est démocratique ».
L'absence de clarté favorise la « connivence culturelle » entre l'école et les classes moyennes, au détriment des classes populaires.
4. Acceptation du conflit : Le désaccord ne doit pas être évité par un « faux consensus ».
Le conflit, s'il est exprimé et écouté dans un cadre protégé, peut être « socialisateur » et permettre de dégager des solutions nouvelles et partagées.
5. Accompagnement plutôt que formatage : L'objectif ne doit pas être de « former » les parents (ce qui renforce l'asymétrie), mais de les accompagner en s'appuyant sur leurs ressources propres.
Le document mentionne plusieurs initiatives concrètes favorisant le lien :
• Groupes de parole (type ATD Quart Monde) : Espaces où la parole des parents est protégée et écoutée, permettant de sortir de l'isolement.
• Espaces Parents et Cafés des Parents : Lieux d'information et d'échange dans l'école, dont les parents peuvent s'approprier le fonctionnement.
• Ouvrir l'école aux parents pour la réussite des enfants (OEPRE) : Dispositif permettant aux parents primo-arrivants d'apprendre le français et le fonctionnement de l'école, favorisant leur autonomisation et leur pouvoir d'agir.
• Classes Passerelles : Facilitent la transition entre la petite enfance et la maternelle par un accueil conjoint des mères et des enfants.
• Actions de transition : Importance du travail sur le passage de l'élémentaire au collège, période où les inégalités se creusent brutalement et où le lien avec les familles se fragilise.
La coéducation est un processus complexe qui exige de rompre avec l'image du parent « démissionnaire » pour comprendre les obstacles réels à l'implication.
La réussite de ce lien repose sur la capacité de l'école et de ses partenaires territoriaux à reconnaître la place de chaque parent, à expliciter les codes scolaires et à construire une confiance mutuelle dès le début du parcours de l'enfant.
'La Migra' by Pat Mora is a really good/powerful poem"
Id be interested in reading this because it relates to what's going on right now in our society
Note: This response was posted by the corresponding author to Review Commons. The content has not been altered except for formatting.
Learn more at Review Commons
Reviewer #1 (Evidence, reproducibility and clarity (Required)):
Summary:
The study provides a comprehensive overview of genome size variation in two related species of the genus Epidendrum, which appear to be homoploid, although their DNA content more closely corresponds to that of heteroploid species. While I have a few serious concerns regarding the data analysis, the study itself demonstrates a well-designed approach and offers a valuable comparison of different methods for genome size estimation. In particular, I would highlight the analysis of repetitive elements, which effectively explains the observed differences between the species. However, I encourage the authors to adopt a more critical perspective on the k-mer analysis and the potential pitfalls in data interpretation.
Major comments:
R1. p. 9: Genome size estimation via flow cytometry is an incorrect approach. The deviation is approximately 19% for E. anisatum and about 25% for E. marmoratum across three repeated measurements of the same tissue over three days? These values are far beyond the accepted standards of best practice for flow cytometry, which recommend a maximum deviation of 2-5% between repeated measurements of the same individual. Such variability indicates a systemic methodological issue or improper instrument calibration. Results with this level of inconsistency cannot be considered reliable estimates of genome size obtained by flow cytometry. If you provide the raw data, I can help identify the likely source of error, but as it stands, these results are not acceptable.
__A: __Thanks a lot for pointing out this issue. We have identified the source of the wide interval after consulting with the staff of LabNalCit. We originally used human peripheral blood mononuclear cells (PBMCs) as a reference to estimate the genome size (GS) of P. sativum and used the resulting range to estimate the GS of Epidendrum. We calculated P. sativum's GS using a wide human GS range of 6-7 Gb, which resulted in a wide range of P. sativum GS and, consequently, in a wide range of GS for our samples. Therefore, the wide range reported is not an issue with the instruments, but about the specifics of the analysis.
__We have done the following changes: __
R1. p. 14 and some parts of Introduction: It may seem unusual, to say the least, to question genome size estimation in orchids using flow cytometry, given that this group is well known for extensive endoreplication. However, what effect does this phenomenon have on genome size analyses based on k-mers, or on the correct interpretation of peaks in k-mer histograms? How can such analyses be reliably interpreted when most nuclei used for DNA extraction and sequencing likely originate from endoreplicated cells? I would have expected a more detailed discussion of this issue in light of your results, particularly regarding the substantial variation in genome size estimates across different k-mer analysis settings. Could endoreplication be a contributing factor?
A:
We reworded the introduction p.3, 2nd paragraph to make our point on the effect of endoreplication on flow cytometry clearer. We eliminated the following sentence from discussion p. 15 : "Difficulties for cytometric estimation of genome size can thus be taxon-specific. Therefore, cross-validating flow cytometry and bioinformatics results can be the most effective method for estimating plant genome size, especially when only tissues suspected to show significant endoreplication, such as leaves, are available" We added the following, p. 18: Genome size estimation for non-model species is considered a highly standardized approach. However, tissue availability and intrinsic genome characteristics (large genomes, polyploidy, endoreplication, and the proportion of repetitive DNA) can still preclude genome size estimation (e.g. Kim et al. 2025) using cytometry and bioinformatic tools. Cross-validating flow cytometry and bioinformatics results might be particularly useful in those cases. For example, when only tissues suspected of showing significant conventional endoreplication, such as leaves, are available, bioinformatic tools can help to confirm that the first peak in cytometry histograms corresponds to 2C. Conversely, bioinformatic methods can be hindered by partial endoreplication, which only flow cytometry can detect.
4. We included a paragraph discussing the effect of CE and PE on bioinformatic GS estimation P. 17:
Besides ploidy level, heterozygosity, and the proportion of repetitive DNA, k-mer distribution can be modified by endoreplication. Since endoreplication of the whole genome (CE) produces genome copies (as in preparation for cell division, but nuclear and cell division do not occur ), we do not expect an effect on genome size estimates based on k-mer analyses. In contrast, PE alters coverage of a significant proportion of the genome, affecting k-mer distributions and genome size estimates (Piet et al., 2022). Species with PE might be challenging for k-mer-based methods of genome size estimation.
R1. You repeatedly refer to the experiment on genome size estimation using analyses with maximum k-mer coverage of 10,000 and 2 million, under different k values. However, I would like to see a comparison - such as a correlation analysis - that supports this experiment. The results and discussion sections refer to it extensively, yet no corresponding figure or analysis is presented.
A:
We had previously included the results of the analyses using different k-mer coverage in the Supplementary Data Figure S2. We have added, to formally compare the results using analyses with maximum k-mer coverage of 10,000 and 2 million, a Wilcoxon paired signed-rank test, which showed a significant difference, p. 12: The estimated genome sizes using a maximum count value of 10,000 were generally lower for all tools in both species compared to using a maximum count value of 2 million (median of 2M experiment genome size - median of 10K experiment genome size= 0.24 Gb). The estimated genome size of the 2 million experiment also tended to be closer to the flow cytometry genome size estimation with significantly lower MAD than the 10K experiment (Wilcoxon paired signed-rank test p = 0.0009). In the 10K experiment (Supplementary Data Figure S2; S3), the tool with the lowest MAD for E. anisatum was findGSE-het (0.546 Gb) and for E. marmoratum it was findGSE-hom (0.116 Gb).
2. We have added a boxplot in the Supplementary Data Figure S3 depicting the mean absolute deviations using maximum k-mer coverage of 10,000 and 2 million compared to flow cytometry.
Minor comments:
R1. p. 3: You stated: "Flow cytometry is the gold standard for genome size estimation, but whole-genome endoreplication (also known as conventional endoreplication; CE) and strict partial endoreplication (SPE) can confound this method." How did you mean this? Endopolyploidy is quite common in plants and flow cytometry is an excellent tool how to detect it and how to select the proper nuclei fraction for genome size estimation (if you are aware of possible misinterpretation caused by using inappropriate tissue for analysis). The same can be applied for partial endoreplication in orchids (see e.g. Travnicek et al 2015). Moreover, the term "strict partial endoreplication" is outdated and is only used by Brown et al. In more recent studies, the term partial endoreplication is used (e.g. Chumova et al. 2021- 10.1111/tpj.15306 or Piet et al. 2022 - 10.1016/j.xplc.2022.100330).
A:
We have reworded the paragraph where we stated "Flow cytometry is the gold standard for genome size estimation", as in the answer to Major comment 2. Additionally, we highlighted in the discussion how, while FC is the gold standard for GS estimation, studying multiple alternatives to it may be important for cases in which live tissue is not available or is available only to a limited extent (i.e. only certain tissues), p. 18 We have changed the term "strict partial endoreplication" to partial endoreplication (PE).
R1. p. 5: "...both because of its outstanding taxic diversity..." There is no such thing as "taxic" diversity - perhaps you mean taxonomic diversity or species richness.
__A: __We have changed "taxic diversity" to "species diversity".
R1. p. 6: In description of flow cytometry you stated: "Young leaves of Pisum sativum (4.45
pg/1C; Doležel et al. 1998) and peripheral blood mononuclear cells (PBMCs) from healthy
individuals...". What does that mean? Did you really use blood cells? For what purpose?
A: Please find the explanation and the modifications we've made in the answer to major comment 1.
R1. p. 7: What do you mean by this statement "...reference of low-copy nuclear genes for each species..."? As far as I know, the Granados-Mendoza study used the Angiosperm v.1 probe set, so did you use that set of probes as reference?
__A: __We rewrote: "To estimate the allele frequencies, the filtered sequences were mapped to a
reference of low-copy nuclear genes for each species" to:
To estimate the allele frequencies, the filtered sequences were mapped to the Angiosperm v.1 low-copy nuclear gene set of each species.
R1. p. 7: Chromosome counts - there is a paragraph of methodology used for chromosome counting, but no results of this important part of the study.
A: We are including a supplementary figure (Supplementary Data Figure 7) with micrographs of the chromosomes of E. anisatum and E. marmoratum.
R1. p. 12: Depth of coverage used in repeatome analysis - why did you use different coverage for both species? Any explanation is needed.
A: To make explicit the fact that the depth of coverage is determined automatically by the analysis with no consideration for the amount of input reads, but only of the graph density and the amount of RAM available (Box 3 in Novak et al. 2020), we rewrote:
"To estimate the proportion of repetitive DNA, the individual protocol analyzed reads corresponding to depths of coverage of 0.06× for Epidendrum anisatum and 0.43× for E. marmoratum." to
To estimate the proportion of repetitive DNA, the RepeatExplorer2 individual protocol determined a max number of analyzed reads (Nmax) corresponding to depths of coverage of 0.06x for Epidendrum anisatum and 0.43x for E. marmoratum.
R1. p. 16: The variation in genome size of orchids is even higher, as the highest known DNA amount has been estimated in Liparis purpureoviridis - 56.11 pg (Travnicek et al 2019 - doi: 10.1111/nph.15996)
A: We have updated it.
R1. Fig. 1 - Where is the standard peak on Fig. 1? You mention it explicitly on page 9 where you are talking about FCM histograms.
A: We reworded the results, eliminating the references to the standard internal reference.
Reviewer #1 (Significance (Required)):
Significance
This study provides a valuable contribution to understanding genome size variation in two Epidendrum species by combining flow cytometry, k-mer analysis, and repetitive element characterization. Its strength lies in the integrative approach and in demonstrating how repetitive elements can explain interspecific differences in DNA content. The work is among the first to directly compare flow cytometric and k-mer-based genome size estimates in orchids, extending current knowledge of genome evolution in this complex plant group. However, the study would benefit from a more critical discussion of the limitations and interpretative pitfalls of k-mer analysis and from addressing methodological inconsistencies in the cytometric data. The research will interest a specialized audience in plant genomics, cytogenetics, and genome evolution, particularly those studying non-model or highly endoreplicated species.
Field of expertise: plant cytogenetics, genome size evolution, orchid genomics.
Reviewer #2 (Evidence, reproducibility and clarity (Required)):
Summary:
With this work, the authors provide genome profiling information on the Epidendrum genus. They performed low-coverage short read sequencing and analysis, as well as flow cytometry approaches to estimate genome size, and perform comparative analysis for these methods. They also used the WGS dataset to test different approaches and models for genome profiling, as well as repeat abundance estimation, empathising the importance of genome profiling to provide basic and comparative genomic information in our non-model study species. Results show that the two "closely-related" Epidendrum species analysed (E. marmoratum and E. anisatum) have different genome profiles, exhibiting a 2.3-fold genome size difference, mostly triggered by the expansion of repetitive elements in E. marmoratum, specially of Ty3-Gypsy LTR-retrotransposon and a 172 tandem repeat (satellite DNA).
Major comments:
Overall, the manuscript is well-written, the aim, results and methods are explained properly, and although I missed some information in the introduction, the paper structure is overall good, and it doesn't lack any important information. The quality of the analysis is also adequate and no further big experiments or analysis would be needed.
However, from my point of view, two main issues would need to be addressed:
__R2. __The methods section is properly detailed and well explained. However, the project data and scripts are not available at the figshare link provided, and the BioProject code provided is not found at SRA. This needs to be solved as soon as possible, as if they're not available for review reproducibility of the manuscript cannot be fully assessed.
__A: __We have made public the .histo files for all depths of coverage and cluster table files necessary to reproduce the results. We will also make public a fraction of the sequencing sufficient to reproduce our genome size and repetitive DNA results as soon as the manuscript is formally published. Whole dataset availability will be pending on the publication of the whole genome draft.
R2. The authors specify in the methods that 0.06x and 0.43x sequencing depths were used as inputs for the RE analysis of E. anisatum and E. marmoratum. I understand these are differences based on the data availability and genome size differences. However, they don't correspond to either of the recommendations from Novak et al (2020):
In the context of individual analysis: "The number of analyzed reads should correspond to 0.1-0.5× genome coverage. In the case of repeat-poor species, coverage can be increased up to 1.0-1.5×." Therefore, using 0.06x for E. anisatum should be justified, or at least addressed in the discussion.
Moreover, using such difference in coverage might affect any comparisons made using these results. Given that the amount of reads is not limiting in this case, why such specific coverages have been used should be discussed in detail.
In the context of comparative analysis: "Because different genomes are being analyzed simultaneously, the user must decide how they will be represented in the analyzed reads, choosing one of the following options. First, the number of reads analyzed from each genome will be adjusted to represent the same genome coverage. This option provides the same sensitivity of repeat detection for all analyzed samples and is therefore generally recommended; however, it requires that genome sizes of all analyzed species are known and that they do not substantially differ. In the case of large differences in genome sizes, too few reads may be analyzed from smaller genomes, especially if many species are analyzed simultaneously. A second option is to analyze the same number of reads from all samples, which will provide different depth of analysis in species differing in their genome sizes, and this fact should be considered when interpreting analysis results. Because each of these analysis setups has its advantages and drawbacks, it is a good idea to run both and cross-check their results."
Therefore, it should be confirmed how much it was used for this approach (as in the methods it is only specified how much it was used for the individual analysis), and why.
__A: __In Box 3, Novak et al (2020) explain that the number of analyzed reads (Nmax) is determined automatically by RepeatExplorer2, based on the graph density and available RAM. Therefore, the reported depths of coverage are results, not the input of the analysis. We tried different amounts of reads as input and got consistently similar results, so we kept the analysis using the whole dataset.
For the comparative analysis, we have added the resulting depth of coverage and explained that we used the same number of reads for both species.
Added to methods:
"For the comparative protocol, we used the same amount of reads for both species".
Added to results:
"To estimate the proportion of repetitive DNA, the RepeatExplorer2 individual protocol determined a maximum number of analyzed reads (Nmax) corresponding to depths of coverage of 0.06x for E. anisatum and 0.43x for E. marmoratum. "
"The RepeatExplorer2 comparative protocol determined a maximum number of analyzed reads (Nmax) corresponding to depths of coverage of approximately 0.14x for E. marmoratum and 0.06x for E. anisatum"
This is consistent with other works which utilize RepeatExplorer2, for example, Chumová et al (2021; https://doi.org/10.1111/tpj.15306), who wrote: "The final repeatome analysis for each species was done using a maximum number of reads representing between 0.049x and 1.389x of genome coverage."
Minor comments:
General comments:
- The concept of genome endoreplication and the problem it represents for C-value estimations needs to be better contextualised. It would be nice to have some background information in the introduction on how this is an issue (specially in Orchid species). Results shown are valuable and interesting but require a little more context on how frequent this is in plants, especially in Orchids, and across different tissues.
__A: __We have included information about the variation of conventional and partial endoreplication in plants.
Differences in CE may also occur between individuals or even respond to environmental factors (Barow 2006). In contrast, PE results in cells that replicate only a fraction (P) of the genome (Brown et al. 2017) and it has only been reported in Orchidaceae (Brown et al. 2017). CE and PE can occur in one or several endoreplication rounds, and different plant tissues may have different proportions of 2C, 4C, 8C ... nC or 2C, 4E, 8E, ... nE nuclear populations, respectively. The 2C nuclear population sometimes constitutes only a small fraction in differentiated somatic tissues and can be overlooked by cytometry (Trávníček et al. 2015). Using plant tissues with a high proportion of the 2C population (such as orchid ovaries and pollinaria) can help overcome this difficulty (Trávníček et al. 2015; Brown et al. 2017).
Comments and suggestions on the figures:
__R2. __In fig 1, the flow cytometry histograms need to be more self-explanatory. What are the Y axis "counts" of? Also, please either place the label for both rows or for each, but don't make it redundant. The axis fonts need to be made a bit larger too. If possible, explain briefly in the figure legend (and not only in the text) what each peak means.
__A: __We have modified the figure adding legends for Y and X axes, eliminated redundant labels, and changed the font size.
__R2. __Fig 5. Horizontal axis labels are illegible. Please make these larger (maybe make the plot wider by moving the plot legend to the top/bottom of the figure? - just a suggestion).
__A: __We consider the horizontal axis label to be superfluous and we removed it.
Small text editing suggestions:
R2. Methods, "Ploidy level estimation and chromosome counts" section. It would be easier for the reader if this paragraph were either divided into two methods sections, or into two paragraphs at least, since these are two very different approaches and provide slightly different data or information.
A: We slightly modified: "Chromosome number was counted from developing root tips" to
"Additionally, to confirm ploidy level, chromosome number was counted from developing root tips" and changed the subtitle to only "Ploidy level estimation".
R2. Methods, "Genome size estimation by k-mer analysis" section. Please specify whether the coverage simulations (of 5x to 40x) were made based on 1c or 2c of the genome size? I assumed haploid genome size but best to clarify.
A: We have added it to P7: "To assess the suitability of the whole dataset and estimate the minimum coverage required for genome size estimation, the depth of coverage of both datasets was calculated based on the flow cytometry 1C genome size values."
R2. Results, "Genome size estimation by k-mer analysis and ploidy estimation" section. In the first two paragraphs, the results presented appear to conform to anticipated patterns based on known properties of these types of datasets. Although this information confirms expected patterns, it does not provide new or biologically significant insights into the genomes analysed. It may be beneficial to further summarize these paragraphs so that the focus of this section can shift toward the comparison of methods and the biological interpretation of the genome profiles of Epidendrum.
__A: __We agree that those paragraphs deviate a little from the focus of our results. However, we believe they provide useful information both for pattern confirmation in a relatively understudied field and for readers which may not be very familiar with the methods utilized.
__R2. __Discussion, "Genome size estimation using flow cytometry" section. In the second paragraph, it is discussed how potential endoduplication events can "trick" the flow cytometry measurements. This has probably previously been discussed on other C-value calculation studies and would benefit from context from literature. How does this endoduplication really affect C-value measurements across plant taxa? I understand it is a well-known issue, so maybe add some references?
A: We have included in the Introduction information about CE and PE and their associated references. P. 3 and 4.
__R2. __Discussion, "Repetitive DNA composition in Epidendrum anisatum and E. marmoratum" section. In the second paragraph, when mentioning the relative abundance of Ty3-gypsy and Ty1-copia elements, it is also worth mentioning their differences in genomic distribution and the potential structural role of Ty3-gypsy elements.
A: We added this paragraph in P.20:
"Ty3-gypsy elements are frequently found in centromeric and pericentromeric regions, and may have an important structural role in heterochromatin (Jin et al. 2004; Neumann et al. 2011; Ma et al. 2023), particularly those with chromodomains in their structure (chromovirus, i.e. Tekay, CRM transposons; Neumann et al. 2011). Conversely, Ty1-copia elements tend to be more frequent in gene-rich regions (Wang et al. 2025A). However, Ty3-gypsy chromovirus elements can be found outside the heterochromatin regions (Neumann et al. 2011), and in Pennisetum purpureum (Poaceae) Ty1-copia elements are more common in pericentromeric regions (Yu et al. 2022)."
R2. Discussion, "Repetitive DNA composition in Epidendrum anisatum and E. marmoratum" section. In the third paragraph, it is mentioned that both species have 2n=40. I believe these are results from this work since there is a methods section for chromosome counting. This data should therefore go into results.
__A: __We have added the chromosome count micrographs as Supplementary Data Fig. S7
R2. Discussion, "Repetitive DNA composition in Epidendrum anisatum and E. marmoratum" section. I'd recommend expanding a bit more on repetitive DNA differences based on the RepeatExplorer results. Providing references on whether this has been found in other taxa would be helpful too. For example, Ogre bursts have been previously described in other species (e.g. legumes, Wang et al., 2025). Moreover, I consider worth highlighting and discussing other interesting differences found, such as the differences in unknown repeats (could be due to one species having "older" elements- too degraded to give any database hits- compared to the other), or Class II TE differences between species (and how these account less for genome size difference because of their size), etc.
A: We have rearranged and added discussion expanding on the role of repetitive DNA in E. anisatum and E. marmoratum and how it relates to the repetitive DNA in other species. This includes Ogre transposons, an expanded Ty1-copia vs. Ty3-gypsy discussion, and a section on unclassified repeats and can be found on P.19 to P.21.
Reviewer #2 (Significance (Required)):
Overall, this study provides a valuable contribution to our understanding of genome size diversity and repetitive DNA dynamics within Epidendrum, particularly through its combined use of low-coverage sequencing, flow cytometry, and comparative genome profiling. Its strongest aspects lie in the clear methodological framework and the integration of multiple complementary approaches, which together highlight substantial genome size divergence driven by repeat proliferation-an insight of clear relevance for orchid genomics and plant genome evolution more broadly.
While the work would benefit from improved data availability, additional contextualization of the problem of endoreduplication in flow cytometry, and clarification of some figure elements and methodological details, the study nonetheless advances the field by presenting new comparative genomic information for two understudied species and by evaluating different strategies for genome profiling in non-model taxa.
The primary audience will include researchers in non-model plant genomics, cytogenetics, and evolutionary biology, although the methodological comparisons may also be useful to a broader community working on genome characterization in diverse lineages. My expertise is in plant genomics, genome size evolution, and repetitive DNA biology; I am not a specialist in flow cytometry instrumentation or cytological methods, so my evaluation of those aspects is based on general familiarity rather than technical depth.
Reviewer #3 (Evidence, reproducibility and clarity (Required)):
A review on "Nuclear genome profiling of two Mexican orchids of the genus Epidendrum" by Alcalá-Gaxiola et al. submitted to ReviewCommons
The present manuscript presented genomic data for two endemic Maxican orchids: Epidendrum anisatum and E. marmoratum. Authors aim to determine the genome size and ploidy using traditional (flow cytometry and chromosome counts) and genomic techniques (k-mer analysis, heterozygosity), along with the repetitive DNA composition characterization.
Considering the genomic composition, the main difference observed in repeat composition between the two species was attributed to the presence of a 172 bp satDNA (AniS1) in E. anisatum, which represents about 11% of its genome but is virtually absent in E. marmoratum. The differences in the genomic proportion of AniS1 and Ty3-gypsy/Ogre lineage TEs between E. anisatum and E. marmoratum are suggested as potential drivers of the GS difference identified between the two species.
Our main concern are about the GS estimation and chromosome number determination. Along with many issues related to GS estimations by flow cytometry, results related to chromosome number determination are missing on the manuscript. Improvements in both techiniques and results are crucial since authors aim to compare different methods to GS and ploidy determination.
__R3. __Genome size: Following the abstract, it is no possible to understand that authors confirm the GS by flow cytometry - as clarified after on the manuscript. Please, since the approach used to obtain the results are crucial on this manuscript, make it clear on the abstract.
A: We have highlighted the congruence of flow cytometry and bioinformatic approaches in the abstract:
"Multiple depths of coverage, k values, and k-mer-based tools for genome size estimation were explored and contrasted with cytometry genome size estimations. Cytometry and k-mer analyses yielded a consistently higher genome size for E. anisatum (mean 1C genome size = 2.59 Gb) than * E. marmoratum* (mean 1C genome size = 1.13 Gb), which represents a 2.3-fold genome size difference."
__R3.__Flow cytometry methodology: For a standard protocol, it is mandatory to use, at least, three individuals, each one analyzed on triplicate. Is is also important to check the variation among measurements obtained from the same individual and the values obtained from different individuals. Such variation should be bellow 3%. The result should be the avarege C-value following the standard deviation, what inform us the variation among individuals and measurements.
__A: __We have done three technical replicates of each tissue of the individuals of E. anisatum and E. marmoratum. To show the variation from different replicates and tissues, we have included the Supplementary Data Table S1. Intraspecific variation on genome size is beyond the scope of this work.
__R3. __Checking Fig. 1, we could not see the Pisum peack. If authors performed an analysis with external standart, it should be clarified on Methods. I suggest always use internal standard.
Besides, comparing Fig. 1 for leave and pollinium, it seems to be necessary to set up the Flow Cytoemtry equipament. Note that the 2C peack change its position when comparing different graphs. The data could be placed more central on x-axis by setting the flow cytometry.
Action Required: Considering that authors want to compare indirect genomic approaches to determine the GS, I suggest authors improve the GS determination by Flow Cytometry.
Please, on Methodology section, keep both techniques focused on GS close one another. Follow the same order on Methodology, Results and Discussion sections.
__A: __We have made several changes on the estimation and reporting of the flow cytometry genome size estimation. Among these:
We have clarified the use of the P. sativum internal standard and PBMC's in methods (P.6). We have added the associated mean coefficient of variation for both the sample and the internal reference in Supplementary Data Table S1, in order to show that the variation is not the result of an instrument error. We have changed the order of the paragraphs in the methods section to follow the order in other sections.
__R3. __Chromosome count: In Introduction section (page 5), the authors explicitly aim to provide "bioinformatics ploidy level estimation and chromosome counting." Furthermore, the Methods section (page 7, subsection "Ploidy level estimation and chromosome counts") details a specific protocol for chromosome counting involving root tip pretreatment, fixation, and staining. However, no results regarding chromosome counting are presented in the manuscript. There are no micrographs of metaphase plates, no tables with counts, and no mention of the actual counts in the Results section or Supplementary Material. Despite this absence of evidence, the Discussion (Page 18) states: "ploidy and chromosome counts of both E. anisatum and E. marmoratum are the same (2n=40)." The value of 2n=40 is presented as a finding of this study, however, there is no reference to this results.
Action Required: The authors must resolve this discrepancy by either providing the missing empirical data (micrographs and counts). This detail needs to be reviewed with greater care and scientific integrity.
__A: __We have added the chromosome count micrographs as Supplementary Data Fig. S7.
Minor reviews (Suggestions):
__R3. __Refining the Title (Optional): Although the current title is descriptive, we believe it undersells the value of the manuscript. Since this study provides the first genome profiling and repeatome characterization for the genus Epidendrum and offers important insights into the calibration of bioinformatics tools and flow cytometry for repetitive genomes, I suggest modifying the title to reflect these aspects. The comparative access of GS is also an importante feature. This would make the article more attractive to a broader audience interested in genomics of non-model organisms.
__A: __We have changed the title to "Nuclear genome profiling of two species of Epidendrum (Orchidaceae): genome size, repeatome and ploidy"
__R3. __Botanical Nomenclature (Optional): Although citing taxonomic authorities is not strictly required in all fields of plant sciences, most botanical journals expect the full author citation at the first mention of each species. Including this information would improve the nomenclatural rigor of the manuscript and align it with common practices in botanical publishing.
A: We have added the citation of the taxonomic authorities:
"This study aims to use two closely related endemic Mexican species, Epidendrum anisatum Lex and Epidendrum marmoratum A. Rich. & Galeotti, to provide the first genomic profiling for this genus..."
__R3. __Abbreviation of Genus Names: I noticed inconsistencies in the abbreviation of scientific names throughout the manuscript. Standard scientific style dictates that the full genus name (Epidendrum) should be written out only at its first mention in the Abstract and again at the first mention in the main text. Thereafter, it should be abbreviated (e.g., E. anisatum, E. marmoratum), unless the name appears at the beginning of a sentence or if abbreviation would cause ambiguity with another genus. Please revise the text to apply this abbreviation consistently.
A: We have made the changes requested as necessary.
__R3. __Genome Size Notation: In the Abstract and throughout the text, genome size estimates are presented using the statistical symbol for the mean (x). While mathematically accurate, this notation is generic and does not immediately inform the reader about the biological nature of the DNA content (i.e., whether it refers to the gametic 1C or somatic 2C value). In plant cytometry literature, it is standard practice to explicitly label these values using C-value terminology to prevent ambiguity and eliminate the effect of the number of chromosome sets (Bennett & Leitch 2005; Greilhuber et al. 2005; Doležel et al. 2018). I strongly suggest replacing references to "x" with "1C" (e.g., changing "x = 2.58 Gb" to "mean 1C value = 2.58 Gb") to ensure immediate clarity and alignment with established conventions in the field.
__A: __We have revised the text in every instance, for example, in the results section:
"The 1C value in gigabases (Gb; calculated from mass in pg) of E. anisatum ranged from 2.55 to 2.62 Gb (mean 1C value = 2.59 Gb) and that of E. marmoratum from 1.11 to 1.18 Gb (mean 1C value = 1.13 Gb; Supplementary Data Table S1)."
__R3. __Justification of the Sequencing Method: Although the sequencing strategy is clearly described, the manuscript would benefit from a bit more contextualization regarding the choice of low-pass genome skimming. In the Introduction, a short justification of why this approach is suitable for estimating genome size, heterozygosity, and repeat composition, particularly in plants with large, repeat-rich genomes, would help readers better understand the methodological rationale. Likewise, in the Methods section, briefly outlining why the selected sequencing depth is appropriate, and how it aligns with previous studies using similar coverage levels, would strengthen the clarity of the methodological framework. These additions would make the rationale behind the sequencing approach more transparent and accessible to readers who may be less familiar with low-coverage genomic strategies.
__A: __We have added the following short sentence in P.7:
"This sequencing method produces suitable data sets without systematic biases, allowing the estimation of genome size and the proportion of repetitive DNA. "
__R3. __Wording Improvement Regarding RepeatExplorer2 Results: In the Results section, several sentences attribute biological outcomes to the RepeatExplorer2 "protocols" (e.g., "According to this protocol, both species have highly repetitive genomes..."; "The comparative protocol showed a 67% total repeat proportion, which falls between the estimated repeat proportions of the two species according to the results of the individual protocol"). Since the RepeatExplorer2 protocol itself only provides the analytical workflow and not species-specific results, this phrasing may be misleading.
A: We have rephrased these sections to emphasize that these are "the results of" the protocols and not the protocols themselves.
Reviewer #3 (Significance (Required)):
Significance
General assessment
Strengths
1.First Detailed Genomic Profile for the Genus Epidendrum: The study provides the first integrated dataset on genome size, ploidy, heterozygosity, and repeatome for species of the genus Epidendrum, a novel contribution for an extremely diverse and under-explored group in terms of cytogenomics.
Cross-validation of in vitro and in silico analyses: Flow cytometry is considered the gold standard for genome size (GS) estimation because it physically measures DNA quantity (Doležel et al. 2007; Śliwińska 2018). However, it typically requires fresh tissue, which is not always available. Conversely, k-mer analysis is a rapid bioinformatics technique utilizing sequencing data that does not rely on a reference genome. Nevertheless, it is frequently viewed with skepticism or distrust due to discrepancies with laboratory GS estimates (Pflug et al. 2020; Hesse 2023). In this study, by comparing computational results with flow cytometry data, the authors were able to validate the reliability of computational estimates for the investigated species. Since the 'true' GS was already established via flow cytometry, the authors used this value as a benchmark to test various software tools (GenomeScope, findGSE, CovEst) and parameters. This approach allowed for the identification of which tools perform best for complex genomes. For instance, they found that tools failing to account for heterozygosity (such as findGSE-hom) drastically overestimated the genome size of E. anisatum, whereas GenomeScope and findGSE-het (which account for heterozygosity) yielded results closer to the flow cytometry values. Thus, they demonstrated that this cross-validation is an effective method for estimating plant genome sizes with greater precision. This integrative approach is essential not only for defining GS but also for demonstrating how bioinformatics methods must be calibrated (particularly regarding depth of coverage and maximum k-mer coverage) to provide accurate data for non-model organisms when flow cytometry is not feasible.
Limitations
- Limited Taxonomic Sampling: The study analyzes only two species of Epidendrum, which restricts the ability to make broad inferences regarding genome evolution across the genus. Given the outstanding diversity of Epidendrum (>1,800 species), the current sampling is insufficient to propose generalized evolutionary patterns. As the authors state by the end of the Discussion (page 18) "Future work should investigate to what extent LTR transposons and satellite DNA have been responsible for shaping genome size variation in different lineages of Epidendrum, analyzing a greater portion of its taxic diversity in an evolutionary context.". 2.Lack of Cytogenetic Results and Mapping: One of the major finding of this study is the identification of the AniS1 satellite as a potential key driver of the genome size difference between the species, occupying ~11% of the E. anisatum genome and virtually absent in E. marmoratum. While the authors use bioinformatic metrics (C and P indices) to infer a dispersed organization in the Discussion (Page 18), the study lacks physical validation via Fluorescence in situ Hybridization (FISH) - and a basic validation of the chromosome number. Without cytogenetic mapping, it is impossible to confirm the actual chromosomal distribution of this massive repetitive array, for instance, whether it has accumulated in specific heterochromatic blocks (e.g., centromeric or subtelomeric regions) or if it is genuinely interspersed along the chromosome arms. I suggest acknowledging this as a limitation in the Discussion, as the physical organization of such abundant repeats has significant implications for understanding the structural evolution of the species' chromosomes.
Advance
To the best of our knowledge, this study represents the first comprehensive genome profiling and repeatome characterization for any species of the genus Epidendrum. By integrating flow cytometry, k-mer-based approaches, and low-pass sequencing, the authors provide the first insights into the genomic architecture of Epidendrum, including quantitative assessments of transposable elements, lineage-specific satellite DNA, and repeat-driven genome expansion. This constitutes both a technical and a conceptual advance: technically, the study demonstrates the feasibility and limitations of combining in vitro and in silico methods for genome characterization in large, repeat-rich plant genomes; conceptually, it offers new evolutionary perspectives on how repetitive elements shape genome size divergence within a highly diverse orchid lineage. These results broaden the genomic knowledge base for Neotropical orchids and establish a foundational reference for future comparative, cytogenomic, and phylogenomic studies within Epidendrum and related groups.
Audience
This study will primarily interest a broad audience, including researchers in plant genomics, evolutionary biology, cytogenomics, and bioinformatics, especially those working with non-model plants or groups with large, repetitive genomes. It also holds relevance for scientists engaged in genome size evolution, repetitive DNA biology, and comparative genomics. Other researchers are likely to use this work as a methodological reference for genome profiling in non-model taxa, especially regarding the integration of flow cytometry and k-mer-based estimations and the challenges posed by highly repetitive genomes. The detailed repeatome characterization, including identification of lineage-specific satellites and retrotransposon dynamics, will support comparative genomic analyses, repeat evolution studies, and future cytogenetic validation (e.g., FISH experiments). Additionally, this dataset establishes a genomic baseline that can inform phylogenomic studies, species delimitation, and evolutionary inference within Epidendrum and related orchid groups.
Reviewer's Backgrounds
The review was prepared by two reviewers. Our expertise lies in evolution and biological diversity, with a focus on cytogenomic and genome size evolution. Among the projects in development, the cytogenomics evolution of Neotropical orchids is one of the main studies (also focused on Epidendrum). These areas shape my perspective in evaluating the evolutionary, cytogenomic, and biological implications of the study. However, we have limited expertise in methodologies related to k-mer-based genome profiling and heterozygosity modeling. Therefore, our evaluation does not deeply assess the technical validity of these analytical pipelines.
Romeo. [To JULIET] If I profane with my unworthiest hand This holy shrine, the gentle fine is this: 720My lips, two blushing pilgrims, ready stand To smooth that rough touch with a tender kiss. Juliet. Good pilgrim, you do wrong your hand too much, Which mannerly devotion shows in this; For saints have hands that pilgrims' hands do touch, 725And palm to palm is holy palmers' kiss. Romeo. Have not saints lips, and holy palmers too? Juliet. Ay, pilgrim, lips that they must use in prayer. Romeo. O, then, dear saint, let lips do what hands do; They pray, grant thou, lest faith turn to despair. 730 Juliet. Saints do not move, though grant for prayers' sake. Romeo. Then move not, while my prayer's effect I take. Thus from my lips, by yours, my sin is purged. Juliet. Then have my lips the sin that they have took. Romeo. Sin from thy lips? O trespass sweetly urged! 735Give me my sin again. Juliet. You kiss by the book. Nurse. Madam, your mother craves a word with you. Romeo. What is her mother? Nurse. Marry, bachelor, 740Her mother is the lady of the house, And a good lady, and a wise and virtuous I nursed her daughter, that you talk'd withal; I tell you, he that can lay hold of her Shall have the chinks. 745 Romeo. Is she a Capulet? O dear account! my life is my foe's debt. Benvolio. Away, begone; the sport is at the best. Romeo. Ay, so I fear; the more is my unrest. Capulet. Nay, gentlemen, prepare not to be gone; 750We have a trifling foolish banquet towards. Is it e'en so? why, then, I thank you all I thank you, honest gentlemen; good night. More torches here! Come on then, let's to bed. Ah, sirrah, by my fay, it waxes late: 755I'll to my rest.
romeo goes and flirts with juliet and they engage in a kiss showing that they both are intrested in each other but the feast is ending and the guest are preparing to leave both are conflicted by their feelings and family relations to each other
Capulet. Welcome, gentlemen! ladies that have their toes Unplagued with corns will have a bout with you. 635Ah ha, my mistresses! which of you all Will now deny to dance? she that makes dainty, She, I'll swear, hath corns; am I come near ye now? Welcome, gentlemen! I have seen the day That I have worn a visor and could tell 640A whispering tale in a fair lady's ear, Such as would please: 'tis gone, 'tis gone, 'tis gone: You are welcome, gentlemen! come, musicians, play. A hall, a hall! give room! and foot it, girls. [Music plays, and they dance] 645More light, you knaves; and turn the tables up, And quench the fire, the room is grown too hot. Ah, sirrah, this unlook'd-for sport comes well. Nay, sit, nay, sit, good cousin Capulet; For you and I are past our dancing days: 650How long is't now since last yourself and I Were in a mask? Second Capulet. By'r lady, thirty years. Capulet. What, man! 'tis not so much, 'tis not so much: 'Tis since the nuptials of Lucentio, 655Come pentecost as quickly as it will, Some five and twenty years; and then we mask'd. Second Capulet. 'Tis more, 'tis more, his son is elder, sir; His son is thirty. Capulet. Will you tell me that? 660His son was but a ward two years ago. Romeo. [To a Servingman] What lady is that, which doth enrich the hand Of yonder knight? Servant. I know not, sir. 665 Romeo. O, she doth teach the torches to burn bright! It seems she hangs upon the cheek of night Like a rich jewel in an Ethiope's ear; Beauty too rich for use, for earth too dear! So shows a snowy dove trooping with crows, 670As yonder lady o'er her fellows shows. The measure done, I'll watch her place of stand, And, touching hers, make blessed my rude hand. Did my heart love till now? forswear it, sight! For I ne'er saw true beauty till this night. 675 Tybalt. This, by his voice, should be a Montague. Fetch me my rapier, boy. What dares the slave Come hither, cover'd with an antic face, To fleer and scorn at our solemnity? Now, by the stock and honour of my kin, 680To strike him dead, I hold it not a sin. Capulet. Why, how now, kinsman! wherefore storm you so? Tybalt. Uncle, this is a Montague, our foe, A villain that is hither come in spite, To scorn at our solemnity this night. 685 Capulet. Young Romeo is it? Tybalt. 'Tis he, that villain Romeo. Capulet. Content thee, gentle coz, let him alone; He bears him like a portly gentleman; And, to say truth, Verona brags of him 690To be a virtuous and well-govern'd youth: I would not for the wealth of all the town Here in my house do him disparagement: Therefore be patient, take no note of him: It is my will, the which if thou respect, 695Show a fair presence and put off these frowns, And ill-beseeming semblance for a feast. Tybalt. It fits, when such a villain is a guest: I'll not endure him. Capulet. He shall be endured: 700What, goodman boy! I say, he shall: go to; Am I the master here, or you? go to. You'll not endure him! God shall mend my soul! You'll make a mutiny among my guests! You will set cock-a-hoop! you'll be the man! 705 Tybalt. Why, uncle, 'tis a shame. Capulet. Go to, go to; You are a saucy boy: is't so, indeed? This trick may chance to scathe you, I know what: You must contrary me! marry, 'tis time. 710Well said, my hearts! You are a princox; go: Be quiet, or—More light, more light! For shame! I'll make you quiet. What, cheerly, my hearts! Tybalt. Patience perforce with wilful choler meeting Makes my flesh tremble in their different greeting. 715I will withdraw: but this intrusion shall Now seeming sweet convert to bitter gall.
capulet is giving a speech and welcoming the guest romeo spots juliet for the first time and is star struck by her beauty while tybalt notices romeo and is getting ready to fight him but he was stopped by capulet tybalt withdraws but vows he will get him
First Servant. Where's Potpan, that he helps not to take away? He shift a trencher? he scrape a trencher! 620 Second Servant. When good manners shall lie all in one or two men's hands and they unwashed too, 'tis a foul thing. First Servant. Away with the joint-stools, remove the court-cupboard, look to the plate. Good thou, save me a piece of marchpane; and, as thou lovest me, let 625the porter let in Susan Grindstone and Nell. Antony, and Potpan! Second Servant. Ay, boy, ready. First Servant. You are looked for and called for, asked for and sought for, in the great chamber. 630 Second Servant. We cannot be here and there too. Cheerly, boys; be brisk awhile, and the longer liver take all.
the capulet servants are running around preparing for the feast while joking and teasing each other
Lady Capulet. Enough of this; I pray thee, hold thy peace. Nurse. Yes, madam: yet I cannot choose but laugh, 435To think it should leave crying and say 'Ay.' And yet, I warrant, it had upon its brow A bump as big as a young cockerel's stone; A parlous knock; and it cried bitterly: 'Yea,' quoth my husband,'fall'st upon thy face? 440Thou wilt fall backward when thou comest to age; Wilt thou not, Jule?' it stinted and said 'Ay.' Juliet. And stint thou too, I pray thee, nurse, say I. Nurse. Peace, I have done. God mark thee to his grace! Thou wast the prettiest babe that e'er I nursed: 445An I might live to see thee married once, I have my wish. Lady Capulet. Marry, that 'marry' is the very theme I came to talk of. Tell me, daughter Juliet, How stands your disposition to be married? 450 Juliet. It is an honour that I dream not of. Nurse. An honour! were not I thine only nurse, I would say thou hadst suck'd wisdom from thy teat. Lady Capulet. Well, think of marriage now; younger than you, Here in Verona, ladies of esteem, 455Are made already mothers: by my count, I was your mother much upon these years That you are now a maid. Thus then in brief: The valiant Paris seeks you for his love. Nurse. A man, young lady! lady, such a man 460As all the world—why, he's a man of wax. Lady Capulet. Verona's summer hath not such a flower. Nurse. Nay, he's a flower; in faith, a very flower. Lady Capulet. What say you? can you love the gentleman? This night you shall behold him at our feast; 465Read o'er the volume of young Paris' face, And find delight writ there with beauty's pen; Examine every married lineament, And see how one another lends content And what obscured in this fair volume lies 470Find written in the margent of his eyes. This precious book of love, this unbound lover, To beautify him, only lacks a cover: The fish lives in the sea, and 'tis much pride For fair without the fair within to hide: 475That book in many's eyes doth share the glory, That in gold clasps locks in the golden story; So shall you share all that he doth possess, By having him, making yourself no less. Nurse. No less! nay, bigger; women grow by men. 480 Lady Capulet. Speak briefly, can you like of Paris' love? Juliet. I'll look to like, if looking liking move: But no more deep will I endart mine eye Than your consent gives strength to make it fly.
lady capulet and the nurse tells juliet it is almost her time for marriage and how a younge noble named paris is looking forward to marrying her and that she should observe him in the upcoming feast
Nurse. Even or odd, of all days in the year, Come Lammas-eve at night shall she be fourteen. Susan and she—God rest all Christian souls!— Were of an age: well, Susan is with God; She was too good for me: but, as I said, 405On Lammas-eve at night shall she be fourteen; That shall she, marry; I remember it well. 'Tis since the earthquake now eleven years; And she was wean'd,—I never shall forget it,— Of all the days of the year, upon that day: 410For I had then laid wormwood to my dug, Sitting in the sun under the dove-house wall; My lord and you were then at Mantua:— Nay, I do bear a brain:—but, as I said, When it did taste the wormwood on the nipple 415Of my dug and felt it bitter, pretty fool, To see it tetchy and fall out with the dug! Shake quoth the dove-house: 'twas no need, I trow, To bid me trudge: And since that time it is eleven years; 420For then she could stand alone; nay, by the rood, She could have run and waddled all about; For even the day before, she broke her brow: And then my husband—God be with his soul! A' was a merry man—took up the child: 425'Yea,' quoth he, 'dost thou fall upon thy face? Thou wilt fall backward when thou hast more wit; Wilt thou not, Jule?' and, by my holidame, The pretty wretch left crying and said 'Ay.' To see, now, how a jest shall come about! 430I warrant, an I should live a thousand years, I never should forget it: 'Wilt thou not, Jule?' quoth he; And, pretty fool, it stinted and said 'Ay.'
the nurse is reminiscing about juliets childhood and how close they were
Benvolio. Tut, man, one fire burns out another's burning, One pain is lessen'd by another's anguish; 320Turn giddy, and be holp by backward turning; One desperate grief cures with another's languish: Take thou some new infection to thy eye, And the rank poison of the old will die. Romeo. Your plaintain-leaf is excellent for that. 325 Benvolio. For what, I pray thee? Romeo. For your broken shin. Benvolio. Why, Romeo, art thou mad? Romeo. Not mad, but bound more than a mad-man is; Shut up in prison, kept without my food, 330Whipp'd and tormented and—God-den, good fellow. Servant. God gi' god-den. I pray, sir, can you read? Romeo. Ay, mine own fortune in my misery. Servant. Perhaps you have learned it without book: but, I pray, can you read any thing you see? 335 Romeo. Ay, if I know the letters and the language. Servant. Ye say honestly: rest you merry! Romeo. Stay, fellow; I can read. [Reads] 'Signior Martino and his wife and daughters; 340County Anselme and his beauteous sisters; the lady widow of Vitravio; Signior Placentio and his lovely nieces; Mercutio and his brother Valentine; mine uncle Capulet, his wife and daughters; my fair niece Rosaline; Livia; Signior Valentio and his cousin 345Tybalt, Lucio and the lively Helena.' A fair assembly: whither should they come? Servant. Up. Romeo. Whither? Servant. To supper; to our house. 350 Romeo. Whose house? Servant. My master's. Romeo. Indeed, I should have ask'd you that before. Servant. Now I'll tell you without asking: my master is the great rich Capulet; and if you be not of the house 355of Montagues, I pray, come and crush a cup of wine. Rest you merry!
benvolio advises romeo to stop the unrequited love for that woman romeo refuses saying hes still obsessed a servant wiith the list of people attending enters struggling to read the list romeo offers to help
Benvolio. Good-morrow, cousin. Romeo. Is the day so young? Benvolio. But new struck nine. Romeo. Ay me! sad hours seem long. 185Was that my father that went hence so fast? Benvolio. It was. What sadness lengthens Romeo's hours? Romeo. Not having that, which, having, makes them short. Benvolio. In love? Romeo. Out— 190 Benvolio. Of love? Romeo. Out of her favour, where I am in love. Benvolio. Alas, that love, so gentle in his view, Should be so tyrannous and rough in proof! Romeo. Alas, that love, whose view is muffled still, 195Should, without eyes, see pathways to his will! Where shall we dine? O me! What fray was here? Yet tell me not, for I have heard it all. Here's much to do with hate, but more with love. Why, then, O brawling love! O loving hate! 200O any thing, of nothing first create! O heavy lightness! serious vanity! Mis-shapen chaos of well-seeming forms! Feather of lead, bright smoke, cold fire, sick health! 205Still-waking sleep, that is not what it is! This love feel I, that feel no love in this. Dost thou not laugh? Benvolio. No, coz, I rather weep. Romeo. Good heart, at what? 210 Benvolio. At thy good heart's oppression. Romeo. Why, such is love's transgression. Griefs of mine own lie heavy in my breast, Which thou wilt propagate, to have it prest With more of thine: this love that thou hast shown 215Doth add more grief to too much of mine own. Love is a smoke raised with the fume of sighs; Being purged, a fire sparkling in lovers' eyes; Being vex'd a sea nourish'd with lovers' tears: What is it else? a madness most discreet, 220A choking gall and a preserving sweet. Farewell, my coz. Benvolio. Soft! I will go along; An if you leave me so, you do me wrong. Romeo. Tut, I have lost myself; I am not here; 225This is not Romeo, he's some other where. Benvolio. Tell me in sadness, who is that you love. Romeo. What, shall I groan and tell thee? Benvolio. Groan! why, no. But sadly tell me who. 230 Romeo. Bid a sick man in sadness make his will: Ah, word ill urged to one that is so ill! In sadness, cousin, I do love a woman. Benvolio. I aim'd so near, when I supposed you loved. Romeo. A right good mark-man! And she's fair I love. 235 Benvolio. A right fair mark, fair coz, is soonest hit. Romeo. Well, in that hit you miss: she'll not be hit With Cupid's arrow; she hath Dian's wit; And, in strong proof of chastity well arm'd, From love's weak childish bow she lives unharm'd. 240She will not stay the siege of loving terms, Nor bide the encounter of assailing eyes, Nor ope her lap to saint-seducing gold: O, she is rich in beauty, only poor, That when she dies with beauty dies her store. 245 Benvolio. Then she hath sworn that she will still live chaste? Romeo. She hath, and in that sparing makes huge waste, For beauty starved with her severity Cuts beauty off from all posterity. She is too fair, too wise, wisely too fair, 250To merit bliss by making me despair: She hath forsworn to love, and in that vow Do I live dead that live to tell it now. Benvolio. Be ruled by me, forget to think of her. Romeo. O, teach me how I should forget to think. 255 Benvolio. By giving liberty unto thine eyes; Examine other beauties. Romeo. 'Tis the way To call hers exquisite, in question more: These happy masks that kiss fair ladies' brows 260Being black put us in mind they hide the fair; He that is strucken blind cannot forget The precious treasure of his eyesight lost: Show me a mistress that is passing fair, What doth her beauty serve, but as a note 265Where I may read who pass'd that passing fair? Farewell: thou canst not teach me to forget. Benvolio. I'll pay that doctrine, or else die in debt.
benvolio ask romeo why he is so sad all the time for romeo to reveal that bc he is in love with a woman that doesnt love him back and benvolio try to cheer romeo up by saying there are other fishes in the sea and romeo said that the other fishes only remind him of the woman
The quarrel is between our masters and us their men. Sampson. 'Tis all one, I will show myself a tyrant: when I 35have fought with the men, I will be cruel with the maids, and cut off their heads. Gregory. The heads of the maids? Sampson. Ay, the heads of the maids, or their maidenheads; take it in what sense thou wilt. 40 Gregory. They must take it in sense that feel it. Sampson. Me they shall feel while I am able to stand: and 'tis known I am a pretty piece of flesh. Gregory. 'Tis well thou art not fish; if thou hadst, thou hadst been poor John. Draw thy tool! here comes 45two of the house of the Montagues. Sampson. My naked weapon is out: quarrel, I will back thee. Gregory. How! turn thy back and run? Sampson. Fear me not. Gregory. No, marry; I fear thee! 50 Sampson. Let us take the law of our sides; let them begin. Gregory. I will frown as I pass by, and let them take it as they list. Sampson. Nay, as they dare. I will bite my thumb at them; which is a disgrace to them, if they bear it.
they are insulting the montague and talkiing about how they will kill the maids and how they are ready to fight
Sampson. Gregory, o' my word, we'll not carry coals. Gregory. No, for then we should be colliers. Sampson. I mean, an we be in choler, we'll draw. Gregory. Ay, while you live, draw your neck out o' the collar. 20 Sampson. I strike quickly, being moved. Gregory. But thou art not quickly moved to strike. Sampson. A dog of the house of Montague moves me. Gregory. To move is to stir; and to be valiant is to stand: therefore, if thou art moved, thou runn'st away. 25 Sampson. A dog of that house shall move me to stand: I will take the wall of any man or maid of Montague's. Gregory. That shows thee a weak slave; for the weakest goes to the wall. Sampson. True; and therefore women, being the weaker vessels, 30are ever thrust to the wall: therefore I will push Montague's men from the wall, and thrust his maids to the wall. Gregory. The quarrel is between our masters and us their men.
the two servants samson and Gregory they are talking and joking about fighting the moontague and how they will violate the women
Exeunt MONTAGUE and LADY MONTAGUE] Benvolio. Good-morrow, cousin. Romeo. Is the day so young? Benvolio. But new struck nine. Romeo. Ay me! sad hours seem long. 185Was that my father that went hence so fast? Benvolio. It was. What sadness lengthens Romeo's hours? Romeo. Not having that, which, having, makes them short. Benvolio. In love? Romeo. Out— 190 Benvolio. Of love? Romeo. Out of her favour, where I am in love. Benvolio. Alas, that love, so gentle in his view, Should be so tyrannous and rough in proof! Romeo. Alas, that love, whose view is muffled still, 195Should, without eyes, see pathways to his will! Where shall we dine? O me! What fray was here? Yet tell me not, for I have heard it all. Here's much to do with hate, but more with love. Why, then, O brawling love! O loving hate! 200O any thing, of nothing first create! O heavy lightness! serious vanity! Mis-shapen chaos of well-seeming forms! Feather of lead, bright smoke, cold fire, sick health! 205Still-waking sleep, that is not what it is! This love feel I, that feel no love in this. Dost thou not laugh? Benvolio. No, coz, I rather weep.
Romeo finally walks in but Benvolio notices Romeo’s gloom and tries to find out what’s wrong.
[Enter ROMEO] Benvolio. See, where he comes: so please you, step aside; I'll know his grievance, or be much denied. Montague. I would thou wert so happy by thy stay, To hear true shrift. Come, madam, let's away. 180 [Exeunt MONTAGUE and LADY MONTAGUE] Benvolio. Good-morrow, cousin. Romeo. Is the day so young? Benvolio. But new struck nine. Romeo. Ay me! sad hours seem long. 185Was that my father that went hence so fast? Benvolio. It was. What sadness lengthens Romeo's hours? Romeo. Not having that, which, having, makes them short. Benvolio. In love? Romeo. Out— 190 Benvolio. Of love? Romeo. Out of her favour, where I am in love. Benvolio. Alas, that love, so gentle in his view, Should be so tyrannous and rough in proof! Romeo. Alas, that love, whose view is muffled still, 195Should, without eyes, see pathways to his will! Where shall we dine? O me! What fray was here? Yet tell me not, for I have heard it all. Here's much to do with hate, but more with love. Why, then, O brawling love! O loving hate! 200O any thing, of nothing first create! O heavy lightness! serious vanity! Mis-shapen chaos of well-seeming forms! Feather of lead, bright smoke, cold fire, sick health! 205Still-waking sleep, that is not what it is! This love feel I, that feel no love in this. Dost thou not laugh? Benvolio. No, coz, I rather weep. Romeo. Good heart, at what? 210 Benvolio. At thy good heart's oppression. Romeo. Why, such is love's transgression. Griefs of mine own lie heavy in my breast, Which thou wilt propagate, to have it prest With more of thine: this love that thou hast shown 215Doth add more grief to too much of mine own. Love is a smoke raised with the fume of sighs; Being purged, a fire sparkling in lovers' eyes; Being vex'd a sea nourish'd with lovers' tears: What is it else? a madness most discreet, 220A choking gall and a preserving sweet. Farewell, my coz. Benvolio. Soft! I will go along; An if you leave me so, you do me wrong. Romeo. Tut, I have lost myself; I am not here; 225This is not Romeo, he's some other where. Benvolio. Tell me in sadness, who is that you love. Romeo. What, shall I groan and tell thee? Benvolio. Groan! why, no. But sadly tell me who. 230 Romeo. Bid a sick man in sadness make his will: Ah, word ill urged to one that is so ill! In sadness, cousin, I do love a woman. Benvolio. I aim'd so near, when I supposed you loved. Romeo. A right good mark-man! And she's fair I love. 235 Benvolio. A right fair mark, fair coz, is soonest hit. Romeo. Well, in that hit you miss: she'll not be hit With Cupid's arrow; she hath Dian's wit; And, in strong proof of chastity well arm'd, From love's weak childish bow she lives unharm'd. 240She will not stay the siege of loving terms, Nor bide the encounter of assailing eyes, Nor ope her lap to saint-seducing gold: O, she is rich in beauty, only poor, That when she dies with beauty dies her store. 245 Benvolio. Then she hath sworn that she will still live chaste? Romeo. She hath, and in that sparing makes huge waste, For beauty starved with her severity Cuts beauty off from all posterity. She is too fair, too wise, wisely too fair, 250To merit bliss by making me despair: She hath forsworn to love, and in that vow Do I live dead that live to tell it now. Benvolio. Be ruled by me, forget to think of her. Romeo. O, teach me how I should forget to think. 255 Benvolio. By giving liberty unto thine eyes; Examine other beauties. Romeo. 'Tis the way To call hers exquisite, in question more: These happy masks that kiss fair ladies' brows 260Being black put us in mind they hide the fair; He that is strucken blind cannot forget The precious treasure of his eyesight lost: Show me a mistress that is passing fair, What doth her beauty serve, but as a note 265Where I may read who pass'd that passing fair? Farewell: thou canst not teach me to forget. Benvolio. I'll pay that doctrine, or else die in debt. [Exeunt]
Before going any further, My hypothesis is that Romeo's reason for feeling down has something to do with love.
Sampson. Gregory, o' my word, we'll not carry coals. Gregory. No, for then we should be colliers. Sampson. I mean, an we be in choler, we'll draw. Gregory. Ay, while you live, draw your neck out o' the collar. 20 Sampson. I strike quickly, being moved. Gregory. But thou art not quickly moved to strike. Sampson. A dog of the house of Montague moves me. Gregory. To move is to stir; and to be valiant is to stand: therefore, if thou art moved, thou runn'st away. 25 Sampson. A dog of that house shall move me to stand: I will take the wall of any man or maid of Montague's. Gregory. That shows thee a weak slave; for the weakest goes to the wall. Sampson. True; and therefore women, being the weaker vessels, 30are ever thrust to the wall: therefore I will push Montague's men from the wall, and thrust his maids to the wall. Gregory. The quarrel is between our masters and us their men. Sampson. 'Tis all one, I will show myself a tyrant: when I 35have fought with the men, I will be cruel with the maids, and cut off their heads. Gregory. The heads of the maids? Sampson. Ay, the heads of the maids, or their maidenheads; take it in what sense thou wilt. 40 Gregory. They must take it in sense that feel it. Sampson. Me they shall feel while I am able to stand: and 'tis known I am a pretty piece of flesh. Gregory. 'Tis well thou art not fish; if thou hadst, thou hadst been poor John. Draw thy tool! here comes 45two of the house of the Montagues. Sampson. My naked weapon is out: quarrel, I will back thee. Gregory. How! turn thy back and run? Sampson. Fear me not. Gregory. No, marry; I fear thee! 50 Sampson. Let us take the law of our sides; let them begin. Gregory. I will frown as I pass by, and let them take it as they list. Sampson. Nay, as they dare. I will bite my thumb at them; which is a disgrace to them, if they bear it.
Proving he's the "stronger" or "better" servant does nothing for Sampson as the people he's trying to compete against fall in the same category as him already. Us human's tend to seek completion with the urge to prove ourselves when there is no need to.
Sampson. Gregory, o' my word, we'll not carry coals. Gregory. No, for then we should be colliers. Sampson. I mean, an we be in choler, we'll draw. Gregory. Ay, while you live, draw your neck out o' the collar. 20 Sampson. I strike quickly, being moved. Gregory. But thou art not quickly moved to strike. Sampson. A dog of the house of Montague moves me. Gregory. To move is to stir; and to be valiant is to stand: therefore, if thou art moved, thou runn'st away. 25 Sampson. A dog of that house shall move me to stand: I will take the wall of any man or maid of Montague's. Gregory. That shows thee a weak slave; for the weakest goes to the wall. Sampson. True; and therefore women, being the weaker vessels, 30are ever thrust to the wall: therefore I will push Montague's men from the wall, and thrust his maids to the wall. Gregory. The quarrel is between our masters and us their men. Sampson. 'Tis all one, I will show myself a tyrant: when I 35have fought with the men, I will be cruel with the maids, and cut off their heads. Gregory. The heads of the maids? Sampson. Ay, the heads of the maids, or their maidenheads; take it in what sense thou wilt. 40 Gregory. They must take it in sense that feel it. Sampson. Me they shall feel while I am able to stand: and 'tis known I am a pretty piece of flesh. Gregory. 'Tis well thou art not fish; if thou hadst, thou hadst been poor John. Draw thy tool! here comes 45two of the house of the Montagues. Sampson. My naked weapon is out: quarrel, I will back thee. Gregory. How! turn thy back and run? Sampson. Fear me not. Gregory. No, marry; I fear thee! 50 Sampson. Let us take the law of our sides; let them begin. Gregory. I will frown as I pass by, and let them take it as they list. Sampson. Nay, as they dare. I will bite my thumb at them; which is a disgrace to them, if they bear it.
Sampson is purposely being aggressive with the other servants with the intention to get under their skin forcing them to make a wrong move to where his reaction wont make him be in the wrong.
# shade the term spread polygon(c(time(TB3MS), rev(time(TB3MS))), c(TB10YS, rev(TB3MS)), col = alpha("steelblue", alpha = 0.3), border = NA)
This code works well: tt <- if (!is.null(attr(Spread, "index"))) index(Spread) else time(Spread) y10 <- as.numeric(TB10YS) y3 <- as.numeric(TB3MS)
polygon( x = c(tt, rev(tt)), y = c(y10, rev(y3)), col = alpha("steelblue", 0.3), border = NA )
Definición de Políticas de Uso (Límites Operativos) Gestión de reglas de límite de consumo ("Thresholds") por SIM (Volumen de Datos MB/GB y Cantidad de SMS). Configuración de la acción a tomar al alcanzar el límite: TRAFFIC_CUT (Suspender), NOTIFY_ONLY (Alertar), o NO_ACTION. Persistencia del estado de la política por ciclo ("Límite alcanzado: Sí/No").
Relevar como esta al día de hoy la api, respecto a los limites por plan
This is such an awesome effort. Some thoughts while reading:
I have been wary of claims-based review given how hard it is to decouple claims from those made to chase editorial outcomes. I’d be very interested if we might prospectively use this type of result extraction to re-derive a supported claim (regardless of whether that was the claim made) and have that those be the content we operate on. I could even imagine authors using this type of supported content earlier in their workflow to make their narratives more robust rather than only post-hoc in evaluation.
That said, a useful distinction made here is to separate claims based on data/citations from claims that are inference or speculation. The latter of course are important for proposing parsimonious models that one can use as a theoretical framework for subsequent hypothesis generation or orthogonal testing. One awesome application of this in a future machine-readable world would be a forward-looking comparison of inference and speculation type claims with results from the rest of the corpus not just within-paper support.
Not at all a surprise is the increased coverage by LLMs compared to a few human reviewers who indeed likely only have expertise that covers a fraction of any interdisciplinary or collaborative work (the expertise of many authors went into a paper - the expertise of a reviewer is unlikely to span those).
Another thing that strikes me as invaluable here is the implicit and uncited result pairs that really will be essentially to generate knowledge graphs that can more usefully be built upon by new science/other scientists and far less biased than citation graphs.
Finally, as someone who spent many years invested in making the flip to the new eLife model (eliminating accept/reject editorial decisions), I was particularly interested in figure 2a comparing the old and new models. Even if unsupported claims had been dramatically higher or even high in an absolute sense, it would highlight the benefit of public reviews for such content rather than the same content being rejected and published as-is with a stamp of editorial acceptance elsewhere. However it's striking that even with many more claims evaluated by OpenEval, the unsupported claims are low whether authors decide when to stop revising their papers or when acceptance is gated by editors.
Reviewer #3 (Public review):
Summary:
Sarkar, Bhandari, Jaiswal and colleagues establish a suite of quantitative and genetic tools to use Drosophila melanogaster as a model metazoan organism to study polyphosphate (polyP) biology. By adapting biochemical approaches for use in D. melanogaster, they identify a window of increased polyP levels during development. Using genetic tools, they find that depleting polyP from the cytoplasm alters the timing of metamorphosis, accelerationg eclosion. By adapting subcellular imaging approaches for D. melanogaster, they observe polyP in the nucleolus of several cell types. They further demonstrate that polyP localizes to cytoplasmic puncta in hemocytes, and further that depleting polyP from the cytoplasm of hemocytes impairs hemolymph clotting. Together, these findings establish D. melanogaster as a tractable system for advancing our understanding of polyP in metazoans.
Strengths:
• The FLYX system, combining cell type and compartment-specific expression of ScPpx1, provides a powerful tool for the polyP community.
• The finding that cytoplasmic polyP levels change during development and affect the timing of metamorphosis is an exciting first step in understanding the role of polyP in metazoan development, and possible polyP-related diseases.
• Given the significant existing body of work implicating polyP in the human blood clotting cascade, this study provides compelling evidence that polyP has an ancient role in clotting in metazoans.
Limitations:
• While the authors demonstrate that HA-ScPpx1 protein localizes to the target organelles in the various FLYX constructs, the capacity of these constructs to deplete polyP from the different cellular compartments is not shown. This is an important control to both demonstrate that the GTS-PPBD labeling protocol works, and also to establish the efficacy of compartment-specific depletion. While not necessary to do for all the constructs, it would be helpful to do this for the cyto-FLYX and nuc-FLYX.
• The cell biological data in this study clearly indicates that polyP is enriched in the nucleolus in multiple cell types, consistent with recent findings from other labs, and also that polyP affects gene expression during development. Given that the authors also generate the Nuc-FLYX construct to deplete polyP from the nucleus, it is surprising that they test how depleting cytoplasmic but not nuclear polyP affects development. However, providing these tools is a service to the community, and testing the phenotypic consequences of all the FLYX constructs may arguably be beyond the scope of this first study.
Editors' note: The authors have satisfactorily responded to our most major concerns related to the specificity of PPDB and the physiological levels of polyPs in the clotting experiments. We also recognise the limitations related to the depletion of polyP in other tissues and hope that these data will be made available soon.
Author response:
The following is the authors’ response to the original reviews.
Public Reviews:
Reviewer #1 (Public review):
Polymers of orthophosphate of varying lengths are abundant in prokaryotes and some eukaryotes, where they regulate many cellular functions. Though they exist in metazoans, few tools exist to study their function. This study documents the development of tools to extract, measure, and deplete inorganic polyphosphates in *Drosophila*. Using these tools, the authors show:
(1) That polyP levels are negligible in embryos and larvae of all stages while they are feeding. They remain high in pupae but their levels drop in adults.
(2) That many cells in tissues such as the salivary glands, oocytes, haemocytes, imaginal discs, optic lobe, muscle, and crop, have polyP that is either cytoplasmic or nuclear (within the nucleolus).
(3) That polyP is necessary in plasmatocytes for blood clotting in Drosophila.
(4) That ployP controls the timing of eclosion.
The tools developed in the study are innovative, well-designed, tested, and well-documented. I enjoyed reading about them and I appreciate that the authors have gone looking for the functional role of polyP in flies, which hasn't been demonstrated before. The documentation of polyP in cells is convincing as its role in plasmatocytes in clotting.
We sincerely thank the reviewer for their encouraging assessment and for recognizing both the innovation of the FLYX toolkit and the functional insights it enables. Their remarks underscore the importance of establishing Drosophila as a tractable model for polyP biology, and we are grateful for their constructive feedback, which further strengthened the manuscript.
Its control of eclosion timing, however, could result from non-specific effects of expressing an exogenous protein in all cells of an animal.
We now explicitly state this limitation in the revised manuscript (p.16, l.347–349). The issue is that no catalytic-dead ScPpX1 is available as a control in the field. We plan to generate such mutants through systematic structural and functional studies and will update the FLYX toolkit once they are developed and validated. Importantly, the accelerated eclosion phenotype is reproducible and correlates with endogenous polyP dynamics.
The RNAseq experiments and their associated analyses on polyP-depleted animals and controls have not been discussed in sufficient detail. In its current form, the data look to be extremely variable between replicates and I'm therefore unsure of how the differentially regulated genes were identified.
We thank the reviewer for pointing out the lack of clarity. We have expanded our RNAseq analysis in the revised manuscript (p.20, l.430–434). Because of inter-sample variation (PC2 = 19.10%, Fig. S7B), we employed Gene Set Enrichment Analysis (GSEA) rather than strict DEG cutoffs. This method is widely used when the goal is to capture pathway-level changes under variability (1). We now also highlight this limitation explicitly (p.20, l.430–432) and provide an additional table with gene-specific fold change (See Supplementary Table for RNA Sequencing Sheet 1). Please note that we have moved RNAseq data to Supplementary Fig. 7 and 8 as suggested in the review.
It is interesting that no kinases and phosphatases have been identified in flies. Is it possible that flies are utilising the polyP from their gut microbiota? It would be interesting to see if these signatures go away in axenic animals.
This is an interesting possibility. Several observations argue that polyP is synthesized by fly tissues: (i) polyP levels remain very low during feeding stages but build up in wandering third instar larvae after feeding ceases; (ii) PPBD staining is absent from the gut except the crop (Fig. S3O–P); (ii) In C. elegans, intestinal polyP was unaffected when worms were fed polyP-deficient bacteria (2); (iv) depletion of polyP from plasmatocytes alone impairs hemolymph clotting, which would not be expected if gut-derived polyP were the major source and may have contributed to polyP in hemolymph. Nevertheless, we agree that microbiota-derived polyP may contribute, and we plan systematic testing in axenic flies in future work.
Reviewer #2 (Public review):
Summary:
The authors of this paper note that although polyphosphate (polyP) is found throughout biology, the biological roles of polyP have been under-explored, especially in multicellular organisms. The authors created transgenic Drosophila that expressed a yeast enzyme that degrades polyP, targeting the enzyme to different subcellular compartments (cytosol, mitochondria, ER, and nucleus, terming these altered flies Cyto-FLYX, Mito-FLYX, etc.). The authors show the localization of polyP in various wild-type fruit fly cell types and demonstrate that the targeting vectors did indeed result in the expression of the polyP degrading enzyme in the cells of the flies. They then go on to examine the effects of polyP depletion using just one of these targeting systems (the Cyto-FLYX). The primary findings from the depletion of cytosolic polyP levels in these flies are that it accelerates eclosion and also appears to participate in hemolymph clotting. Perhaps surprisingly, the flies seemed otherwise healthy and appeared to have little other noticeable defects. The authors use transcriptomics to try to identify pathways altered by the cyto-FLYX construct degrading cytosolic polyP, and it seems likely that their findings in this regard will provide avenues for future investigation. And finally, although the authors found that eclosion is accelerated in the pupae of Drosophila expressing the Cyto-FLYX construct, the reason why this happens remains unexplained.
Strengths:
The authors capitalize on the work of other investigators who had previously shown that expression of recombinant yeast exopolyphosphatase could be targeted to specific subcellular compartments to locally deplete polyP, and they also use a recombinant polyP-binding protein (PPBD) developed by others to localize polyP. They combine this with the considerable power of Drosophila genetics to explore the roles of polyP by depleting it in specific compartments and cell types to tease out novel biological roles for polyP in a whole organism. This is a substantial advance.
We are grateful to the reviewer for their thorough and thoughtful evaluation. Their balanced summary of our work, recognition of the strengths of our genetic tools, and constructive suggestions have been invaluable in clarifying our experiments and strengthening the conclusions.
Weaknesses:
Page 4 of the Results (paragraph 1): I'm a bit concerned about the specificity of PPBD as a probe for polyP. The authors show that the fusion partner (GST) isn't responsible for the signal, but I don't think they directly demonstrate that PPBD is binding only to polyP. Could it also bind to other anionic substances? A useful control might be to digest the permeabilized cells and tissues with polyphosphatase prior to PPBD staining and show that the staining is lost.
To address this concern, we have done two sets of experiments:
(1) We generated a PPBD mutant (GST-PPBD<sup>Mut</sup>). We establish that GST-PPBD binds to polyP-2X FITC, whereas GST-PPBD<sup>Mut</sup> and GST do not bind polyP<sub>100</sub>-2X FITC using Microscale Thermophoresis. We found that, unlike the punctate staining pattern of GST-PPBD (wild-type), GST-PPBD<sup>Mut</sup> does not stain hemocytes. This data has been added to the revised manuscript (Fig. 2B-D, p.8, l.151–165).
(2) A study in C.elegans by Quarles et.al has performed a similar experiment, suggested by the reviewer. In that study, treating permeabilized tissues with polyphosphatase prior to PPBD staining resulted in a decrease of PPBD-GFP signal from the tissues (2). We also performed the same experiment where we subjected hemocytes to GST-PPBD staining with prior incubation of fixed and permeabilised hemocytes with ScPpX1 and heat-inactivated ScPpX1 protein. We find that both staining intensity and the number of punctae are higher in hemocytes left untreated and in those treated with heat-inactivated ScPpX1. The hemocytes pre-treated with ScPpX1 showed reduced staining intensity and number of punctae. This data has been added to the revised manuscript (Fig. 2E-G, p.8, l.166-172).
Further, Saito et al. reported that PPBD binds to polyP in vitro, as well as in yeast and mammalian cells, with a high affinity of ~45µM for longer polyP chains (35 mer and above) (3). They also show that the affinity of PPBD with RNA and DNA is very low. Furthermore, PPBD could detect differences in polyP labeling in yeasts grown under different physiological conditions that alter polyP levels (3). Taken together, published work and our results suggest that PPBD specifically labels polyP.
In the hemolymph clotting experiments, the authors collected 2 ul of hemolymph and then added 1 ul of their test substance (water or a polyP solution). They state that they added either 0.8 or 1.6 nmol polyP in these experiments (the description in the Results differs from that of the Methods). I calculate this will give a polyP concentration of 0.3 or 0.6 mM. This is an extraordinarily high polyP concentration and is much in excess of the polyP concentrations used in most of the experiments testing the effects of polyP on clotting of mammalian plasma. Why did the authors choose this high polyP concentration? Did they try lower concentrations? It seems possible that too high a polyP concentration would actually have less clotting activity than the optimal polyP concentration.
We repeated the assays using 125 µM polyP, consistent with concentrations employed in mammalian plasma studies (4,5). Even at this lower, physiologically relevant concentration, polyP significantly enhanced clot fibre formation (Included as Fig. S5F–I, p.12, l.241–243). This reconfirms the conclusion that polyP promotes hemolymph clotting.
Author response image 1.
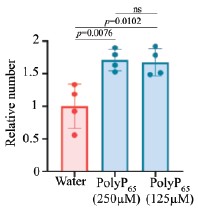
Reviewer #3 (Public review):
Summary:
Sarkar, Bhandari, Jaiswal, and colleagues establish a suite of quantitative and genetic tools to use Drosophila melanogaster as a model metazoan organism to study polyphosphate (polyP) biology. By adapting biochemical approaches for use in D. melanogaster, they identify a window of increased polyP levels during development. Using genetic tools, they find that depleting polyP from the cytoplasm alters the timing of metamorphosis, accelerating eclosion. By adapting subcellular imaging approaches for D. melanogaster, they observe polyP in the nucleolus of several cell types. They further demonstrate that polyP localizes to cytoplasmic puncta in hemocytes, and further that depleting polyP from the cytoplasm of hemocytes impairs hemolymph clotting. Together, these findings establish D. melanogaster as a tractable system for advancing our understanding of polyP in metazoans.
Strengths:
(1) The FLYX system, combining cell type and compartment-specific expression of ScPpx1, provides a powerful tool for the polyP community.
(2) The finding that cytoplasmic polyP levels change during development and affect the timing of metamorphosis is an exciting first step in understanding the role of polyP in metazoan development, and possible polyP-related diseases.
(3) Given the significant existing body of work implicating polyP in the human blood clotting cascade, this study provides compelling evidence that polyP has an ancient role in clotting in metazoans.
We sincerely thank the reviewer for their generous and insightful comments. Their recognition of both the technical strengths of the FLYX system and the broader biological implications reinforces our confidence that this work will serve as a useful foundation for the community.
Limitations:
(1) While the authors demonstrate that HA-ScPpx1 protein localizes to the target organelles in the various FLYX constructs, the capacity of these constructs to deplete polyP from the different cellular compartments is not shown. This is an important control to both demonstrate that the GTS-PPBD labeling protocol works, and also to establish the efficacy of compartment-specific depletion. While not necessary to do this for all the constructs, it would be helpful to do this for the cyto-FLYX and nuc-FLYX.
We confirmed polyP depletion in Cyto-FLYX using the malachite green assay (Fig. 3D, p.10, l.212–214). The efficacy of ScPpX1 has also been earlier demonstrated in mammalian mitochondria (6). Our preliminary data from Mito-ScPpX1 expressed ubiquitously with Tubulin-Gal4 showed a reduction in polyP levels when estimated from whole flies (See Author response image 2 below, ongoing investigation). In an independent study focusing on mitochondrial polyP depletion, we are characterizing these lines in detail and plan to check the amount of polyP contributed to the cellular pool by mitochondria using subcellular fractionation. Direct phenotypic and polyP depletion analyses of Nuc-FLYX and ER-FLYX are also being carried out, but are in preliminary stages. That there is a difference in levels of polyP in various tissues and that we get a very little subscellular fraction for polyP analysis have been a few challenging issues. This analysis requires detailed, independent, and careful analysis, and thus, we refrain from adding this data to the current manuscript.
Author response image 2.
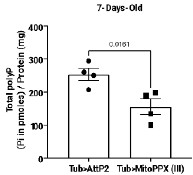
Regarding the specificity, Saito et.al. reported that PPBD binds to polyP in vitro, as well as in yeast and mammalian cells with a high affinity of ~45µM for longer polyP chains (35 mer and above) (3). They also show that the affinity of PPBD with RNA and DNA is very low. Further, PPBD could reveal differences in polyP labeling with yeasts grown in different physiological conditions that can alter polyP levels. Now in the manuscript, we included following data to show specificity of PPBD:
To address this concern we have done two sets of experiments:
We generated a PPBD mutant (GST-PPBD<sup>Mut</sup>). Using Microscale Thermophoresis, we establish that GST-PPBD binds to polyP<sub>100</sub>-2X-FITC, whereas, GST-PPBD<sup>Mut</sup> and GST do not bind polyP<sub>100</sub>-2X-FITC at all. We found that unlike the punctate staining pattern of GST-PPBD (wild-type), GST-PPBD<sup>Mut</sup> does not stain hemocytes. This data has been added to the revised manuscript (Fig. 2B-D, p.8, l.151–165).
A study in C.elegans by Quarles et.al has performed a similar experiment suggested by the reviewer. In that study, treating permeabilized tissues with polyphosphatase prior to PPBD staining resulted in decrease of PPBD-GFP signal from the tissues (2). We also performed the same experiment where we subjected hemocytes to GST-PPBD staining with prior incubation of fixed and permeabilised hemocytes with ScPpX1 and heat inactivated ScPpX1 protein. We find that both intensity of staining and number of punctae are higher in hemocytes that were left untreated and the one where heat inactivated ScPpX1 was added. The hemocytes pre-treated with ScPpX1 showed reduced staining intensity and number of punctae. This data has been added to the revised manuscript (Fig. 2E-G, p.8, l.166-172).
(2) The cell biological data in this study clearly indicates that polyP is enriched in the nucleolus in multiple cell types, consistent with recent findings from other labs, and also that polyP affects gene expression during development. Given that the authors also generate the Nuc-FLYX construct to deplete polyP from the nucleus, it is surprising that they test how depleting cytoplasmic but not nuclear polyP affects development. However, providing these tools is a service to the community, and testing the phenotypic consequences of all the FLYX constructs may arguably be beyond the scope of this first study.
We agree this is an important avenue. In this first study, we focused on establishing the toolkit and reporting phenotypes with Cyto-FLYX. We are systematically assaying phenotypes from all FLYX constructs, including Nuc-FLYX, in ongoing studies
Recommendations for the authors:
Reviewing Editor Comment:
The reviewers appreciated the general quality of the rigour and work presented in this manuscript. We also had a few recommendations for the authors. These are listed here and the details related to them can be found in the individual reviews below.
(1) We suggest including an appropriate control to show that PPBD binds polyP specifically.
We have updated the response section as follows:
(a) Highlighted previous literature that showed the specificity of PPBD.
(b) We show that the punctate staining observed by PPBD is not demonstrated by the mutant PPBD (PPBD<sup>Mut</sup>) in which amino acids that are responsible for polyP binding are mutated.
(c) We show that PPBD<sup>Mut</sup> does not bind to polyP using Microscale Thermophoresis.
(d) We show that treatment of fixed and permeabilised hemocytes with ScPpX1 reduces the PPBD staining intensity and number of punctae, as compared to tissues left untreated or treated with heat-inactivated ScPpX1.
We have included these in our updated revised manuscript (Fig. 2B-G, p.8, l.151–157)
(2) The high concentration of PolyP in the clotting assay might be impeding clotting. The authors may want to consider lowering this in their assays.
We have addressed this concern in our revised manuscript. We have performed the clotting assays with lower polyP concentrations (concentrations previously used in clotting experiments with human blood and polyP). Data is included in Fig. S5F–I, p.12, l.241–243.
(3) The RNAseq study: can the authors please describe this better and possibly mine it for the regulation of genes that affect eclosion?
In our revised manuscript, we have included a broader discussion about the RNAseq analysis done in the article in both the ‘results’ and the ‘discussion’ sections, where we have rewritten the narrative from the perspective of accelerated eclosion. (p.15 l.310-335, p. 20, l.431-446).
(4) Have the authors considered the possibility that the gut microbiota might be contributing to some of their measurements and assays? It would be good to address this upfront - either experimentally, in the discussion, or (ideally) both.
This is an exciting possibility. Several observations argue that fly tissues synthesize polyP: (i) polyP levels remain very low during feeding stages but build up in wandering third instar larvae after feeding ceases; (ii) PPBD staining is absent from the gut except the crop (Fig. S3O–P); (iii) in C. elegans, intestinal polyP was unaffected when worms were fed polyP-deficient bacteria (2); (iv) depletion of polyP from plasmatocytes alone impairs hemolymph clotting, which would not be expected if gut-derived polyP were the major source and may have contributed to polyP in hemolymph. Nevertheless, microbiota-derived polyP may contribute, and we plan systematic testing in axenic flies in future work.
Reviewer #1 (Recommendations for the authors):
(1) While the authors have shown that the depletion tool results in a general reduction of polyP levels in Figure 3D, it would have been nice to show this via IHC. Particularly since the depletion depends on the strength of the Gal4, it is possible that the phenotypes are being under-estimated because the depletions are weak.
We agree that different Gal4 lines have different strengths and will therefore affect polyP levels and the strength of the phenotype differently.
We performed PPBD staining on hemocytes expressing ScPPX; however, we observed very intense, uniform staining throughout the cells, which was unexpected. It seems like PPBD is recognizing overexpressed ScPpX1. Indeed, in an unpublished study by Manisha Mallick (Bhandari lab), it was found that His-ScPpX1 specifically interacts with GST-PPBD in a protein interaction assay (See Author response image 3). Due to these issues, we refrained from IHC/PPBD-based validation.
Author response image 3.
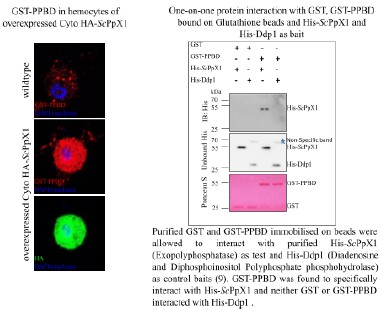
(2) The subcellular tools for depletion are neat! I wonder why the authors didn't test them. For example in the salivary gland for nuclear depletion?
We have addressed this question in the reviewer responses. We are systematically assaying phenotypes from all FLYX constructs, including Mito-FLYX, and Nuc-FLYX, in ongoing independent investigations. As discussed in #1, a possible interaction of ScPpX and PPBD is making this test a bit more challenging, and hence, they each require a detailed investigation.
(a) Does the absence of clotting defects using Lz-gal4 suggest that PolyP is more crucial in the plasmatocytoes and for the initial clotting process? And that it is dispensible/less important in the crystal cells and for the later clotting process. Or is it that the crystal cells just don't have as much polyP? The image (2E-H) certainly looks like it.
In hemolymph, the primary clot formation is a result of the clotting factors secreted from the fat bodies and the plasmatocytes. The crystal cells are responsible for the release of factors aiding in successfully hardening the soft clot initially formed. Reports suggest that clotting and melanization of the clot are independent of each other (7). Since Crystal cells do not contribute to clot fibre formation, the absence of clotting defects using LzGAL4-CytoFLYX is not surprising. Alternatively, PolyP may be secreted from all hemocytes and contribute to clotting; however, the crystal cells make up only 5% hemocytes, and hence polyP depletion in those cells may have a negligible effect on blood clotting.
Crystal cells do show PPBD staining. Whether polyP is significantly lower in levels in the crystal cells as compared to the plasmatocytes needs more systematic investigation. Image (2E-H) is a representative image of the presence of polyP in crystal cells and can not be considered to compare polyP levels in the crystal cells vs Plasmatocytes.
(b) The RNAseq analyses and data could be better presented. If the data are indeed variable and the differentially expressed genes of low confidence, I might remove that data entirely. I don't think it'll take away from the rest of the work.
We understand this concern and, therefore, in the revised manuscript, we have included a broader discussion about the RNAseq analysis done in the article in both the ‘results’ and the ‘discussion’ sections, where we have rewritten the narrative from the perspective of accelerated eclosion. (p.15 l.310-335, p. 20, l.431-446). We have also stated the limitations of such studies.
(c) I would re-phrase the first sentence of the results section.
We have re-phrased it in the revised manuscript.
Reviewer #2 (Recommendations for the authors):
(1) The authors created several different versions of the FLYX system that would be targeted to different subcellular compartments. They mostly report on the effects of cytosolic targeting, but some of the constructs targeted the polyphosphatase to mitochondria or the nucleus.
They report that the targeting worked, but I didn't see any results on the effects of those constructs on fly viability, development, etc.
There is a growing literature of investigators targeting polyphosphatase to mitochondria and showing how depleting mitochondrial polyP alters mitochondrial function. What was the effect of the Nuc-FLYX and Mito-FLYX constructs on the flies?
Also, the authors should probably cite the papers of others on the effects of depleting mitochondrial polyP in other eukaryotic cells in the context of discussing their findings in flies.
We have addressed this question in the reviewer responses. We did not see any obvious developmental or viability defects with any of the FLYX lines, and only after careful investigation did we come across the clotting defects in the CytoFLYX. We are currently systematically assaying phenotypes from all FLYX constructs, including Mito-FLYX and Nuc-FLYX, in independent ongoing investigations.
We have discussed the heterologous expression of mitochondrial polyphosphatase in mammalian cells to justify the need for developing Mito-FLYX (p. 10, l. 197-200). In the discussion section, we also discuss the presence and roles of polyP in the nucleus and how Nuc-FLYX can help study such phenomena (p. 19, l. 399-407).
(2) The authors should number the pages of their manuscript to make it easier for reviewers to refer to specific pages.
We have numbered our lines and pages in the revised manuscript.
(3) Abstract: the abbreviation, "polyP", is not defined in the abstract. The first word in the abstract is "polyphosphate", so it should be defined there.
We have corrected it in the revised version.
(4) The authors repeatedly use the phrase, "orange hot", to describe one of the colors in their micrographs, but I don't know how this differs from "orange".
‘OrangeHot’ is the name of the LUT used in the ImageJ analysis and hence referred to as the colour
(5) First page of the Introduction: the phrase, "feeding polyP to αβ expression Alzheimer's model of Caenorhabditis elegans" is awkward (it literally means feeding polyP to the model instead of the worms).
We have revised it. (p.3, l.55-57).
(6) Page 2 of the Introduction: The authors should cite this paper when they state that NUDT3 is a polyphosphatase: https://pubmed.ncbi.nlm.nih.gov/34788624/
We have cited the paper in the revised version of the manuscript. (p.4, l. 68-70)
(7) Page 2 of Results: The authors report the polyP content in the third instar larva (misspelled as "larval") to five significant digits ("419.30"). Their data do not support more than three significant digits, though.
We have corrected it in the revised manuscript.
(8) Page 3 of Results (paragraph 1): When discussing the polyP levels in various larval stages, the authors are extracting total polyP from the larvae. It seems that at least some of the polyP may come from gut microbes. This should probably be mentioned.
This is an interesting possibility. Several observations argue that polyP is synthesized by fly tissues: (i) polyP levels remain very low during feeding stages but build up in wandering third instar larvae after feeding ceases; (ii) PPBD staining is absent from the gut except the crop (Fig. S3O–P); (ii) In C. elegans, intestinal polyP was unaffected when worms were fed polyP-deficient bacteria (2); (iv) depletion of polyP from plasmatocytes alone impairs hemolymph clotting, which would not be expected if gut-derived polyP were the major source and may have contributed to polyP in hemolymph. We mention this limitation in the revised manuscript (p.19-20, l. 425-433).
(9) Page 3 of Results (paragraph 2): stating that the 4% paraformaldehyde works "best" is imprecise. What do the authors mean by "best"?
We have addressed this comment in the revised manuscript and corrected it as 4% paraformaldehyde being better among the three methods we used to fix tissues, which also included methanol and Bouin’s fixative (p.8, l. 152-154).
(10) Page 4 of Results (paragraph 2, last line of the page): The scientific literature is vast, so one can never be sure that one knows of all the papers out there, even on a topic as relatively limited as polyP. Therefore, I would recommend qualifying the statement "...this is the first comprehensive tissue staining report...". It would be more accurate (and safer) to say something like, "to our knowledge, this is the first..." There is a similar statement with the word "first" on the next page regarding the FLYX library.
We have addressed this concern and corrected it accordingly in the revised version of the manuscript (p.9, l. 192-193)
Reviewer #3 (Recommendations for the authors):
(1) The authors should include in their discussion a comparison of cell biological observations using the polyP binding domain of E. coli Ppx (GST-PPBD) to fluorescently label polyP in cells and tissues with recent work using a similar approach in C. elegans (Quarles et al., PMID:39413779).
In the revised manuscript, we have cited the work of Quarles et al. and have added a comparison of observations (p.19,l.408-410). In the discussion, we have also focused on multiple other studies about how polyP presence in different subcellular compartments, like the nucleus, can be assayed and studied with the tools developed in this study.
(2) The gene expression studies of time-matched Cyto-FLYX vs WT larvae is very intriguing. Given the authors' findings that non-feeding third instar Cyto-FLYX larvae are developmentally ahead of WT larvae, can the observed trends be explained by known changes in gene expression that occur during eclosion? This is mentioned in the results section in the context of genes linked to neurons, but a broader discussion of which pathway changes observed can be explained by the developmental stage difference between the WT and FLYX larvae would be helpful in the discussion.
We have included a broader discussion about the RNAseq analysis done in the article in both the ‘results’ and the ‘discussion’ sections, where we have rewritten the narrative from the perspective of accelerated eclosion. (p.15 l.310-335, p. 20, l.431-446). We have also stated the limitations of such studies.
(3) The sentence describing NUDT3 is not referenced.
We have addressed this comment and have cited the paper of NUDT3 in the revised version of the manuscript.(p.4, l. 68-70)
(4) In the first sentence of the results section, the meaning/validity of the statement "The polyP levels have decreased as evolution progressed" is not clear. It might be more straightforward to give an estimate of the total pmoles polyP/mg protein difference between bacteria/yeast and metazoans.
In the revised manuscript, we have given an estimate of the polyP content across various species across evolution to uphold the statement that polyP levels have decreased as evolution progressed (p. 5, l. 87-91).
(5) The description of the malachite green assay in the results section describes it as "calorimetric" but this should read "colorimetric?"
We have corrected it in the revised manuscript.
References
(1) Chicco D, Agapito G. Nine quick tips for pathway enrichment analysis. PLoS Comput Biol. 2022 Aug 11;18(8):e1010348.
(2) Quarles E, Petreanu L, Narain A, Jain A, Rai A, Wang J, et al. Cryosectioning and immunofluorescence of C. elegans reveals endogenous polyphosphate in intestinal endo-lysosomal organelles. Cell Rep Methods. 2024 Oct 8;100879.
(3) Saito K, Ohtomo R, Kuga-Uetake Y, Aono T, Saito M. Direct labeling of polyphosphate at the ultrastructural level in Saccharomyces cerevisiae by using the affinity of the polyphosphate binding domain of Escherichia coli exopolyphosphatase. Appl Environ Microbiol. 2005 Oct;71(10):5692–701.
(4) Smith SA, Mutch NJ, Baskar D, Rohloff P, Docampo R, Morrissey JH. Polyphosphate modulates blood coagulation and fibrinolysis. Proc Natl Acad Sci USA. 2006 Jan 24;103(4):903–8.
(5) Smith SA, Choi SH, Davis-Harrison R, Huyck J, Boettcher J, Rienstra CM, et al. Polyphosphate exerts differential effects on blood clotting, depending on polymer size. Blood. 2010 Nov 18;116(20):4353–9.
(6) Abramov AY, Fraley C, Diao CT, Winkfein R, Colicos MA, Duchen MR, et al. Targeted polyphosphatase expression alters mitochondrial metabolism and inhibits calcium-dependent cell death. Proc Natl Acad Sci USA. 2007 Nov 13;104(46):18091–6.
(7) Schmid MR, Dziedziech A, Arefin B, Kienzle T, Wang Z, Akhter M, et al. Insect hemolymph coagulation: Kinetics of classically and non-classically secreted clotting factors. Insect Biochem Mol Biol. 2019 Jun;109:63–71.
(8) Jian Guan, Rebecca Lee Hurto, Akash Rai, Christopher A. Azaldegui, Luis A. Ortiz-Rodríguez, Julie S. Biteen, Lydia Freddolino, Ursula Jakob. HP-Bodies – Ancestral Condensates that Regulate RNA Turnover and Protein Translation in Bacteria. bioRxiv 2025.02.06.636932; doi: https://doi.org/10.1101/2025.02.06.636932.
(9) Lonetti A, Szijgyarto Z, Bosch D, Loss O, Azevedo C, Saiardi A. Identification of an evolutionarily conserved family of inorganic polyphosphate endopolyphosphatases. J Biol Chem. 2011 Sep 16;286(37):31966–74.
Author response:
The following is the authors’ response to the original reviews.
Public Reviews:
Reviewer #1 (Public review):
Summary
This paper introduces a dual-pathway model for reconstructing naturalistic speech from intracranial ECoG data. It integrates an acoustic pathway (LSTM + HiFi-GAN for spectral detail) and a linguistic pathway (Transformer + Parler-TTS for linguistic content). Output from the two components is later merged via CosyVoice2.0 voice cloning. Using only 20 minutes of ECoG data per participant, the model achieves high acoustic fidelity and linguistic intelligibility.
Strengths
(1) The proposed dual-pathway framework effectively integrates the strengths of neural-to-acoustic and neural-to-text decoding and aligns well with established neurobiological models of dual-stream processing in speech and language.
(2) The integrated approach achieves robust speech reconstruction using only 20 minutes of ECoG data per subject, demonstrating the efficiency of the proposed method.
(3) The use of multiple evaluation metrics (MOS, mel-spectrogram R², WER, PER) spanning acoustic, linguistic (phoneme and word), and perceptual dimensions, together with comparisons against noisedegraded baselines, adds strong quantitative rigor to the study.
We thank Reviewer #1 for the supportive comments. In addition, we appreciate Reviewer #1’s thoughtful comments and feedback. By addressing these comments, we believe we have greatly improved the clarity of our claims and methodology. Below we list our point-to-point responses addressing concerns raised by Reviewer #1.
Weaknesses:
(1) It is unclear how much the acoustic pathway contributes to the final reconstruction results, based on Figures 3B-E and 4E. Including results from Baseline 2 + CosyVoice and Baseline 3 + CosyVoice could help clarify this contribution.
We sincerely appreciate the inquiry from Reviewer 1. We thank the reviewer for this suggestion. However, we believe that directly applying CosyVoice to the outputs of Baseline 2 or Baseline 3 in isolation is not methodologically feasible and would not correctly elucidate the contribution of the auditory pathway and might lead to misinterpretation.
The role of CosyVoice 2.0 in our framework is specifically voice cloning and fusion, not standalone enhancement. It is designed to integrate information from two pathways. Its operation requires two key inputs:
(1) A voice reference speech that provides the target speaker's timbre and prosodic characteristics. In our final pipeline, this is provided by the denoised output of the acoustic pathway (Baseline 2).
(2) A target word sequence that specifies the linguistic content to be spoken. This is obtained by transcribing the output of the linguistic pathway (Baseline 3) using Whisper ASR. Therefore, the standalone outputs of Baseline 2 and Baseline 3 are the purest demonstrations of what each pathway contributes before fusion. The significant improvement in WER/PER and MOS in the final output (compared to Baseline 2) and the significant improvement in melspectrogram R² (compared to Baseline 3) together demonstrate the complementary contributions of the two pathways. The fusion via CosyVoice is the mechanism that allows these contributions to be combined. We have added a clearer explanation of CosyVoice's role and the rationale for not testing it on individual baselines in the revised manuscript (Results section: "The fine-tuned voice cloner further enhances...").
Edits:
Page 11, Lines 277-282:
“ Voice cloning is used to bridge the gap between acoustic fidelity and linguistic intelligibility in speech reconstruction. This approach strategically combines the strengths of complementary pathways: the acoustic pathway preserves speaker-specific spectral characteristics while the linguistic pathway maintains lexical and phonetic precision. By integrating these components through neural voice cloning, we achieve balanced reconstruction that overcomes the limitations inherent in isolated systems. CosyVoice 2.0, the voice cloner module serves specifically as a voice cloning and fusion engine, requiring two inputs: (1) a voice reference speech (provided by the denoised output of the acoustic pathway) to specify the target speaker's identity, and (2) a target word sequence (transcribed from the output of the linguistic pathway) to specify the linguistic content. The standalone baseline outputs of the two pathways can be integrated in this way.”
(2) As noted in the limitations, the reconstruction results heavily rely on pre-trained generative models. However, no comparison is provided with state-of-the-art multimodal LLMs such as Qwen3-Omni, which can process auditory and textual information simultaneously. The rationale for using separate models (Wav2Vec for speech and TTS for text) instead of a single unified generative framework should be clearly justified. In addition, the adaptor employs an LSTM architecture for speech but a Transformer for text, which may introduce confounds in the performance comparison. Is there any theoretical or empirical motivation for adopting recurrent networks for auditory processing and Transformer-based models for textual processing?
We thank the reviewer for the insightful suggestion regarding multimodal large language models (LLMs) such as Qwen3-Omni. It is important to clarify the distinction between general-purpose interactive multimodal models and models specifically designed for high-fidelity voice cloning and speech synthesis.
As for the comparison with the state-of-the-art multimodal LLMs:
Qwen3-Omni and GLM-4-Voice are powerful conversational agents capable of processing multiple modalities including text, speech, image, and video, as described in its documentation (see: https://help.aliyun.com/zh/model-studio/qwen-tts-realtime and https://docs.bigmodel.cn/cn/guide/models/sound-and-video/glm-4-voice). However, it is primarily optimized for interactive dialogue and multimodal understanding rather than for precise, speaker-adaptive speech reconstruction from neural signals. In contrast, CosyVoice 2.0, developed by the same team at Alibaba, is specifically designed for voice cloning and text-to-speech synthesis (see: https://help.aliyun.com/zh/model-studio/text-to-speech). It incorporates advanced speaker adaptation and acoustic modeling capabilities that are essential for reconstructing naturalistic speech from limited neural data. Therefore, our choice of CosyVoice for the final synthesis stage aligns with the goal of integrating acoustic fidelity and linguistic intelligibility, which is central to our study.
For the selection of LSTM and Transformer in the two pathways:
The goal of the acoustic adaptor is to reconstruct fine-grained spectrotemporal details (formants, harmonic structures, prosodic contours) with millisecond-to-centisecond precision. These features rely heavily on local temporal dynamics and short-to-medium range dependencies (e.g., within and between phonemes/syllables). In our ablation studies (to be added in the supplementary), we found that Transformer-based adaptors, which inherently emphasize global sentence-level context through self-attention, tended to oversmooth the reconstructed acoustic features, losing critical fine-temporal details essential for naturalness. In contrast, the recurrent nature of LSTMs, with their inherent temporal state propagation, proved more effective at modeling these local sequential dependencies without excessive smoothing, leading to higher mel-spectrogram fidelity. This aligns with the neurobiological observation that early auditory cortex processes sound with precise temporal fidelity. Moreover, from an engineering perspective, LSTM-based decoders have been empirically shown to perform well in sequential prediction tasks with limited data, as evidenced in prior work on sequence modeling and neural decoding (1).
The goal of the linguistic adaptor is to decode abstract, discrete word tokens. This task benefits from modeling long-range contextual dependencies across a sentence to resolve lexical ambiguity and syntactic structure (e.g., subject-verb agreement). The self-attention mechanism of Transformers is exceptionally well-suited for capturing these global relationships, as evidenced by their dominance in NLP. Our experiments confirmed that a Transformer adaptor outperformed an LSTM-based one in word token prediction accuracy.
While a unified multimodal LLM could in principle handle both modalities, such models often face challenges in modality imbalance and task specialization. Audio and text modalities have distinct temporal scales, feature distributions, and learning dynamics. By decoupling them into separate pathways with specialized adaptors, we ensure that each modality is processed by an architecture optimized for its inherent structure. This divide-and-conquer strategy avoids the risk of one modality dominating or interfering with the learning of the other, leading to more stable training and better final performance, especially important when adapting to limited neural data.
Edits:
Page 9, Lines 214-223:
“The acoustic pathway, implemented through a bi-directional LSTM neural adaptor architecture (Fig. 1B), specializes in reconstructing fundamental acoustic properties of speech. This module directly processes neural recordings to generate precise time-frequency representations, focusing on preserving speaker-specific spectral characteristics like formant structures, harmonic patterns, and spectral envelope details. Quantitative evaluation confirms its core competency: achieving a mel-spectrogram R² of 0.793 ± 0.016 (Fig. 3B) demonstrates remarkable fidelity in reconstructing acoustic microstructure. This performance level is statistically indistinguishable from original speech degraded by 0dB additive noise (0.771 ± 0.014, p = 0.242, one-sided t-test). We chose a bidirectional LSTM architecture for this adaptor because its recurrent nature is particularly suited to modeling the fine-grained, short- to medium-range temporal dependencies (e.g., within and between phonemes and syllables) that are critical for acoustic fidelity. An ablation study comparing LSTM against Transformerbased adaptors for this task confirmed that LSTMs yielded superior mel-spectrogram reconstruction fidelity (higher R²), as detailed in Table S1, likely by avoiding the oversmoothing of spectrotemporal details sometimes induced by the strong global context modeling of Transformers”.
“To confirm that the acoustic pathway’s output is causally dependent on the neural signal rather than the generative prior of the HiFi-GAN, we performed a control analysis in which portions of the input ECoG recording were replaced with Gaussian noise. When either the first half, second half, or the entirety of the neural input was replaced by noise, the melspectrogram R² of the reconstructed speech dropped markedly, corresponding to the corrupted segment (Fig. S5). This demonstrates that the reconstruction is temporally locked to the specific neural input and that the model does not ‘hallucinate’ spectrotemporal structure from noise. These results validate that the acoustic pathway performs genuine, input-sensitive neural decoding”.
Edits:
Page 10, Lines 272-277:
“We employed a Transformer-based Seq2Seq architecture for this adaptor to effectively capture the long-range contextual dependencies across a sentence, which are essential for resolving lexical ambiguity and syntactic structure during word token decoding. This choice was validated by an ablation study (Table S2), indicating that the Transformer adaptor outperformed an LSTM-based counterpart in word prediction accuracy”
(3) The model is trained on approximately 20 minutes of data per participant, which raises concerns about potential overfitting. It would be helpful if the authors could analyze whether test sentences with higher or lower reconstruction performance include words that were also present in the training set.
Thank you for raising the important concern regarding potential overfitting given the limited size of our training dataset (~20 minutes per participant). To address this point directly, we performed a detailed lexical overlap analysis between the training and test sets.
The test set contains 219 unique words. Among these:
127 words (58.0%) appeared in the training set (primarily high-frequency, common words).
92 words (42.0%) were entirely novel and did not appear in the training set. We further examined whether trials with the best reconstruction (WER = 0) relied more on training vocabulary. Among these top-performing trials, 55.0% of words appeared in the training set. In contrast, the worst-performing trials showed 51.9% overlap in words in the training set. No significant difference was observed, suggesting that performance is not driven by simple lexical memorization.
The presence of a substantial proportion of novel words (42%) in the test set, combined with the lack of performance advantage for overlapping content, provides strong evidence that our model is generalizing linguistic and acoustic patterns rather than merely memorizing the training vocabulary. High reconstruction performance on unseen words would be improbable under severe overfitting.
Therefore, we conclude that while some lexical overlap exists (as expected in natural language), the model’s performance is driven by its ability to decode generalized neural representations, effectively mitigating the overfitting risk highlighted by the reviewer.
(4) The phoneme confusion matrix in Figure 4A does not appear to align with human phoneme confusion patterns. For instance, /s/ and /z/ differ only in voicing, yet the model does not seem to confuse these phonemes. Does this imply that the model and the human brain operate differently at the mechanistic level?
We thank the reviewer for this detailed observation regarding the difference between our model's phoneme confusion patterns and typical human perceptual confusions (e.g., the lack of /s/-/z/ confusion).
The reviewer is correct in inferring a mechanistic difference. This divergence is primarily attributable to the Parler-TTS model acting as a powerful linguistic prior. Our linguistic pathway decodes word tokens, which Parler-TTS then converts to speech. Trained on massive corpora to produce canonical pronunciations, Parler-TTS effectively performs an implicit "error correction." For instance, if the neural decoding is ambiguous between the words "sip" and "zip," the TTS model's strong prior for lexical and syntactic context will likely resolve it to the correct word, thereby suppressing purely acoustic confusions like voicing.
This has important implications for interpreting our model's errors and its relationship to brain function. The phoneme errors in our final output reflect a combination of neural decoding errors and the generative biases of the TTS model, which is optimized for intelligibility rather than mimicking raw human misperception. This does imply our model operates differently from the human auditory periphery. The human brain may first generate a percept with acoustic confusions, which higher-level language regions then disambiguate. Our model effectively bypasses the "confused percept" stage by directly leveraging a pre-trained, high-level language model for disambiguation. This is a design feature contributing to its high intelligibility, not necessarily a flaw. This observation raises a fascinating question: Could a model that more faithfully simulates the hierarchical processing of the human brain (including early acoustic confusions) provide a better fit to neural data at different processing stages? Future work could further address this question.
Edits:
add another paragraph in Discussion (Page 14, Lines 397-398):
“The phoneme confusion pattern observed in our model output (Fig. 4A) differs from classic human auditory confusion matrices. We attribute this divergence primarily to the influence of the Parler-TTS model, which serves as a strong linguistic prior in our pipeline. This component is trained to generate canonical speech from text tokens. When the upstream neural decoding produces an ambiguous or erroneous token sequence, the TTS model’s internal language model likely performs an implicit ‘error correction,’ favoring linguistically probable words and pronunciations. This underscores that our model’s errors arise from a complex interaction between neural decoding fidelity and the generative biases of the synthesis stage”
(5) In general, is the motivation for adopting the dual-pathway model to better align with the organization of the human brain, or to achieve improved engineering performance? If the goal is primarily engineeringoriented, the authors should compare their approach with a pretrained multimodal LLM rather than relying on the dual-pathway architecture. Conversely, if the design aims to mirror human brain function, additional analysis, such as detailed comparisons of phoneme confusion matrices, should be included to demonstrate that the model exhibits brain-like performance patterns.
Our primary motivation is engineering improvement, to overcome the fundamental trade-off between acoustic fidelity and linguistic intelligibility that has limited previous neural speech decoding work. The design is inspired by the related works of the convergent representation of speech and language perception (2). However, we do not claim that our LSTM and Transformer adaptors precisely simulate the specific neural computations of the human ventral and dorsal streams. The goal was to build a high-performance, data-efficient decoder. We will clarify this point in the Introduction and Discussion, stating that while the architecture is loosely inspired by previous neuroscience results, its primary validation is its engineering performance in achieving state-of-the-art reconstruction quality with minimal data.
Edits:
Page 14, Line 358-373:
“In this study, we present a dual-path framework that synergistically decodes both acoustic and linguistic speech representations from ECoG signals, followed by a fine-tuned zero-shot text-to-speech network to re-synthesize natural speech with unprecedented fidelity and intelligibility. Crucially, by integrating large pre-trained generative models into our acoustic reconstruction pipeline and applying voice cloning technology, our approach preserves acoustic richness while significantly enhancing linguistic intelligibility beyond conventional methods. Our dual-pathway architecture, while inspired by converging neuroscience insights on speech and language perception, was principally designed and validated as an engineering solution. The primary goal to build a practical decoder that achieves state-of-theart reconstruction quality with minimal data. The framework's success is therefore ultimately judged by its performance metrics, high intelligibility (WER, PER), acoustic fidelity (melspectrogram R²), and perceptual quality (MOS), which directly address the core engineering challenge we set out to solve. Using merely 20 minutes of ECoG recordings, our model achieved superior performance with a WER of 18.9% ± 3.3% and PER of 12.0% ± 2.5% (Fig. 2D, E). This integrated architecture, combining pre-trained acoustic (Wav2Vec2.0 and HiFiGAN) and linguistic (Parler-TTS) models through lightweight neural adaptors, enables efficient mapping of ECoG signals to dual latent spaces. Such methodology substantially reduces the need for extensive neural training data while achieving breakthrough word clarity under severe data constraints. The results demonstrate the feasibility of transferring the knowledge embedded in speech-data pre-trained artificial intelligence (AI) models into neural signal decoding, paving the way for more advanced brain-computer interfaces and neuroprosthetics”.
Reviewer #2 (Public review):
Summary:
The study by Li et al. proposes a dual-path framework that concurrently decodes acoustic and linguistic representations from ECoG recordings. By integrating advanced pre-trained AI models, the approach preserves both acoustic richness and linguistic intelligibility, and achieves a WER of 18.9% with a short (~20-minute) recording.
Overall, the study offers an advanced and promising framework for speech decoding. The method appears sound, and the results are clear and convincing. My main concerns are the need for additional control analyses and for more comparisons with existing models.
Strengths:
(1) This speech-decoding framework employs several advanced pre-trained DNN models, reaching superior performance (WER of 18.9%) with relatively short (~20-minute) neural recording.
(2) The dual-pathway design is elegant, and the study clearly demonstrates its necessity: The acoustic pathway enhances spectral fidelity while the linguistic pathway improves linguistic intelligibility.
We thank Reviewer #2 for supportive comments. In addition, we appreciate Reviewer #2’s thoughtful comments and feedback. By addressing these comments, we believe we have greatly improved the clarity of our claims and methodology. Below we list our point-to-point responses addressing concerns raised by Reviewer #2.
Weaknesses:
The DNNs used were pre-trained on large corpora, including TIMIT, which is also the source of the experimental stimuli. More generally, as DNNs are powerful at generating speech, additional evidence is needed to show that decoding performance is driven by neural signals rather than by the DNNs' generative capacity.
Thank you for raising this crucial point regarding the potential for pre-trained DNNs to generate speech independently of the neural input. We fully agree that it is essential to disentangle the contribution of the neural signals from the generative priors of the models. To address this directly, we have conducted two targeted control analyses, as you suggested, and have integrated the results into the revised manuscript (see Fig. S5 and the corresponding description in the Results section):
(1) Random noise input: We fed Gaussian noise (matched in dimensionality and temporal structure to real ECoG recordings) into the trained adaptors. The outputs were acoustically unstructured and linguistically incoherent, confirming that the generative models alone cannot produce meaningful speech without valid neural input.
(2) Partial sentence input (real + noise): For the acoustic pathway, we systematically replaced portions of the ECoG input with noise. The reconstruction quality (mel-spectrogram R²) dropped significantly in the corrupted segments, demonstrating that the decoding is temporally locked to the neural signal and does not “hallucinate” speech from noise.
These results provide strong evidence that our model’s performance is causally dependent on and sensitive to the specific neural input, validating that it performs genuine neural decoding rather than merely leveraging the generative capacity of the pre-trained DNNs.
The detailed edits are in the “recommendations” below. (See recommendations (1) and (2))
Recommendations for the authors:
Reviewer #1 (Recommendations for the authors):
(1) Clarify the results shown in Figure 4E. The integrated approach appears to perform comparably to Baseline 3 in phoneme class clarity. However, Baseline 3 represents the output of the linguistic pathway alone, which is expected to encode information primarily at the word level.
We appreciate the reviewer's observation and agree that clarification is needed. The phoneme class clarity (PCC) metric shown in Figure 4E measures whether mis-decoded phonemes are more likely to be confused within their own class (vowel-vowel or consonantconsonant) rather than across classes (vowel-consonant). A higher PCC indicates that the model's errors tend to be phonologically similar sounds (e.g., one vowel mistaken for another), which is a reasonable property for intelligibility.
We would like to clarify the nature of Baseline 3. As stated in the manuscript (Results section: "The linguistic pathway reconstructs high-intelligibility, higher-level linguistic information"), Baseline 3 is the output of our linguistic pathway. This pathway operates as follows: the ECoG signals are mapped to word tokens via the Transformer adaptor, and these tokens are then synthesized into speech by the frozen Parler-TTS model. Crucially, the input to Parler-TTS is a sequence of word tokens.
It is important to distinguish between the levels of performance measured: Word Error Rate (WER) reflects accuracy at the lexical level (whole words). The linguistic pathway achieves a low WER by design, as it directly decodes word sequences. Phoneme Error Rate (PER) reflects accuracy at the sublexical phonetic level (phonemes). A low WER generally implies a low PER, because robust word recognition requires reliable phoneme-level representations within the TTS model's prior. This explains why Baseline 3 also exhibits a low PER. However, acoustic fidelity (captured by metrics like mel-spectrogram R²) requires the preservation of fine-grained spectrotemporal details such as pitch, timbre, prosody, and formant structures, information that is not directly encoded at the lexical level and is therefore not a strength of the purely linguistic pathway.
While Parler-TTS internally models sub-word/phonetic information to generate the acoustic waveform, the primary linguistic information driving the synthesis is at the lexical (word) level. The generated speech from Baseline 3 therefore contains reconstructed phonemic sequences derived from the decoded word tokens, not from direct phoneme-level decoding of ECoG.
Therefore, the comparable PCC between our final integrated model and Baseline 3 (linguistic pathway) suggests that the phoneme-level error patterns (i.e., the tendency to confuse within-class phonemes) in our final output are largely inherited from the high-quality linguistic prior embedded in the pre-trained TTS model (Parler-TTS). The integrated framework successfully preserves this desirable property from the linguistic pathway while augmenting it with speaker-specific acoustic details from the acoustic pathway, thereby achieving both high intelligibility (low WER/PER) and high acoustic fidelity (high melspectrogram R²).
We will revise the caption of Figure 4E and the corresponding text in the Results section to make this interpretation explicit.
Edits:
Page 12, Lines 317-322:
“In addition to the confusion matrices, we categorized the phonemes into vowels and consonants to assess the phoneme class clarity. We defined "phoneme class clarity" (PCC) as the proportion of errors where a phoneme was misclassified within the same class versus being misclassified into a different class. The purpose of introducing PCC is to demonstrate that most of the misidentified phonemes belong to the same category (confusion between vowels or consonants), rather than directly comparing the absolute accuracy of phoneme recognition. For instance, a vowel being mistaken for another vowel would be considered a within-class error, whereas a vowel being mistaken for a consonant would be classified as a between-class error”
(2) Add results from Baseline 2 + CosyVoice and Baseline 3 + CosyVoice to clarify the contribution of the auditory pathway.
Thank you for the suggestion. We appreciate the opportunity to clarify the role of CosyVoice in our framework.
As explained in our response to point (1), CosyVoice 2.0 is designed as a fusion module that requires two inputs: 1) a voice reference (from the acoustic pathway) to specify speaker identity, and 2) a word sequence (from the linguistic pathway) to specify linguistic content. Because it is not a standalone enhancer, applying CosyVoice to a single pathway output (e.g., Baseline 2 or 3 alone) is not quite feasible and would not reflect its intended function and could lead to misinterpretation of each pathway’s contribution.
Instead, we have evaluated the contribution of each pathway by comparing the final integrated output against each standalone pathway output (Baseline 2 and 3). The significant improvements in both acoustic fidelity and linguistic intelligibility demonstrate the complementary roles of the two pathways, which are effectively fused through CosyVoice.
(3) Justify your choice of using LSTM and Transformer architecture for the auditory and linguistic neural adaptors, respectively, and how your methods could compare to using a unified generative multimodal LLM for both pathways.
Thank you for revisiting this important point. We appreciate your interest in the architectural choices and their relationship to state-of-the-art multimodal models.
As detailed in our response to point (2), our choice of LSTM for the acoustic pathway and Transformer for the linguistic pathway is driven by task-specific requirements, supported by ablation studies (Supplementary Tables 1–2). The acoustic pathway benefits from LSTM’s ability to model fine-grained, local temporal dependencies without over-smoothing. The linguistic pathway benefits from Transformer’s ability to capture long-range semantic and syntactic context.
Regarding comparison with unified multimodal LLMs (e.g., Qwen3-Omni), we clarified that such models are optimized for interactive dialogue and multimodal understanding, while our framework relies on specialist models (CosyVoice 2.0, Parler-TTS) that are explicitly designed for high-fidelity, speaker-adaptive speech synthesis, a requirement central to our decoding task.
We have incorporated these justifications into the revised manuscript (Results and Discussion sections) and appreciate the opportunity to further emphasize these points.
Edits:
Page 9, Lines 214-223:
“The acoustic pathway, implemented through a bi-directional LSTM neural adaptor architecture (Fig. 1B), specializes in reconstructing fundamental acoustic properties of speech. This module directly processes neural recordings to generate precise time-frequency representations, focusing on preserving speaker-specific spectral characteristics like formant structures, harmonic patterns, and spectral envelope details. Quantitative evaluation confirms its core competency: achieving a mel-spectrogram R² of 0.793 ± 0.016 (Fig. 3B) demonstrates remarkable fidelity in reconstructing acoustic microstructure. This performance level is statistically indistinguishable from original speech degraded by 0dB additive noise (0.771 ± 0.014, p = 0.242, one-sided t-test). We chose a bidirectional LSTM architecture for this adaptor because its recurrent nature is particularly suited to modeling the fine-grained, short- to medium-range temporal dependencies (e.g., within and between phonemes and syllables) that are critical for acoustic fidelity. An ablation study comparing LSTM against Transformerbased adaptors for this task confirmed that LSTMs yielded superior mel-spectrogram reconstruction fidelity (higher R²), as detailed in Table S1, likely by avoiding the oversmoothing of spectrotemporal details sometimes induced by the strong global context modeling of Transformers”.
“To confirm that the acoustic pathway’s output is causally dependent on the neural signal rather than the generative prior of the HiFi-GAN, we performed a control analysis in which portions of the input ECoG recording were replaced with Gaussian noise. When either the first half, second half, or the entirety of the neural input was replaced by noise, the melspectrogram R² of the reconstructed speech dropped markedly, corresponding to the corrupted segment (Fig. S5). This demonstrates that the reconstruction is temporally locked to the specific neural input and that the model does not ‘hallucinate’ spectrotemporal structure from noise. These results validate that the acoustic pathway performs genuine, input-sensitive neural decoding”.
Page 10, Lines 272-277:
“We employed a Transformer-based Seq2Seq architecture for this adaptor to effectively capture the long-range contextual dependencies across a sentence, which are essential for resolving lexical ambiguity and syntactic structure during word token decoding. This choice was validated by an ablation study (Table S2), indicating that the Transformer adaptor outperformed an LSTM-based counterpart in word prediction accuracy”.
(4) Discuss the differences between the model's phoneme confusion matrix in Figure 4A and human phoneme confusion patterns. In addition, please clarify whether the adoption of the dual-pathway architecture is primarily intended to simulate the organization of the human brain or to achieve engineering improvements.
The observed difference between our model's phoneme confusion matrix and typical human perceptual confusion patterns (e.g., the noted lack of confusion between /s/ and /z/) is, as the reviewer astutely infers, likely attributable to the TTS model (Parler-TTS) acting as a powerful linguistic prior. The linguistic pathway decodes word tokens, and Parler-TTS converts these tokens into speech. Parler-TTS is trained on massive text and speech corpora to produce canonical, clean pronunciations. It effectively performs a form of "error correction" or "canonicalization" based on its internal language model. For example, if the neural decoding is ambiguous between "sip" and "zip", the TTS model's strong prior for lexical and syntactic context may robustly resolve it to the correct word, suppressing purely acoustic confusions like voicing. Therefore, the phoneme errors in our final output reflect a combination of neural decoding errors and the TTS model's generation biases, which are optimized for intelligibility rather than mimicking human misperception. We will add this explanation to the paragraph discussing Figure 4A.
Our primary motivation is engineering improvement, to overcome the fundamental tradeoff between acoustic fidelity and linguistic intelligibility that has limited previous neural speech decoding work. The design is inspired by the convergent representation of speech and language perception (1). However, we do not claim that our LSTM and Transformer adaptors precisely simulate the specific neural computations of the human ventral and dorsal streams. The goal was to build a high-performance, data-efficient decoder. We will clarify this point in the Introduction and Discussion, stating that while the architecture is loosely inspired by previous neuroscience results, its primary validation is its engineering performance in achieving state-of-the-art reconstruction quality with minimal data.
Edits:
Pages 2-3, Lines 74-85:
“Here, we propose a unified and efficient dual-pathway decoding framework that integrates the complementary strengths of both paradigms to enhance the performance of re-synthesized natural speech from the engineering performance. Our method maps intracranial electrocorticography (ECoG) signals into the latent spaces of pre-trained speech and language models via two lightweight neural adaptors: an acoustic pathway, which captures low-level spectral features for naturalistic speech synthesis, and a linguistic pathway, which extracts high-level linguistic tokens for semantic intelligibility. These pathways are fused using a finetuned text-to-speech (TTS) generator with voice cloning, producing re-synthesized speech that retains both the acoustic spectrotemporal details, such as the speaker’s timbre and prosody, and the message linguistic content. The adaptors rely on near-linear mappings and require only 20 minutes of neural data per participant for training, while the generative modules are pre-trained on large unlabeled corpora and require no neural supervision”.
Page 14, Lines 358-373:
“In this study, we present a dual-path framework that synergistically decodes both acoustic and linguistic speech representations from ECoG signals, followed by a fine-tuned zero-shot text-to-speech network to re-synthesize natural speech with unprecedented fidelity and intelligibility. Crucially, by integrating large pre-trained generative models into our acoustic reconstruction pipeline and applying voice cloning technology, our approach preserves acoustic richness while significantly enhancing linguistic intelligibility beyond conventional methods. Our dual-pathway architecture, while inspired by converging neuroscience insights on speech and language perception, was principally designed and validated as an engineering solution. The primary goal to build a practical decoder that achieves state-of-the-art reconstruction quality with minimal data. The framework's success is therefore ultimately judged by its performance metrics, high intelligibility (WER, PER), acoustic fidelity (mel-spectrogram R²), and perceptual quality (MOS), which directly address the core engineering challenge we set out to solve. Using merely 20 minutes of ECoG recordings, our model achieved superior performance with a WER of 18.9% ± 3.3% and PER of 12.0% ± 2.5% (Fig. 2D, E). This integrated architecture, combining pre-trained acoustic (Wav2Vec2.0 and HiFi-GAN) and linguistic (Parler-TTS) models through lightweight neural adaptors, enables efficient mapping of ECoG signals to dual latent spaces. Such methodology substantially reduces the need for extensive neural training data while achieving breakthrough word clarity under severe data constraints. The results demonstrate the feasibility of transferring the knowledge embedded in speech-data pre-trained artificial intelligence (AI) models into neural signal decoding, paving the way for more advanced brain-computer interfaces and neuroprosthetics”.
Reviewer #2 (Recommendations for the authors):
(1) My main question is whether any experimental stimuli overlap with the data used to pre-train the models. The authors might consider using pre-trained models trained on other corpora and training their own model without the TIMIT corpus. Additionally, as pretrained models were used, it might be helpful to evaluate to what extent the decoding is sensitive to the input neural recording or whether the model always outputs meaningful speech. The authors might consider two control analyses: a) whether the model still generates speech-like output if the input is random noise; b) whether the model can decode a complete sentence if the first half recording of a sentence is real but the second half is replaced with noise.
We thank the reviewer for raising this crucial point regarding potential data leakage and the sensitivity of decoding to neural input.
We confirm that the pre-training phase of our core models (Wav2Vec2.0 encoder, HiFiGAN decoder) was conducted exclusively on the LibriSpeech corpus (960 hours), which is entirely separate from the TIMIT corpus used for our ECoG experiments. The subsequent fine-tuning of the CosyVoice 2.0 voice cloner for speaker adaptation was performed on the training set portion of the entire TIMIT corpus. Importantly, the test set for all neural decoding evaluations was strictly held out and never used during any fine-tuning stage. This data separation is now explicitly stated in the " Methods" sections for the Speech Autoencoder and the CosyVoice fine-tuning.
Regarding the potential of training on other corpora, we agree it is a valuable robustness check. Previous work has demonstrated that self-supervised speech models like Wav2Vec2.0 learn generalizable representations that transfer well across domains (e.g., Millet et al., NeurIPS 2022). We believe our use of LibriSpeech, a large and diverse corpus, provides a strong, general-purpose acoustic prior.
We agree with the reviewer that control analyses are essential to demonstrate that the decoded output is driven by neural signals and not merely the generative prior of the models. We have conducted the following analyses and will include them in the revised manuscript (likely in a new Supplementary Figure or Results subsection):
(a) Random Noise Input: We fed Gaussian noise (matched in dimensionality and temporal length to the real ECoG input) into the trained acoustic and linguistic adaptors. The outputs were evaluated. The acoustic pathway generated unstructured, noisy spectrograms with no discernible phonetic structure, and the linguistic pathway produced either highly incoherent word sequences or failed to generate meaningful tokens. The fusion via CosyVoice produced unintelligible babble. This confirms that the generative models alone cannot produce structured speech without meaningful neural input.
(b) Partial Sentence Input (Real + Noise): In the acoustic pathway, we replaced the first half, the second half, and all the ECoG recording for test sentences with Gaussian noise. The melspectrogram R<sup>2</sup> showed a clear degradation in the reconstructed speech corresponding to the noisy segment. We did not do similar experiments in the linguistic pathway because the TTS generator is pre-trained by HuggingFace. We did not train any parameters of Parler-TTS. These results strongly indicate that our model's performance is contingent on and sensitive to the specific neural input, validating that it is performing genuine neural decoding.
Edits:
Page 19, Lines 533-538:
“The parameters in Wav2Vec2.0 were frozen within this training phase. The parameters in HiFi-GAN were optimized using the Adam optimizer with a fixed learning rate of 10<sub>-5</sub>, 𝛽<sub>!</sub> = 0.9, 𝛽<sub>2</sub> = 0.999. We trained this Autoencoder in LibriSpeech, a 960-hour English speech corpus with a sampling rate of 16kHz, which is entirely separate from the TIMIT corpus used for our ECoG experiments. We spent 12 days in parallel training on 6 Nvidia GeForce RTX3090 GPUs. The maximum training epoch was 2000. The optimization did not stop until the validation loss no longer decreased”.
Edits:
Page9, Lines214-223:
“The acoustic pathway, implemented through a bi-directional LSTM neural adaptor architecture (Fig. 1B), specializes in reconstructing fundamental acoustic properties of speech. This module directly processes neural recordings to generate precise time-frequency representations, focusing on preserving speaker-specific spectral characteristics like formant structures, harmonic patterns, and spectral envelope details. Quantitative evaluation confirms its core competency: achieving a mel-spectrogram R² of 0.793 ± 0.016 (Fig. 3B) demonstrates remarkable fidelity in reconstructing acoustic microstructure. This performance level is statistically indistinguishable from original speech degraded by 0dB additive noise (0.771 ± 0.014, p = 0.242, one-sided t-test). We chose a bidirectional LSTM architecture for this adaptor because its recurrent nature is particularly suited to modeling the fine-grained, short- to medium-range temporal dependencies (e.g., within and between phonemes and syllables) that are critical for acoustic fidelity. An ablation study comparing LSTM against Transformer-based adaptors for this task confirmed that LSTMs yielded superior mel-spectrogram reconstruction fidelity (higher R²), as detailed in Table S1, likely by avoiding the oversmoothing of spectrotemporal details sometimes induced by the strong global context modeling of Transformers”.
“To confirm that the acoustic pathway’s output is causally dependent on the neural signal rather than the generative prior of the HiFi-GAN, we performed a control analysis in which portions of the input ECoG recording were replaced with Gaussian noise. When either the first half, second half, or the entirety of the neural input was replaced by noise, the melspectrogram R² of the reconstructed speech dropped markedly, corresponding to the corrupted segment (Fig. S5). This demonstrates that the reconstruction is temporally locked to the specific neural input and that the model does not ‘hallucinate’ spectrotemporal structure from noise. These results validate that the acoustic pathway performs genuine, input-sensitive neural decoding”
(2) For BCI applications, the decoding speed matters. Please report the model's inference speed. Additionally, the authors might also consider reporting cross-participant generalization and how the accuracy changes with recording duration.
We thank the reviewer for these practical and important suggestions.
Inference Speed: You are absolutely right. On our hardware (single NVIDIA GeForce RTX 3090 GPU), the current pipeline has an inference time that is longer than the duration of the target speech segment. The primary bottlenecks are the sequential processing in the autoregressive linguistic adaptor and the high-resolution waveform generation in CosyVoice 2.0. This latency currently limits real-time application. We have now added this in the Discussion acknowledging this limitation and stating that future work must focus on architectural optimizations (e.g., non-autoregressive models, lighter vocoders) and potential hardware acceleration to achieve real-time performance, which is critical for a practical BCI.
Cross-Participant Generalization: We agree that this is a key question for scalability. Our framework already addresses part of the cross-participant generalization challenge through the use of pre-trained generative modules (HiFi-GAN, Parler-TTS, CosyVoice 2.0), which are pretrained on large corpora and shared across all participants. Only a small fraction of the model, the lightweight neural adaptors, is subject-specific and requires a small amount of supervised fine-tuning (~20 minutes per participant). This design significantly reduces the per-subject calibration burden. As the reviewer implies, the ultimate goal would be pure zero-shot generalization. A promising future direction is to further improve cross-participant alignment by learning a shared neural feature encoder (e.g., using contrastive or self-supervised learning on aggregated ECoG data) before the personalized adaptors. We have added a paragraph in the Discussion outlining this as a major next step to enhance the framework’s practicality and further reduce calibration time.
Accuracy vs. Recording Duration: Thank you for this insightful suggestion. To systematically evaluate the impact of training data volume on performance, we have conducted additional experiments using progressively smaller subsets of the full training set (i.e., 25%, 50%, and 75%). When we used more than 50% of the training data, performance degrades gracefully rather than catastrophically with less data, which is promising for potential clinical scenarios where data collection may be limited. We add another figure (Fig. S4) to demonstrate this.
Edits:
Pages 15-16, Lines 427-452:
“There are several limitations in our study. The quality of the re-synthesized speech heavily relies on the performance of the generative model, indicating that future work should focus on refining and enhancing these models. Currently, our study utilized English speech sentences as input stimuli, and the performance of the system in other languages remains to be evaluated. Regarding signal modality and experimental methods, the clinical setting restricts us to collecting data during brief periods of awake neurosurgeries, which limits the amount of usable neural activity recordings. Overcoming this time constraint could facilitate the acquisition of larger datasets, thereby contributing to the re-synthesis of higher-quality natural speech. Furthermore, the inference speed of the current pipeline presents a challenge for real-time applications. On our hardware (a single NVIDIA GeForce RTX 3090 GPU), synthesizing speech from neural data takes approximately two to three times longer than the duration of the target speech segment itself. This latency is primarily attributed to the sequential processing in the autoregressive linguistic adaptor and the computationally intensive high-fidelity waveform generation in the vocoder (CosyVoice 2.0). While the current study focuses on offline reconstruction accuracy, achieving real-time or faster-than-real-time inference is a critical engineering goal for viable speech BCI prosthetics. Future work must therefore prioritize architectural optimizations, such as exploring non-autoregressive decoding strategies and more efficient neural vocoders, alongside potential hardware acceleration. Additionally, exploring non-invasive methods represents another frontier; with the accumulation of more data and the development of more powerful generative models, it may become feasible to achieve effective non-invasive neural decoding for speech resynthesis. Moreover, while our framework adopts specialized architectures (LSTM and Transformer) for distinct decoding tasks, an alternative approach is to employ a unified multimodal large language model (LLM) capable of joint acoustic-linguistic processing. Finally, the current framework requires training participant-specific adaptors, which limits its immediate applicability for new users. A critical next step is to develop methods that learn a shared, cross-participant neural feature encoder, for instance, by applying contrastive or selfsupervised learning techniques to larger aggregated ECoG datasets. Such an encoder could extract subject-invariant neural representations of speech, serving as a robust initialization before lightweight, personalized fine-tuning. This approach would dramatically reduce the amount of per-subject calibration data and time required, enhancing the practicality and scalability of the decoding framework for real-world BCI applications”
“In summary, our dual-path framework achieves high speech reconstruction quality by strategically integrating language models for lexical precision and voice cloning for vocal identity preservation, yielding a 37.4% improvement in MOS scores over conventional methods. This approach enables high-fidelity, sentence-level speech synthesis directly from cortical recordings while maintaining speaker-specific vocal characteristics. Despite current constraints in generative model dependency and intraoperative data collection, our work establishes a new foundation for neural decoding development. Future efforts should prioritize: (1) refining few-shot adaptation techniques, (2) developing non-invasive implementations, (3) expanding to dynamic dialogue contexts, and (4) cross-subject applications. The convergence of neurophysiological data with multimodal foundation models promises transformative advances, not only revolutionizing speech BCIs but potentially extending to cognitive prosthetics for memory augmentation and emotional communication. Ultimately, this paradigm will deepen our understanding of neural speech processing while creating clinically viable communication solutions for those with severe speech impairments”
Edits:
add another section in Methods: Page 22, Line 681:
“Ablation study on training data volume”.
“To assess the impact of training data quantity on decoding performance, we conducted an additional ablation experiment. For each participant, we created subsets of the full training set corresponding to 25%, 50%, and 75% of the original data by random sampling while preserving the temporal continuity of speech segments. Personalized acoustic and linguistic adaptors were then independently trained from scratch on each subset, following the identical architecture and optimization procedures described above. All other components of the pipeline, including the frozen pre-trained generators (HiFi-GAN, Parler-TTS) and the CosyVoice 2.0 voice cloner, remained unchanged. Performance metrics (mel-spectrogram R², WER, PER) were evaluated on the same held-out test set for all data conditions. The results (Fig. S4) demonstrate that when more than 50% of the training data is utilized, performance degrades gracefully rather than catastrophically, which is a promising indicator for clinical applications with limited data collection time”.
(3) I appreciate that the author compared their model with the MLP, but more comparisons with previous models could be beneficial. Even simply summarizing some measures of earlier models, such as neural recording duration, WER, PER, etc., is ok.
Thank you for this suggestion. We agree that a broader comparison contextualizes our contribution. We also acknowledge that given the differences in tasks, signal modality, and amount of data, it’s hard to draw a direct comparison. The main goal of this table is to summarize major studies, their methods and results for reference. We have now added a new Supplementary Table that summarizes key metrics from several recent and relevant studies in neural speech decoding. The table includes:
- Neural modality (e.g., ECoG, sEEG, Utah array)
- Approximate amount of neural data used per subject for decoder training
- Primary task (perception vs. production)
-Decoding framework
-Reported Word Error Rate (WER) or similar intelligibility metrics (e.g., Character Error Rate)
-Reported acoustic fidelity metrics (if available, e.g., spectral correlation)
This table includes works such as Anumanchipalli et al., Nature 2019; Akbari et al., Sci Rep 2019; Willett et al., Nature 2023; and other contemporary studies. The table clearly shows that our dual-path framework achieves a highly competitive WER (~18.9%) using an exceptionally short neural recording duration (~20 minutes), highlighting its data efficiency. We will refer to this table in the revised manuscript.
Edits:
Page 14, Lines 374-376:
“Our framework establishes a framework for speech decoding by outperforming prior acousticonly or linguistic-only approaches (Table S3) through integrated pretraining-powered acoustic and linguistic decoding”
Minor:
(1) Some processes might be described earlier, for example, the electrodes were selected, and the model was trained separately for each participant. That information was only described in the Method section now.
Thank you for catching these. We have revised the manuscript accordingly.
Edits:
Page4, Lines 89-95:
“Our proposed framework for reconstructing speech from intracranial neural recordings is designed around two complementary decoding pathways: an acoustic pathway focused on preserving low-level spectral and prosodic detail, and a linguistic pathway focused on decoding high-level textual and semantic content. For every participant, our adaptor is independently trained, and we select speech-responsive electrodes (selection details are provided in the Methods section) to tailor the model to individual neural patterns. These two streams are ultimately fused to synthesize speech that is both natural-sounding and intelligible, capturing the full richness of spoken language. Fig. 1 provides a schematic overview of this dual-pathway architecture”
(2) Line 224-228 Figure 2 should be Figure 3
Thank you for catching these. We have revised the manuscript accordingly. The information about participant-specific training and electrode selection is now briefly mentioned in the "Results" overview (section: "The acoustic and linguistic performance..."), with details still in the Methods. The figure reference error has been corrected.
Edits:
Page7, Lines 224-228:
“However, exclusive reliance on acoustic reconstruction reveals fundamental limitations. Despite excellent spectral fidelity, the pathway produces critically impaired linguistic intelligibility. At the word level, intelligibility remains unacceptably low (WER = 74.6 ± 5.5%, Fig. 3D), while MOS and phoneme-level precision fares only marginally better (MOS = 2.878 ± 0.205, Fig. 3C; PER = 28.1 ± 2.2%, Fig. 3E)”.
(3) For Figure 3C, why does the MOS seem to be higher for baseline 3 than for ground truth? Is this significant?
This is a detailed observation. Baseline 3 achieves a mean opinion score of 4.822 ± 0.086 (Fig. 3C), significantly surpassing even the original human speech (4.234 ± 0.097, p = 6.674×10⁻33). We believe this trend arises because the TIMIT corpus, recorded decades ago, contains inherent acoustic noise and relatively lower fidelity compared to modern speech corpus. In contrast, the Parler-TTS model used in Baseline 3 is trained on massive, highquality, clean speech datasets. Therefore, it synthesizes speech that listeners may subjectively perceive as "cleaner" or more pleasant, even if it lacks the original speaker's voice. Crucially, as the reviewer implies, our final integrated output does not aim to maximize MOS at the cost of speaker identity; it successfully balances this subjective quality with high intelligibility and restored acoustic fidelity. We will add a brief note explaining this possible reason in the caption of Figure 3C.
Edits:
Page9, Lines 235-245:
“The linguistic pathway reconstructs high-intelligibility, higher-level linguistic information”
“The linguistic pathway, instantiated through a pre-trained TTS generator (Fig. 1B), excels in reconstructing abstract linguistic representations. This module operates at the phonological and lexical levels, converting discrete word tokens into continuous speech signals while preserving prosodic contours, syllable boundaries, and phonetic sequences. It achieves a mean opinion score of 4.822 ± 0.086 (Fig. 3C) - significantly surpassing even the original human speech (4.234 ± 0.097, p = 6.674×10⁻33) in that the TIMIT corpus, recorded decades ago, contains inherent acoustic noise and relatively lower fidelity compared to modern speech corpus. Complementing this perceptual quality, objective intelligibility metrics confirm outstanding performance: WER reaches 17.7 ± 3.2%, with PER at 11.0 ± 2.3%”.
Reference
(1) Chen M X, Firat O, Bapna A, et al. The best of both worlds: Combining recent advances in neural machine translation[C]//Proceedings of the 56th annual meeting of the association for computational linguistics (Volume 1: Long papers). 2018: 76-86
(2) P. Chen et al. Do Self-Supervised Speech and Language Models Extract Similar Representations as Human Brain? 2024 IEEE International Conference on Acoustics, Speech and Signal Processing (ICASSP 2024). 2225–2229 (2024).
(3) H. Akbari, B. Khalighinejad, J. L. Herrero, A. D. Mehta, N. Mesgarani, Towards reconstructing intelligible speech from the human auditory cortex. Scientific reports 9, 874 (2019).
(4) S. Komeiji et al., Transformer-Based Estimation of Spoken Sentences Using Electrocorticography. Int Conf Acoust Spee, 1311-1315 (2022).
(5) L. Bellier et al., Music can be reconstructed from human auditory cortex activity using nonlinear decoding models. Plos Biology 21, (2023).
(6) F. R. Willett et al., A high-performance speech neuroprosthesis. Nature 620, (2023).
(7) S. L. Metzger et al., A high-performance neuroprosthesis for speech decoding and avatar control. Nature 620, 1037-1046 (2023).
(8) J. W. Li et al., Neural2speech: A Transfer Learning Framework for NeuralDriven Speech Reconstruction. Int Conf Acoust Spee, 2200-2204 (2024).
(9) X. P. Chen et al., A neural speech decoding framework leveraging deep learning and speech synthesis. Nat Mach Intell 6, (2024).
(10) M. Wairagkar et al., An instantaneous voice-synthesis neuroprosthesis. Nature, (2025).
“There was a canoe of men, my husband, Hat, among them. They passed by Spirit Island. Saw the dead. Saw you.” “So it was they who brought me back?” “No,” said Tallow, simply. “They saw me,” said Omakakiins, making sure, “but they didn’t save me.” Old Tallow shook her head in the dusk. Then she shook herself all over, just like one of her dogs. “Hay’! My husband, Hat, was a fearful fool. I was going to put his things out the door, anyway. When he told me that he and the other men had seen you, and gone on! Leaving you!” Old Tallow’s voice took fury. “I made him leave. ‘Don’t show me your face, ever!’ I said to him. And then I took my canoe over to that island.” The wintery trees clacked their branches, ticking and moaning. The wind picked up often, at dusk, on the island. Omakakiins could feel in her heart what it was like for that baby, for herself, all alone with the dead, with her mother, walking from those she loved as though walking stone to stone. Somehow, deep inside, she remembered. “It was spring,” she said softly. “Ziigwan.” “Owah!” said Old Tallow in surprise, peering closely at her. “You remember!” “The birds,” said Omakakiins, “I remember the birds, the songs of the birds.” “Howah!” Tallow was excited. “I had forgotten, myself. There were birds on that island, singing so prettily, so loudly! Too small to eat. The little birds with white throats, those sweet spring cries. Eya’! My girl, you remember them.” “They kept me alive,” said Omakakiins, to herself, not quite understanding her own words. “I remember their song because their song was my comfort, my lullaby. They kept me alive.”
Now we know its 100 percent confirmed that Omakakiins was the girl in the beginning
Reviewer #2 (Public review):
Summary:
Calcium ions play a key role in synaptic transmission and plasticity. To improve calcium measurements at synaptic terminals, previous studies have targeted genetically encoded calcium indicators (GECIs) to pre- and postsynaptic locations. Here, Chen et al. improve these constructs by incorporating the latest GCaMP8 sensors and a stable red fluorescent protein to enable ratiometric measurements. Extensive characterization in the Drosophila neuromuscular junction demonstrates favorable performance of these new constructs relative to previous genetically encoded and synthetic calcium indicators in reporting synaptic calcium events. In addition, they develop a new analysis platform, 'CaFire', to facilitate automated quantification. Impressively, by positioning postsynaptic GCaMP8m near glutamate receptors, the authors show that their sensors can report miniature synaptic events with speed and sensitivity approaching that of intracellular electrophysiological recordings. These new sensors and the analysis platform provide a valuable tool for resolving synaptic events using all-optical methods.
Strength:
The authors present rigorous characterization of their sensors using well-established assays. They employ immunostaining and super-resolution STED microscopy to confirm correct subcellular targeting. Additionally, they quantify response amplitude, rise and decay kinetics, and provide side-by-side comparisons with earlier-generation GECIs and synthetic dyes. Importantly, they show that the new sensors can reproduce known differences in evoked Ca²⁺ responses between distinct nerve terminals. Finally, they present what appears to be the first simultaneous calcium imaging and intracellular mEPSP recording to directly assess the sensitivity of different sensors in detecting individual miniature synaptic events.
The revised version contains extensive new data and clarification that fully addressed my previous concerns. In particular, I appreciate the side-by-side comparison with synthetic calcium indicator OGB-1 and the cytosolic version of GCaMP8m (now presented in Figure 3), which compellingly supports the favorable performance of their new sensors.
Weakness:
I have only one remaining suggestion about the precision of terminology, which I do think is important. The authors clarified in the revision that they "define SNR operationally as the fractional fluorescence change (ΔF/F).", and basically present ΔF/F values whenever they mentioned about SNR. However, if the intention is to present ΔF/F comparisons, I would strongly suggest replacing all mentions of "SNR" in the manuscript with "ΔF/F" or "fractional/relative fluorescence change".
SNR and ΔF/F are fundamentally different quantities, each with a well-defined and distinct meaning: SNR measures fluorescence change relative to baseline fluctuations (noise), whereas ΔF/F measures fluorescence change relative to baseline fluorescence (F₀). While larger ΔF/F values often correlate with improved detectability, SNR also depends on additional factors such as indicator brightness, light collection efficiency, camera noise, and the stability of the experimental preparation. Referring to ΔF/F as SNR can therefore be misleading and may cause confusion for readers, particularly those from quantitative imaging backgrounds. Clarifying the terminology by consistently using ΔF/F would improve conceptual accuracy without requiring any reanalysis of the data.
Author response:
The following is the authors’ response to the original reviews.
Reviewer #1
Chen et al. engineered and characterized a suite of next-generation GECIs for the Drosophila NMJ that allow for the visualization of calcium dynamics within the presynaptic compartment, at presynaptic active zones, and in the postsynaptic compartment. These GECIs include ratiometric presynaptic Scar8m (targeted to synaptic vesicles), ratiometric active zone localized Bar8f (targeted to the scaffold molecule BRP), and postsynaptic SynapGCaMP8m. The authors demonstrate that these new indicators are a large improvement on the widely used GCaMP6 and GCaMP7 series GECIs, with increased speed and sensitivity. They show that presynaptic Scar8m accurately captures presynaptic calcium dynamics with superior sensitivity to the GCaMP6 and GCaMP7 series and with similar kinetics to chemical dyes. The active-zone targeted Bar8f sensor was assessed for the ability to detect release-site-specific nanodomain changes, but the authors concluded that this sensor is still too slow to accurately do so. Lastly, the use of postsynaptic SynapGCaMP8m was shown to enable the detection of quantal events with similar resolution to electrophysiological recordings. Finally, the authors developed a Python-based analysis software, CaFire, that enables automated quantification of evoked and spontaneous calcium signals. These tools will greatly expand our ability to detect activity at individual synapses without the need for chemical dyes or electrophysiology.
We thank this Reviewer for the overall positive assessment of our manuscript and for the incisive comments.
(1) The role of Excel in the pipeline could be more clearly explained. Lines 182-187 could be better worded to indicate that CaFire provides analysis downstream of intensity detection in ImageJ. Moreover, the data type of the exported data, such as .csv or .xlsx, should be indicated instead of 'export to graphical program such as Microsoft Excel'.
We thank the Reviewer for these comments, many of which were shared by the other reviewers. In response, we have now 1) more clearly explained the role of Excel in the CaFire pipeline (lines 677-681), 2) revised the wording in lines 676-679 to indicate that CaFire provides analysis downsteam of intensity detection in ImageJ, and 3) Clarified the exported data type to Excel (lines 677-681). These efforts have improved the clarity and readability of the CaFire analysis pipeline.
(2) In Figure 2A, the 'Excel' step should either be deleted or included as 'data validation' as ImageJ exports don't require MS Excel or any specific software to be analysed. (Also, the graphic used to depict Excel software in Figure 2A is confusing.)
We thank the reviewer for this helpful suggestion. In the Fig. 2A, we have changed the Excel portion and clarified the processing steps in the revised methods. Specifically, we now indicate that ROIs are first selected in Fiji/ImageJ and analyzed to obtain time-series data containing both the time information and the corresponding imaging mean intensity values. These data are then exported to a spreadsheet file (e.g., Excel), which is used to organize the output before being imported into CaFire for subsequent analysis. These changes can be found in the Fig. 2A and methods (lines 676-681).
(3) Figure 2B should include the 'Partition Specification' window (as shown on the GitHub) as well as the threshold selection to give the readers a better understanding of how the tool works.
We absolutely agree with this comment, and have made the suggested changes to the Fig. 2B. In particular, we have replaced the software interface panels and now include windows illustrating the Load File, Peak Detection, and Partition functions. These updated screenshots provide a clearer view of how CaFire is used to load the data, detect events, and perform partition specification for subsequent analysis. We agree these changes will give the readers a better understanding of how the tool works, and we thank the reviewer for this comment.
(4) The presentation of data is well organized throughout the paper. However, in Figure 6C, it is unclear how the heatmaps represent the spatiotemporal fluorescence dynamics of each indicator. Does the signal correspond to a line drawn across the ROI shown in Figure 6B? If so, this should be indicated.
We apologize that the heatmaps were unclear in Fig panel 6C (Fig. 7C in the Current revision). Each heatmap is derived from a one-pixel-wide vertical line within a miniature-event ROI. These heatmaps correspond to the fluorescence change in the indicated SynapGCaMP variant of individual quantal events and their traces shown in Fig. 7C, with a representative image of the baseline and peak fluorescence shown in Fig. 7B. Specifically, we have added the following to the revised Fig. 7C legend:
The corresponding heatmaps below were generated from a single vertical line extracted from a representative miniature-event ROI, and visualize the spatiotemporal fluorescence dynamics (ΔF/F) along that line over time.
(5) In Figure 6D, the addition of non-matched electrophysiology recordings is confusing. Maybe add "at different time points" to the end of the 6D legend, or consider removing the electrophysiology trace from Figure 6D and referring the reader to the traces in Figure 7A for comparison (considering the same point is made more rigorously in Figure 7).
This is a good point, one shared with another reviewer. We apologize this was not clear, and have now revised this part of the figure to remove the electrophysiological traces in what is now Fig. 7 while keeping the paired ones still in what is now Fig. 8A as suggested by the reviewer. We agree this helps to clarify the quantal calcium transients.
(6) In GitHub, an example ImageJ Script for analyzing the images and creating the inputs for CaFire would be helpful to ensure formatting compatibility, especially given potential variability when exporting intensity information for two channels. In the Usage Guide, more information would be helpful, such as how to select ∆R/R, ideally with screenshots of the application being used to analyze example data for both single-channel and two-channel images.
We agree that additional details added to the GitHub would be helpful for users of CaFire. In response, we have now added the following improvements to the GitHub site:
- ImageJ operation screenshots
Step-by-step illustrations of ROI drawing and Multi Measure extraction.
- Example Excel file with time and intensity values
Demonstrates the required data format for CaFire import, including proper headers.
- CaFire loading screenshots for single-channel and dual-channel imaging
Shows how to import GCaMP into Channel 1 and mScarlet into Channel 2.
- Peak Detection and Partition setting screenshots
Visual examples of automatic peak detection, manual correction, and trace partitioning.
- Instructions for ROI Extraction and CaFire Analysis
A written guide describing the full workflow from ROI selection to CaFire data export.
These changes have improved the usability and accessibility of CaFire, and we thank the reviewer for these points.
Reviewer #2
Calcium ions play a key role in synaptic transmission and plasticity. To improve calcium measurements at synaptic terminals, previous studies have targeted genetically encoded calcium indicators (GECIs) to pre- and postsynaptic locations. Here, Chen et al. improve these constructs by incorporating the latest GCaMP8 sensors and a stable red fluorescent protein to enable ratiometric measurements. In addition, they develop a new analysis platform, 'CaFire', to facilitate automated quantification. Using these tools, the authors demonstrate favorable properties of their sensors relative to earlier constructs. Impressively, by positioning postsynaptic GCaMP8m near glutamate receptors, they show that their sensors can report miniature synaptic events with speed and sensitivity approaching that of intracellular electrophysiological recordings. These new sensors and the analysis platform provide a valuable tool for resolving synaptic events using all-optical methods.
We thank the Reviewer for their overall positive evaluation and comments.
Major comments:
(1) While the authors rigorously compared the response amplitude, rise, and decay kinetics of several sensors, key parameters like brightness and photobleaching rates are not reported. I feel that including this information is important as synaptically tethered sensors, compared to freely diffusible cytosolic indicators, can be especially prone to photobleaching, particularly under the high-intensity illumination and high-magnification conditions required for synaptic imaging. Quantifying baseline brightness and photobleaching rates would add valuable information for researchers intending to adopt these tools, especially in the context of prolonged or high-speed imaging experiments.
This is a good point made by the reviewer, and one we agree will be useful for researchers to be aware. First, it is important to note that the photobleaching and brightness of the sensors will vary depending on the nature of the user’s imaging equipment, which can vary significantly between widefield microscopes (with various LED or halogen light sources for illumination), laser scanning systems (e.g., line scans with confocal systems), or area scanning systems using resonant scanners (as we use in our current study). Under the same imaging settings, GCaMP8f and 8m exhibit comparable baseline fluorescence, whereas GCaMP6f and 6s are noticeably dimmer; because our aim is to assess each reagent’s potential under optimal conditions, we routinely adjust excitation/camera parameters before acquisition to place baseline fluorescence in an appropriate dynamic range. As an important addition to this study, motivated by the reviewer’s comments above, we now directly compare neuronal cytosolic GCaMP8m expression with our Scar8m sensor, showing higher sensitivity with Scar8m (now shown in the new Fig. 3F-H).
Regarding photobleaching, GCaMP signals are generally stable, while mScarlet is more prone to bleaching: in presynaptic area scanned confocal recordings, the mScarlet channel drops by ~15% over 15 secs, whereas GCaMP6s/8f/8m show no obvious bleaching over the same window (lines 549-553). In contrast, presynaptic widefield imaging using an LED system (CCD), GCaMP8f shows ~8% loss over 15 secs (lines 610-611). Similarly, for postsynaptic SynapGCaMP6f/8f/8m, confocal resonant area scans show no obvious bleaching over 60 secs, while widefield shows ~2–5% bleaching over 60 secs (lines 634-638). Finally, in active-zone/BRP calcium imaging (confocal), mScarlet again bleaches by ~15% over 15 s, while GCaMP8f/8m show no obvious bleaching. The mScarlet-channel bleaching can be corrected in Huygens SVI (Bleaching correction or via the Deconvolution Wizard), whereas we avoid applying bleaching correction to the green GCaMP channel when no clear decay is present to prevent introducing artifacts. This information is now added to the methods (lines 548-553).
(2) In several places, the authors compare the performance of their sensors with synthetic calcium dyes, but these comparisons are based on literature values rather than on side-by-side measurements in the same preparation. Given differences in imaging conditions across studies (e.g., illumination, camera sensitivity, and noise), parameters like indicator brightness, SNR, and photobleaching are difficult to compare meaningfully. Additionally, the limited frame rate used in the present study may preclude accurate assessment of rise times relative to fast chemical dyes. These issues weaken the claim made in the abstract that "...a ratiometric presynaptic GCaMP8m sensor accurately captures .. Ca²⁺ changes with superior sensitivity and similar kinetics compared to chemical dyes." The authors should clearly acknowledge these limitations and soften their conclusions. A direct comparison in the same system, if feasible, would greatly strengthen the manuscript.
We absolutely agree with these points made the reviewer, and have made a concerted effort to address them through the following:
We have now directly compared presynaptic calcium responses on the same imaging system using the chemical dye Oregon Green Bapta-1 (OGB-1), one of the primary synthetic calcium indicators used in our field. These experiments reveal that Scar8f exhibits markedly faster kinetics and an improved signal-to-noise ratio compared to OGB-1, with higher peak fluorescence responses (Scar8f: 0.32, OGB-1: 0.23). The rise time constants of the two indicators are comparable (both ~3 msecs), whereas the decay of Scar8f is faster than that of OGB-1 (Scar8f: ~40, OGB-1: ~60), indicating more rapid signal recovery. These results now directly demonstrate the superiority of the new GCaMP8 sensors we have engineered over conventional synthetic dyes, and are now presented in the new Fig. 3A-E of the manuscript.
We agree with the reviewer that, in the original submission, the relatively slow resonant area scans (~115 fps) limited the temporal resolution of our rise time measurements. To address this, we have re-measured the rise time using higher frame-rate line scans (kHz). For Scar8f, the rise time constant was 6.736 msec at ~115 fps resonant area scanned, but shortened to 2.893 msec when imaged at ~303 fps, indicating that the original protocol underestimated the true kinetics. In addition, for Bar8m, area scans at ~118 fps yielded a rise time constant of 9.019 msec, whereas line scans at ~1085 fps reduced the rise time constant to 3.230 msec. These new measurements are now incorporated into the manuscript ( Figs. 3,4, and 6) to more accurately reflect the fast kinetics of these indicators.
(3) The authors state that their indicators can now achieve measurements previously attainable with chemical dyes and electrophysiology. I encourage the authors to also consider how their tools might enable new measurements beyond what these traditional techniques allow. For example, while electrophysiology can detect summed mEPSPs across synapses, imaging could go a step further by spatially resolving the synaptic origin of individual mEPSP events. One could, for instance, image MN-Ib and MN-Is simultaneously without silencing either input, and detect mEPSP events specific to each synapse. This would enable synapse-specific mapping of quantal events - something electrophysiology alone cannot provide. Demonstrating even a proof-of-principle along these lines could highlight the unique advantages of the new tools by showing that they not only match previous methods but also enable new types of measurements.
These are excellent points raised by the reviewer. In response, we have done the following:
We have now included a supplemental video as “proof-of-principle” data showing simultaneous imaging of SynapGCaMP8m quantal events at both MN-Is and -Ib, demonstrating that synapse-specific spatial mapping of quantal events can be obtained with this tool (see new Supplemental Video 1).
We have also included an additional discussion of the potential and limitations of these tools for new measurements beyond conventional approaches. This discussion is now presented in lines 419-421 in the manuscript.
(4) For ratiometric measurements, it is important to estimate and subtract background signals in each channel. Without this correction, the computed ratio may be skewed, as background adds an offset to both channels and can distort the ratio. However, it is not clear from the Methods section whether, or how, background fluorescence was measured and subtracted.
This is a good point, and we agree more clarification about how ratiometric measurements were made is needed. In response, we have now added the following to the Methods section (lines 548-568):
Time-lapse videos were stabilized and bleach-corrected prior to analysis, which visibly reduced frame-toframe motion and intensity drift. In the presynaptic and active-zone mScarlet channel, a bleaching factor of ~1.15 was observed during the 15 sec recording. This bleaching can be corrected using the “Bleaching correction” tool in Huygens SVI. For presynaptic and active-zone GCaMP signals, there was minimal bleaching over these short imaging periods. Therefore, the bleaching correction step for GCaMP was skipped. Both GCaMP and mScarlet channels were processed using the default settings in the Huygens SVI “Deconvolution Wizard” (with the exception of the bleaching correction option). Deconvolution was performed using the CMLE algorithm with the Huygens default stopping criterion and a maximum of 30 iterations, such that the algorithm either converged earlier or, if convergence was not reached, was terminated at this 30iteration limit; no other iteration settings were used across the GCaMP series. ROIs were drawn on the processed images using Fiji ImageJ software, and mean fluorescence time courses were extracted for the GCaMP and mScarlet channels, yielding F<sub>GCaMP</sub>(t) and F<sub>mScarlet</sub>(t). F(t)s were imported into CaFire with GCaMP assigned to Channel #1 (signal; required) and mScarlet to Channel #2 (baseline/reference; optional). If desired, the mScarlet signal could be smoothed in CaFire using a user-specified moving-average window to reduce high-frequency noise. In CaFire’s ΔR/R mode, the per-frame ratio was computed as R(t)=F<sub>GCaMP</sub>(t) and F<sub>mScarlet</sub>(t); a baseline ratio R0 was estimated from the pre-stimulus period, and the final response was reported as ΔR/R(t)=[R(t)−R0]/R0, which normalizes GCaMP signals to the co-expressed mScarlet reference and thereby reduces variability arising from differences in sensor expression level or illumination across AZs.
(5) At line 212, the authors claim "... GCaMP8m showing 345.7% higher SNR over GCaMP6s....(Fig. 3D and E) ", yet the cited figure panels do not present any SNR quantification. Figures 3D and E only show response amplitudes and kinetics, which are distinct from SNR. The methods section also does not describe details for how SNR was defined or computed.
This is another good point. We define SNR operationally as the fractional fluorescence change (ΔF/F). Traces were processed with CaFire, which estimates a per-frame baseline F<sub>0</sub>(t) with a user-configurable sliding window and percentile. In the Load File panel, users can specify both the length of the moving baseline window and the desired percentile; the default settings are a 50-point window and the 30th percentile, representing a 101-point window centered on each time point (previous 50 to next 50 samples) and took the lower 30% of values within that window to estimate F<sub>0</sub>(t). The signal was then computed as ΔF/F=[F(t)−F0(t)]/F0(t). This ΔF/F value is what we report as SNR throughout the manuscript and is now discussed explicitly in the revised methods (lines 686-693).
(6) Lines 285-287 "As expected, summed ΔF values scaled strongly and positively with AZ size (Fig. 5F), reflecting a greater number of Cav2 channels at larger AZs". I am not sure about this conclusion. A positive correlation between summed ΔF values and AZ size could simply reflect more GCaMP molecules in larger AZs, which would give rise to larger total fluorescence change even at a given level of calcium increase.
The reviewer makes a good point, one that we agree should be clarified. The reviewer is indeed correct that larger active zones should have more abundant BRP protein, which in turn will lead to a higher abundance of the Bar8f sensor, which should lead to a higher GCaMP response simply by having more of this sensor. However, the inclusion of the ratiometric mScarlet protein should normalize the response accurately, correcting for this confound, in which the higher abundance of GCaMP should be offset (normalized) by the equally (stoichiometric) higher abundance of mScarlet. Therefore, when the ∆R/R is calculated, the differences in GCaMP abundance at each AZ should be corrected for the ratiometric analysis. We now use an improved BRP::mScarlet3::GCaMP8m (Bar8m) and compute ΔR/R with R(t)=F<sub>GCaMP8m</sub>/F<sub>mScarlet3</sub>. ROIs were drawn over individual AZs (Fig. 6B). CaFire estimated R0 with a sliding 101-point window using the lowest 10% of values, and responses were reported as ΔR/R=[R−R0]/R0. Area-scan examples (118 fps) show robust ΔR/R transients (peaks ≈1.90 and 3.28; tau rise ≈9.0–9.3 ms; Fig. 6C, middle).
We have now made these points more clearly in the manuscript (lines 700-704) and moved the Bar8f intensity vs active zone size data to Table S1. Together, these revisions improve the indicator-abundance confound (via mScarlet normalization).
(6) Lines 313-314: "SynapGCaMP quantal signals appeared to qualitatively reflect the same events measured with electrophysiological recordings (Fig. 6D)." This statement is quite confusing. In Figure 6D, the corresponding calcium and ephys traces look completely different and appear to reflect distinct sets of events. It was only after reading Figure 7 that I realized the traces shown in Figure 6D might not have been recorded simultaneously. The authors should clarify this point.
Yes, we absolutely agree with this point, one shared by Reviewer 1. In response, we have removed the electrophysiological traces in Fig. 6 to clarify that just the calcium responses are shown, and save the direct comparison for the Fig. 7 data (now revised Fig. 8).
(8) Lines 310-313: "SynapGCaMP8m .... striking an optimal balance between speed and sensitivity", and Lines 314-316: "We conclude that SynapGCaMP8m is an optimal indicator to measure quantal transmission events at the synapse." Statements like these are subjective. In the authors' own comparison, GCaMP8m is significantly slower than GCaMP8f (at least in terms of decay time), despite having a moderately higher response amplitude. It is therefore unclear why GCaMP8m is considered 'optimal'. The authors should clarify this point or explain their rationale for prioritizing response amplitude over speed in the context of their application.
This is another good point that we agree with, as the “optimal” sensor will of course depend on the user’s objectives. Hence, we used the term “an optimal sensor” to indicate it is what we believed to be the best one for our own uses. However, this point should be clarified and better discussed. In response, we have revised the relevant sections of the manuscript to better define why we chose the 8m sensors to strike an optimal balance of speed and sensitivity for our uses, and go on to discuss situations in which other sensor variants might be better suited. These are now presented in lines 223-236 in the revised manuscript, and we thank the reviewer for making these comments, which have improved our study.
Minor comments
(1) Please include the following information in the Methods section:
(a) For Figures 3 and 4, specify how action potentials were evoked. What type of electrodes were used, where were they placed, and what amount of current or voltage was applied?
We apologize for neglecting to include this information in the original submission. We have now added this information to the revised Methods section (lines 537-543).
(b) For imaging experiments, provide information on the filter sets used for each imaging channel, and describe how acquisition was alternated or synchronized between the green and red channels in ratiometric measurements. Additionally, please report the typical illumination intensity (in mW/mm²) for each experimental condition.
We thank the reviewer for this helpful comment. We have now added detailed information about the imaging configuration to the Methods (lines 512-528) with the following:
Ca2+ imaging was conducted using a Nikon A1R resonant scanning confocal microscope equipped with a 60x/1.0 NA water-immersion objective (refractive index 1.33). GCaMP signals were acquired using the FITC/GFP channel (488-nm laser excitation; emission collected with a 525/50-nm band-pass filter), and mScarlet/mCherry signals were acquired using the TRITC/mCherry channel (561-nm laser excitation; emission collected with a 595/50-nm band-pass filter). ROIs focused on terminal boutons of MN-Ib or -Is motor neurons. For both channels, the confocal pinhole was set to a fixed diameter of 117.5 µm (approximately three Airy units under these conditions), which increases signal collection while maintaining adequate optical sectioning. Images were acquired as 256 × 64 pixel frames (two 12-bit channels) using bidirectional resonant scanning at a frame rate of ~118 frames/s; the scan zoom in NIS-Elements was adjusted so that this field of view encompassed the entire neuromuscular junction and was kept constant across experiments. In ratiometric recordings, the 488-nm (GCaMP) and 561-nm (mScarlet) channels were acquired in a sequential dual-channel mode using the same bidirectional resonant scan settings: for each time point, a frame was first collected in the green channel and then immediately in the red channel, introducing a small, fixed frame-to-frame temporal offset while preserving matched spatial sampling of the two channels.
Directly measuring the absolute laser power at the specimen plane (and thus reporting illumination intensity in mW/mm²) is technically challenging on this resonant-scanning system, because it would require inserting a power sensor into the beam path and perturbing the optical alignment; consequently, we are unable to provide reliable absolute mW/mm² values. Instead, we now report all relevant acquisition parameters (objective, numerical aperture, refractive index, pinhole size, scan format, frame rate, and fixed laser/detector settings) and note that laser powers were kept constant within each experimental series and chosen to minimize bleaching and phototoxicity while maintaining an adequate signal-to-noise ratio. We have now added the details requested in the revised Methods section (lines 512-535), including information about the filter sets, acquisition settings, and typical illumination intensity.
(2) Please clarify what the thin versus thick traces represent in Figures 3D, 3F, 4C, and 4E. Are the thin traces individual trials from the same experiment, or from different experiments/animals? Does the thick trace represent the mean/median across those trials, a fitted curve, or a representative example?
We apologize this was not more clear in the original submission. Thin traces are individual stimulus-evoked trials (“sweeps”) acquired sequentially from the same muscle/NMJ in a single preparation; the panel is shown as a representative example of recordings collected across animals. The thick colored trace is the trialaveraged waveform (arithmetic mean) of those thin traces after alignment to stimulus onset and baseline subtraction (no additional smoothing beyond what is stated in Methods). The thick black curve over the decay phase is a single-exponential fit used to estimate τ. Specifically, we fit the decay segment by linear regression on the natural-log–transformed baseline-subtracted signal, which is equivalent to fitting y = y<sub>peak</sub>·e<sup>−t/τdecay</sup> over the decay window (revised Fig.4D and Fig.5C legends).
(3) Please clarify what the reported sample size (n) represents. Does it indicate the number of experimental repeats, the number of boutons or PSDs, or the number of animals?
Again, we apologize this was not clear. (n) refers to the number of animals (biological replicates), which is reported in Supplementary Table 1. All imaging was performed at muscle 6, abdominal segment A3. Per preparation, we imaged 1-2 NMJs in total, with each imaging targeting 2–3 terminal boutons at the target NMJ and acquired 2–3 imaging stacks choosing different terminal boutons per NMJ. For the standard stimulation protocol, we delivered 1 Hz stimulation for 1ms and captured 14 stimuli in a 15s time series imaging (lines 730-736).
Reviewer #3
Genetically encoded calcium indicators (GECIs) are essential tools in neurobiology and physiology. Technological constraints in targeting and kinetics of previous versions of GECIs have limited their application at the subcellular level. Chen et al. present a set of novel tools that overcome many of these limitations. Through systematic testing in the Drosophila NMJ, they demonstrate improved targeting of GCaMP variants to synaptic compartments and report enhanced brightness and temporal fidelity using members of the GCaMP8 series. These advancements are likely to facilitate more precise investigation of synaptic physiology.
This is a comprehensive and detailed manuscript that introduces and validates new GECI tools optimized for the study of neurotransmission and neuronal excitability. These tools are likely to be highly impactful across neuroscience subfields. The authors are commended for publicly sharing their imaging software.
This manuscript could be improved by further testing the GECIs across physiologically relevant ranges of activity, including at high frequency and over long imaging sessions. The authors provide a custom software package (CaFire) for Ca2+ imaging analysis; however, to improve clarity and utility for future users, we recommend providing references to existing Ca2+ imaging tools for context and elaborating on some conceptual and methodological aspects, with more guidance for broader usability. These enhancements would strengthen this already strong manuscript.
We thank the Reviewer for their overall positive evaluation and comments.
Major comments:
(1) Evaluation of the performance of new GECI variants using physiologically relevant stimuli and frequency. The authors took initial steps towards this goal, but it would be helpful to determine the performance of the different GECIs at higher electrical stimulation frequencies (at least as high as 20 Hz) and for longer (10 seconds) (Newman et al, 2017). This will help scientists choose the right GECI for studies testing the reliability of synaptic transmission, which generally requires prolonged highfrequency stimulation.
We appreciate this point by the reviewer and agree it would be of interest to evaluate sensor performance with higher frequency stimulation and for a longer duration. In response, we performed a variety of stimulation protocols at high intensities and times, but found the data to be difficult to separate individual responses given the decay kinetics of all calcium sensors. Hence, we elected not to include these in the revised manuscript. However, we have now included an evaluation of the sensors with 20 Hz electrical stimulation for ~1 sec using a direct comparison of Scar8f with OGB-1. These data are now presented in a new Fig. 3D,E and discussed in the manuscript (lines 396-403).
(2) CaFire.
The authors mention, in line 182: 'Current approaches to analyze synaptic Ca2+ imaging data either repurpose software designed to analyze electrophysiological data or use custom software developed by groups for their own specific needs.' References should be provided. CaImAn comes to mind (Giovannucci et al., 2019, eLife), but we think there are other software programs aimed at analyzing Ca2+ imaging data that would permit such analysis.
Thank you for the thoughtful question. At this stage, we’re unable to provide a direct comparison with existing analysis workflows. In surveying prior studies that analyze Drosophila NMJ Ca²⁺ imaging traces, we found that most groups preprocess images in Fiji/ImageJ and then rely on their own custom-made MATLAB or Python scripts for downstream analysis (see Blum et al. 2021; Xing and Wu 2018). Because these pipelines vary widely across labs, a standardized head-to-head evaluation isn’t currently feasible. With CaFire, our goal is to offer a simple, accessible tool that does not require coding experience and minimizes variability introduced by custom scripts. We designed CaFire to lower the barrier to entry, promote reproducibility, and make quantal event analysis more consistent across users. We have added references to the sentence mentioned above.
Regarding existing software that the reviewer mentioned – CaImAn (Giovannucci et al. 2019): We evaluated CaImAn, which is a powerful framework designed for large-scale, multicellular calcium imaging (e.g., motion correction, denoising, and automated cell/ROI extraction). However, it is not optimized for the per-event kinetics central to our project - such as extracting rise and decay times for individual quantal events at single synapses. Achieving this level of granularity would typically require additional custom Python scripting and parameter tuning within CaImAn’s code-centric interface. This runs counter to CaFire’s design goals of a nocode, task-focused workflow that enables users to analyze miniature events quickly and consistently without specialized programming expertise.
Regarding Igor Pro (WaveMetrics), (Müller et al. 2012): Igor Pro is another platform that can be used to analyze calcium imaging signals. However, it is commercial (paid) software and generally requires substantial custom scripting to fit the specific analyses we need. In practice, it does not offer a simple, open-source, point-and-click path to per-event kinetic quantification, which is what CaFire is designed to provide.
The authors should be commended for making their software publicly available, but there are some questions:
How does CaFire compare to existing tools?
As mentioned above, we have not been able to adapt the custom scripts used by various labs for our purposes, including software developed in MatLab (Blum et al. 2021), Python (Xing and Wu 2018), and Igor (Müller et al. 2012). Some in the field do use semi-publically available software, including Nikon Elements (Chen and Huang 2017) and CaImAn (Giovannucci et al. 2019). However, these platforms are not optimized for the per-event kinetics central to our project - such as extracting rise and decay times for individual quantal events at single synapses. We have added more details about CaFire, mainly focusing on the workflow and measurements, highlighting the superiority of CaFire, showing that CaFire provides a no-code, standardized pipeline with automated miniature-event detection and per-event metrics (e.g., amplitude, rise time τ, decay time τ), optional ΔR/R support, and auto-partition feature. Collectively, these features make CaFire simpler to operate without programming expertise, more transparent and reproducible across users, and better aligned with the event-level kinetics required for this project.
Very few details about the Huygens deconvolution algorithms and input settings were provided in the methods or text (outside of MLE algorithm used in STED images, which was not Ca2+ imaging). Was it blind deconvolution? Did the team distill the point-spread function for the fluorophores? Were both channels processed for ratiometric imaging? Were the same settings used for each channel? Importantly, please include SVI Huygens in the 'Software and Algorithms' Section of the methods.
We thank the reviewer for raising this important point. We have now expanded the Methods to describe our use of Huygens in more detail and have added SVI Huygens Professional (Scientific Volume Imaging, Hilversum, The Netherlands) to the “Software and Algorithms” section. For Ca²⁺ imaging data, time-lapse stacks were processed in the Huygens Deconvolution Wizard using the standard estimation algorithm (CMLE). This is not a blind deconvolution procedure. Instead, Huygens computes a theoretical point-spread function (PSF) from the full acquisition metadata (objective NA, refractive index, voxel size/sampling, pinhole, excitation/emission wavelengths, etc.); if refractive index values are provided and there is a mismatch, the PSF is adjusted to account for spherical aberration. We did not experimentally distill PSFs from bead measurements, as Huygens’ theoretical PSFs are sufficient for our data.
Both green (GCaMP) and red (mScarlet) channels were processed for ratiometric imaging using the same workflow (stabilization, optional bleaching correction, and deconvolution within Huygens). For each channel, the PSF, background, and SNR were estimated automatically by the same built-in algorithms, so the underlying procedures were identical even though the numerical values differ between channels because of their distinct wavelengths and noise characteristics. Importantly, Huygens normalizes each PSF to unit total intensity, such that the deconvolution itself does not add or remove signal and therefore preserves intensity ratios between channels; only background subtraction and bleaching correction can change absolute fluorescence values. For the mScarlet channel, where we observed modest bleaching (~1.10 over 15 sec), we applied Huygens’ bleaching correction and visually verified that similar structures maintained comparable intensities after correction. For presynaptic GCaMP signals, bleaching over these short recordings was negligible, so we omitted the bleaching-correction step to avoid introducing multiplicative artifacts. This workflow ensures that ratiometric ΔR/R measurements are based on consistently processed, intensity-conserving deconvolved images in both channels.
The number of deconvolution iterations could have had an effect when comparing GCAMP series; please provide an average number of iterations used for at least one experiment. For example, Figure 3, Syt::GCAMP6s, Scar8f & Scar8m, and, if applicable, the maximum number of permissible iterations.
We thank the reviewer for this comment. For all Ca²⁺ imaging datasets, deconvolution in Huygens was performed using the recommended default settings of the CMLE algorithm with a maximum of 30 iterations. The stopping criterion was left at the Huygens default, so the algorithm either converged earlier or, if convergence was not reached, terminated at this 30-iteration limit. No other iteration settings were used across the GCaMP series (lines 555-559).
Please clarify if the 'Express' settings in Huygens changed algorithms or shifted input parameters.
We appreciate the reviewer’s question regarding the Huygens “Express” settings. For clarity, we note that all Ca²⁺ imaging data reported in this manuscript were deconvolved using the “Deconvolution Wizard”, not the “Deconvolution Express” mode. In the Wizard, we explicitly selected the CMLE algorithm (or GMLE in a few STED-related cases as recommended by SVI), using the recommended maximum of 30 iterations, and other recommended settings while allowing Huygens to auto-estimate background and SNR for each channel.Bleaching correction was toggled manually per channel (applied to mScarlet when bleaching was evident, omitted for GCaMP when bleaching was negligible), as described in the revised Methods (lines 553-559).
By contrast, the Deconvolution Express tool in Huygens is a fully automated front-end that can internally adjust both the choice of deconvolution algorithm (e.g., CMLE vs. GMLE/QMLE) and key input parameters such as SNR, number of iterations, and quality threshold based on the selected “smart profile” and the image metadata. In preliminary tests on our datasets, Express sometimes produced results that were either overly smoothed or showed subtle artifacts, so we did not use it for any data included in this study. Instead, we relied exclusively on the Wizard with explicitly controlled settings to ensure consistency and transparency across all GCaMP series and ratiometric analyses.
We suggest including a sample data set, perhaps in Excel, so that future users can beta test on and organize their data in a similar fashion.
We agree that this would be useful, a point shared by R1 above. In response, we have added a sample data set to the GitHub site and included sample ImageJ data along with screenshots to explain the analysis in more detail. These improvements are discussed in the manuscript (lines 705-708).
(3) While the challenges of AZ imaging are mentioned, it is not discussed how the authors tackled each one. What is defined as an active zone? Active zones are usually identified under electron microscopy. Arguably, the limitation of GCaMP-based sensors targeted to individual AZs, being unable to resolve local Ca2+ changes at individual boutons reliably, might be incorrect. This could be a limitation of the optical setup being used here. Please discuss further. What sensor performance do we need to achieve this performance level, and/or what optical setup would we need to resolve such signals?
We appreciate the reviewer’s thoughtful comments and agree that the technical challenges of active zone (AZ) Ca²⁺ imaging merit further clarification. We defined AZs, as is the convention in our field, as individual BRP puncta at NMJs. These BRP puncta co-colocalize with individual puncta of other AZ components, including CAC, RBP, Unc13, etc. ROIs were drawn tightly over individual BRP puncta and only clearly separable spots were included.
To tackle the specific obstacles of AZ imaging (small signal volume, high AZ density, and limited photon budget at high frame rates), we implemented both improved sensors and optimized analysis (Fig. 6). First, we introduced a ratiometric AZ-targeted indicator, BRP::mScarlet3::GCaMP8m (Bar8m), and computed ΔR/R with ΔR/R with R(t)=F<sub>GCaMP8m</sub>/F<sub>mScarlet3</sub>. ROIs were drawn over individual AZs (Fig. 6B). Under our standard resonant area-scan conditions (~118 fps), Bar8m produces robust ΔR/R transients at individual AZs (example peaks ≈ 3.28; τ<sub>rise</sub>≈9.0 ms; Fig. 6C, middle), indicating that single-AZ signals can be detected reproducibly when AZs are optically resolvable.
Second, we increased temporal resolution using high-speed Galvano line-scan imaging (~1058 fps), which markedly sharpened the apparent kinetics (τ<sub>rise</sub>≈3.23 ms) and revealed greater between-AZ variability (Fig. 6C, right; 6D–E). Population analyses show that line scans yield much faster rise times than area scans (Fig. 6D) and a dramatically higher fraction of significantly different AZ pairs (8.28% and 4.14% in 8f and 8m areascan vs 78.62% in 8m line-scan, lines 721-725), uncovering pronounced AZ-to-AZ heterogeneity in Ca²⁺ signals. Together, these revisions demonstrate that under our current confocal configuration, AZ-targeted GCaMP8m can indeed resolve local Ca²⁺ changes at individual, optically isolated boutons.
We have revised the Discussion to clarify that our original statement about the limitations of AZ-targeted GCaMPs refers specifically to this combination of sensor and optical setup, rather than an absolute limitation of AZ-level Ca²⁺ imaging. In our view, further improvements in baseline brightness and dynamic range (ΔF/F or ΔR/R per action potential), combined with sub-millisecond kinetics and minimal buffering, together with optical configurations that provide smaller effective PSFs and higher photon collection (e.g., higher-NA objectives, optimized 2-photon or fast line-scan modalities, and potentially super-resolution approaches applied to AZ-localized indicators), are likely to be required to achieve routine, high-fidelity Ca²⁺ measurements at every individual AZ within a neuromuscular junction.
(4) In Figure 5: Only GCAMP8f (Bar8f fusion protein) is tested here. Consider including testing with GCAMP8m. This is particularly relevant given that GCAMP8m was a more successful GECI for subcellular post-synaptic imaging in Figure 6.
We appreciate this point and request by Reviewer 3. The main limitation for detecting local calcium changes at AZs is the speed of the calcium sensor, and hence we used the fastest available (GCaMP8f) to test the Bar8f sensor. While replacing GCaMP8f with GCaMP8m would indeed be predicted to enhance sensitivity (SNR), since GCaMP8m does not have faster kinetics relative to GCaMP8f, it is unlikely to be a more successful GECI for visualizing local calcium differences at AZs.
That being said, we agree that the Bar8m tool, including the improved mScarlet3 indicator, would likely be of interest and use to the field. Fortunately, we had engineered the Bar8m sensor while this manuscript was in review, and just recently received transgenic flies. We have evaluated this sensor, as requested by the reviewer, and included our findings in Fig. 1 and 6. In short, while the sensitivity is indeed enhanced in Bar8m compared to Bar8f, the kinetics remain insufficient to capture local AZ signals. These findings are discussed in the revised manuscript (lines 424-442, 719-730), and we appreciate the reviewer for raising these important points.
In earlier experiments, Bar8f yielded relatively weak fluorescence, so we traded frame rate for image quality during resonant area scans (~60 fps). After switching to Bar8m, the signal was bright enough to restore our standard 118 fps area-scan setting. Nevertheless, even with dual-channel resonant area scans and ratiometric (GCaMP/mScarlet) analysis, AZ-to-AZ heterogeneity remained difficult to resolve. Because Ca²⁺ influx at individual active zones evolves on sub-millisecond timescales, we adopted a high-speed singlechannel Galvano line-scan (~1 kHz) to capture these rapid transients. We first acquired a brief area image to localize AZ puncta, then positioned the line-scan ROI through the center of the selected AZ. This configuration provided the temporal resolution needed to uncover heterogeneity that was under-sampled in area-scan data. Consistent with this, Bar8m line-scan data showed markedly higher AZ heterogeneity (significant AZ-pair rate ~79%, vs. ~8% for Bar8f area scans and ~4% for Bar8m area scans), highlighting Bar8m’s suitability for quantifying AZ diversity. We have updated the text, Methods, and figure legend accordingly (tell reviewer where to find everything).
(5) Figure 5D and associated datasets: Why was Interquartile Range (IQR) testing used instead of ZScoring? Generally, IQR is used when the data is heavily skewed or is not normally distributed. Normality was tested using the D'Agostino & Pearson omnibus normality test and found that normality was not violated. Please explain your reasoning for the approach in statistical testing. Correlation coefficients in Figures 5 E & F should also be reported on the graph, not just the table. In Supplementary Table 1. The sub-table between 4D-F and 5E-F, which describes the IQR, should be labeled as such and contain identifiers in the rows describing which quartile is described. The table description should be below. We would recommend a brief table description for each sub-table.
Thank you for this helpful suggestion. We have updated the analysis in two complementary ways. First, we now perform paired two-tailed t-tests between every two AZs within the same preparation (pairwise AZ–AZ comparisons of peak responses). At α<0.05, the fraction of significant AZ pairs is ~79% for Bar8m line-scan data versus ~8% for Bar8f area-scan data, indicating markedly greater AZ-to-AZ diversity when measured at high temporal resolution. Second, for visually marking the outlying AZs, we re-computed the IQR (Q1–Q3) based on the individual values collected from each AZs(15 data points per AZ, 30 AZs for each genotype), and marked AZs whose mean response falls above Q3 or below Q1; IQR is used here solely as a robust dispersion reference rather than for hypothesis testing. Both analyses support the same observation: Bar8m line-scan data reveal substantially higher AZ heterogeneity than Bar8f and Bar8m area-scan data. We have revised the Methods, figure panels, and legends accordingly (t-test details; explicit “IQR (Q1–Q3)” labeling; significant AZ-pair rates reported on the plots) (lines 719-730).
(6) Figure 6 and associated data. The authors mention: ' SynapGCaMP quantal signals appeared to qualitatively reflect the same events measured with electrophysiological recordings (Fig. 6D).' If that was the case, shouldn't the ephys and optical signal show some sort of correlation? The data presented in Figure 6D show no such correlation. Where do these signals come from? It is important to show the ROIs on a reference image.
We apologize this was not clear, as similar points were raised by R1 and R2. We were just showing separate (uncorrelated) sample traces of electrophysiological and calcium imaging data. Given how confusing this presentation turned out to be, and the fact that we show the correlated ephys and calcium imaging events in Fig. 7, we have elected to remove the uncorrelated electrophysiological events in Fig. 6 to just focus on the calcium imaging events (now Figures 7 and 8).
Figure 7B: Were Ca2+ transients not associated with mEPSPs ever detected? What is the rate of such events?
This is an astute question. Yes indeed, during simultaneous calcium imaging and current clamp electrophysiology recordings, we occasionally observed GCaMP transients without a detectable mEPSP in the electrophysiological trace. This may reflect the detection limit of electrophysiology for very small minis; with our noise level and the technical limitation of the recording rig, events < ~0.2 mV cannot be reliably detected, whereas the optical signal from the same quantal event might still be detected. The fraction of calcium-only events was ~1–10% of all optical miniature events, depending on genotype (higher in lines with smaller average minis). These calcium-only detections were low-amplitude and clustered near the optical threshold (lines 361-365).
Minor comments
(1) It should be mentioned in the text or figure legend whether images in Figure 1 were deconvolved, particularly since image pre-processing is only discussed in Figure 2 and after.
We thank the reviewer for pointing this out. Yes, the confocal images shown in Figure 1 were also deconvolved in Huygens using the CMLE-based workflow described in the revised Methods. We applied deconvolution to improve contrast, reduce out-of-focus blur, and better resolve the morphology of presynaptic boutons, active zones, and postsynaptic structures, so that the localization of each sensor is more clearly visualized. We have now explicitly stated in the Fig. 1 legend and Methods (lines 575-577) that these images were deconvolved prior to display.
(2) The abbreviation, SNR, signal-to-noise ratio, is not defined in the text.
We have corrected this error and thank the reviewer for pointing this out.
(3) Please comment on the availability of fly stocks and molecular constructs.
We have clarified that all fly stocks and molecular constructs will be shared upon request (lines 747-750). We are also in the process of depositing the new Scar8f/m, Bar8f/m, and SynapGCaMP sensors to the Bloomington Drosophila Stock Center for public dissemination.
(4) Please add detection wavelengths and filter cube information for live imaging experiments for both confocal and widefield.
We thank the reviewer for this helpful suggestion. We have now added the detection wavelengths and filter cube configurations for both confocal and widefield live imaging to the Methods.
For confocal imaging, GCaMP signals were acquired on a Nikon A1R system using the FITC/GFP channel (488-nm laser excitation; emission collected with a 525/50-nm band-pass filter), and mScarlet signals were acquired using the TRITC/mCherry channel (561-nm laser excitation; emission collected with a 595/50-nm band-pass filter). Both channels were detected with GaAsP detectors under the same pinhole and scan settings described above (lines 512-517).
For widefield imaging, GCaMP was recorded using a GFP filter cube (LED excitation ~470/40 nm; emission ~525/50 nm), which is now explicitly described in the revised Methods section (lines 632-633).
(5) Please include a mini frequency analysis in Supplemental Figure S1.
We apologize for not including this information in the original submission. This is now included in the Supplemental Figure S1.
(6) In Figure S1B, consider flipping the order of EPSP (currently middle) and mEPSP (currently left), to easily guide the reader through the quantification of Figure S1A (EPSPs, top traces & mEPSPs, bottom traces).
We agree these modifications would improve readability and clarity. We have now re-ordered the electrophysiological quantifications in Fig. S1B as requested by the reviewer.
(7) Figure 6C: Consider labeling with sensor name instead of GFP.
We agree here as well, and have removed “GFP” and instead added the GCaMP variant to the heatmap in Fig. 7C.
(8) Figure 6E, 7B, 7E: Main statistical differences highlighting sensor performance should be represented on the figures for clarity.
We did not show these differences in the original submission in an effort to keep the figures “clean” and for clarity, putting the detailed statistical significance in Table S1. However, we agree with the reviewer that it would be easier to see these in the Fig. 6E and 7B,E graphs. This information has now been added the Figs. 7 and 8.
(9) Please report if the significance tested between the ephys mini (WT vs IIB-/-, WT vs IIA-/-, IIB-/- vs IIA-/-) is the same as for Ca2+ mini (WT vs IIB-/-, WT vs IIA-/-, IIB-/- vs IIA-/-). These should also exhibit a very high correlation (mEPSP (mV) vs Ca2+ mini deltaF/F). These tests would significantly strengthen the final statement of "SynapGCaMP8m can capture physiologically relevant differences in quantal events with similar sensitivity as electrophysiology."
We agree that adding the more detailed statistical analysis requested by the reviewer would strengthen the evidence for the resolution of quantal calcium imaging using SynapGCaMP8m. We have included the statistical significance between the ephys and calcium minis in Fig. 8 and included the following in the revised methods (lines 358-361), the Fig. 8 legend and Table S1:
Using two-sample Kolmogorov–Smirnov (K–S) tests, we found that SynapGCaMP8m Ca²⁺ minis (ΔF/F, Fig. 8E) differ significantly across all genotype pairs (WT vs IIB<sup>-/-</sup>, WT vs IIA<sup>-/-</sup>, IIB<sup>-/-</sup> vs IIA<sup>-/-</sup>; all p < 0.0001). The genotype rank order of the group means (±SEM) is IIB<sup>-/-</sup> > WT > IIA<sup>-/-</sup> (0.967 ± 0.036; 0.713 ± 0.021; 0.427 ± 0.017; n=69, 65, 59). For electrophysiological minis (mEPSP amplitude, Fig. 8F), K–S tests likewise show significant differences for the same comparisons (all p < 0.0001) with D statistics of 0.1854, 0.3647, and 0.4043 (WT vs IIB<sup>-/-</sup>, WT vs IIA<sup>-/-</sup>, IIB<sup>-/-</sup> vs IIA<sup>-/-</sup>, respectively). Group means (±SEM) again follow IIB<sup>-/-</sup> > WT > IIA<sup>-/-</sup> (0.824 ± 0.017 mV; 0.636 ± 0.015 mV; 0.383 ± 0.007 mV; n=41 each). These K–S results demonstrate identical significance and rank order across modalities, supporting our conclusion that SynapGCaMP8m resolves physiologically relevant quantal differences with sensitivity comparable to electrophysiology.
References
Blum, Ian D., Mehmet F. Keleş, El-Sayed Baz, Emily Han, Kristen Park, Skylar Luu, Habon Issa, Matt Brown, Margaret C. W. Ho, Masashi Tabuchi, Sha Liu, and Mark N. Wu. 2021. 'Astroglial Calcium Signaling Encodes Sleep Need in Drosophila', Current Biology, 31: 150-62.e7.
Chen, Y., and L. M. Huang. 2017. 'A simple and fast method to image calcium activity of neurons from intact dorsal root ganglia using fluorescent chemical Ca(2+) indicators', Mol Pain, 13: 1744806917748051.
Giovannucci, Andrea, Johannes Friedrich, Pat Gunn, Jérémie Kalfon, Brandon L. Brown, Sue Ann Koay, Jiannis Taxidis, Farzaneh Najafi, Jeffrey L. Gauthier, Pengcheng Zhou, Baljit S. Khakh, David W. Tank, Dmitri B. Chklovskii, and Eftychios A. Pnevmatikakis. 2019. 'CaImAn an open source tool for scalable calcium imaging data analysis', eLife, 8: e38173.
Müller, M., K. S. Liu, S. J. Sigrist, and G. W. Davis. 2012. 'RIM controls homeostatic plasticity through modulation of the readily-releasable vesicle pool', J Neurosci, 32: 16574-85.
Wu, Yifan, Keimpe Wierda, Katlijn Vints, Yu-Chun Huang, Valerie Uytterhoeven, Sahil Loomba, Fran Laenen, Marieke Hoekstra, Miranda C. Dyson, Sheng Huang, Chengji Piao, Jiawen Chen, Sambashiva Banala, Chien-Chun Chen, El-Sayed Baz, Luke Lavis, Dion Dickman, Natalia V. Gounko, Stephan Sigrist, Patrik Verstreken, and Sha Liu. 2025. 'Presynaptic Release Probability Determines the Need for Sleep', bioRxiv: 2025.10.16.682770.
Xing, Xiaomin, and Chun-Fang Wu. 2018. 'Unraveling Synaptic GCaMP Signals: Differential Excitability and Clearance Mechanisms Underlying Distinct Ca<sup>2+</sup> Dynamics in Tonic and Phasic Excitatory, and Aminergic Modulatory Motor Terminals in Drosophila', eneuro, 5: ENEURO.0362-17.2018.
De az igaz, hogy hit ma még a proletár, az új szívek birodalmában is talmi
But it is true that faith is scarce today, even in the realm of the proletarian, of YOUNG hearts
Author response:
The following is the authors’ response to the original reviews.
Public Reviews:
Reviewer #1 (Public review):
Summary:
This study presents a system for delivering precisely controlled cutaneous stimuli to freely moving mice by coupling markerless real-time tracking to transdermal optogenetic stimulation, using the tracking signal to direct a laser via galvanometer mirrors. The principal claims are that the system achieves sub-mm targeting accuracy with a latency of <100 ms. The nature of mouse gait enables accurate targeting of forepaws even when mice are moving.
Strengths:
The study is of high quality and the evidence for the claims is convincing. There is increasing focus in neurobiology in studying neural function in freely moving animals, engaged in natural behaviour. However, a substantial challenge is how to deliver controlled stimuli to sense organs under such conditions. The system presented here constitutes notable progress towards such experiments in the somatosensory system and is, in my view, a highly significant development that will be of interest to a broad readership.
Weaknesses:
(1) "laser spot size was set to 2.00 } 0.08 mm2 diameter (coefficient of variation = 3.85)" is unclear. Is the 0.08 SD or SEM? (not stated). Also, is this systematic variation across the arena (or something else)? Readers will want to know how much the spot size varies across the arena - ie SD. CV=4 implies that SD~7 mm. ie non-trivial variation in spot size, implying substantial differences in power delivery (and hence stimulus intensity) when the mouse is in different locations. If I misunderstood, perhaps this helps the authors to clarify. Similarly, it would be informative to have mean & SD (or mean & CV) for power and power density. In future refinements of the system, would it be possible/useful to vary laser power according to arena location?
We thank the reviewer for their comments and for identifying areas needing more clarity. The previous version was ambiguous: 0.08 refers to the standard deviation (SD). We have removed the ambiguity by stating mean ± SD and reporting a unitless coefficient of variation (CV).
The revised text reads “laser spot size was set to 2.00 ± 0.08 mm<sup>2</sup> (mean ± SD; coefficient of variation = 0.039).” This makes clear that the variability in spot size is minimal: it is 0.08 mm<sup>2</sup> SD (≈0.03 mm SD in diameter). This should help clarify that spot size variability across the arena is minute and unlikely to contribute meaningfully to differences in stimulus intensity across locations. The power was modulated depending on the experiment, so we provide the unitless CV here in “The absolute optical power and power density were uniform across the glass platform (coefficient of variation 0.035 and 0.029, respectively; Figure 2—figure supplement)”. We are grateful to the reviewer for spotting these omissions.
The reviewer also asks whether, in the future, it is “possible/useful to vary laser power according to arena location”. This is already possible in our system for infrared cutaneous stimulation using analog modulation (Figure 4). We have added the following sentence to make this clearer: “Laser power could be modulated using the analog control.”
(2) "The video resolution (1920 x 1200) required a processing time higher than the frame interval (33.33 ms), resulting in real-time pose estimation on a sub-sample of all frames recorded". Given this, how was it possible to achieve 84 ms latency? An important issue for closed-loop research will relate to such delays. Therefore please explain in more depth and (in Discussion) comment on how the latency of the current system might be improved/generalised. For example, although the current system works well for paws it would seem to be less suited to body parts such as the snout that do not naturally have a stationary period during the gait cycle.
We captured and stored video with a frame-to-frame interval of 33.33 ms (30 fps). DeepLabCut-live! was run in a latency-optimization mode, meaning that new frames are not processed while the network is busy - only the most recent frame is processed when free. The processing latency is measured per processed frame, and intermediate frames are thus skipped while the network is busy. Although a wide field of view and high resolution is required to capture the large environment, increasing the per-frame compute time, the processing latency remained small enough to track and stimulate moving mice. This processing latency of 84 ± 12 ms (mean ± SD) was calculated using the timestamps stored in the output files from DeepLabCut-live!: subtracting the frame acquisition timestamp from the frame processing timestamp across 16,000 processed frames recorded across four mice (4,000 each). In addition, there is a small delay to move the galvanometers and trigger the laser, calculated as 3.3 ± 0.5 ms (mean ± SD; 245 trials). This is described in the manuscript, but can be combined with the processing latency to indicate a total closed-loop delay of ≈87 ms so we have expanded on the ‘Optical system characterization’ subsection in the Methods, adding “We estimated a processing latency of 84 ± 12 ms (mean ± SD) by subtracting…” and that “In the current configuration the end-to-end closed-loop delay is ≈87 ms from the combination of the processing latency and other delays”. To the Discussion, we now comment on how this latency can be reduced and how this can allow for generalization to more rapidly moving body parts.
Reviewer #2 (Public review):
Parkes et al. combined real-time keypoint tracking with transdermal activation of sensory neurons to examine the effects of recruitment of sensory neurons in freely moving mice. This builds on the authors' previous investigations involving transdermal stimulation of sensory neurons in stationary mice. They illustrate multiple scenarios in which their engineering improvements enable more sophisticated behavioral assessments, including (1) stimulation of animals in multiple states in large arenas, (2) multi-animal nociceptive behavior screening through thermal and optogenetic activation, and (3) stimulation of animals running through maze corridors. Overall, the experiments and the methodology, in particular, are written clearly. However, there are multiple concerns and opportunities to fully describe their newfound capabilities that, if addressed, would make it more likely for the community to adopt this methodology:
The characterization of laser spot size and power density is reported as a coefficient of variation, in which a value of ~3 is interpreted as uniform. My interpretation would differ - data spread so that the standard deviation is three times larger than the mean indicates there is substantial variability in the data. The 2D polynomial fit is shown in Figure 2 - Figure Supplement 1A and, if the fit is good, this does support the uniformity claim (range of spot size is 1.97 to 2.08 mm2 and range of power densities is 66.60 to 73.80 mW). The inclusion of the raw data for these measurements and an estimate of the goodness of fit to the polynomials would better help the reader evaluate whether these parameters are uniform across space and how stable the power density is across repeated stimulations of the same location. Even more helpful would be an estimate of whether the variation in the power density is expected to meaningfully affect the responses of ChR2-expressing sensory neurons.
We thank the reviewer for their comments. As also noted in response to Reviewer 1, the coefficient of variation (CV) is now reported in unitless form (rather than a percentage) to ensure clarity. For avoidance of doubt, the CV is 0.039 (3.9%), so the variation in laser spot size is minimal – there is negligible spot size variability across the system. The ranges are indeed consistent with uniformity. We have included the goodness-of-fit estimates in the appropriate figure legend “fit with a two-dimensional polynomial (area R<sup>2</sup> = 0.91; power R<sup>2</sup> = 0.75)”. This indicates that the polynomials fit well overall.
The system already allows for control of spot size. To examine whether the variation in the power density affects the responses of ChR2-expressing sensory neurons, we examined this in our previous work that focused more on input-output relationships, demonstrating a steep relationship between spot size (range of 0.02 mm<sup>2</sup> to 2.30 mm<sup>2</sup>) and the probability of paw response, demonstrating a meaningful change in response probability (Schorscher-Petcu et al. eLife, 2021). In future studies, we aim to use this approach to “titrate” cutaneous inputs as mice move through their environments.
While the error between the keypoint and laser spot error was reported as ~0.7 to 0.8 mm MAE in Figure 2L, in the methods, the authors report that there is an additional error between predicted keypoints and ground-truth labeling of 1.36 mm MAE during real-time tracking. This suggests that the overall error is not submillimeter, as claimed by the authors, but rather on the order of 1.5 - 2.5 mm, which is considerable given the width of a hind paw is ~5-6 mm and fore paws are even smaller. In my opinion, the claim for submillimeter precision should be softened and the authors should consider that the area of the paw stimulated may differ from trial to trial if, for example, the error is substantial enough that the spot overlaps with the edge of the paw.
We thank the reviewer for identifying a discrepancy in these reported errors. We clarify this below and in the manuscript
The real-time tracking error is the mean absolute Euclidean distance (MAE) between ground truth and DLC on the left hind paw where likelihood was relatively high. More specifically, ground truth was obtained by manual annotation of the left hind paw center. The corresponding DLC keypoint was evaluated in frames with likelihood >0.8 (the stimulation threshold). Across 1,281 frames from five videos of freely exploring mice (30 fps), the MAE was 1.36 mm.
The targeting error is the MAE between ground truth and the laser spot location, so should reflect the real-time tracking error plus errors from targeting the laser. More specifically, this metric was determined by comparing the manually determined ground truth keypoint of the left hind paw and the actual center of the laser spot. Importantly, this metric was calculated using four five-minute high-speed videos recorded at 270 fps of mice freely exploring the open arena (463 frames) and frames were selected with a likelihood threshold >0.8. This allowed us to resolve the brief laser pulses but inadvertently introduced a difference in spatial scaling. After rescaling, the values give a targeting error MAE now in line with the real-time tracking error (see corrected Figure 2L). This is approximately 1.3 mm across all locomotion speeds categories. These errors are small and are limited by the spatial resolution of the cameras. We thank the reviewer for noting this discrepancy and prompting us to get to its root cause.
We have amended the subtitle on Figure 2L as “Ground truth keypoint to laser spot error” and have avoided the use of submillimeter throughout. We have added the following sentence to clarify this point: “As laser targeting relies on real-time tracking to direct the laser to the specified body part, this metric includes any errors introduced by tracking and targeting”.
As the major advance of this paper is the ability to stimulate animals during ongoing movement, it seems that the Figure 3 experiment misses an opportunity to evaluate state-dependent whole-body reactions to nociceptor activation. How does the behavioral response relate to the animal's activity just prior to stimulation?
The reviewers suggest analysis of state-dependent responses. In the Figure 3 experiment, mice were stimulated up to five times when stationary. Analysis of whole body reactions in stationary mice has been described in (Schorscher-Petcu et al. eLife, 2021) and doing this here would be redundant, so instead we now analyse the responses of moving mice in Figure 5. This new analysis shows robust state-dependent responses during movement as suggested by the reviewer. We find two behavioral clusters: one that is for faster, direct (coherent) movement and the other that is for slower assessment (incoherent) movement. Stimulation during the former results in robust and consistent slowing and shift towards assessment, whereas stimulation during the former results in a reduction in assessment. We describe and interpret these new data in the Results and Discussion sections and add information in the Methods and Figure legend, as given below. We believe that demonstrating movement statedependence is a valuable addition to the paper and thank the reviewer for suggesting this.
Given the characterization of full-body responses to activation of TrpV1 sensory neurons in Figure 4 and in the authors' previous work, stimulation of TrpV1 sensory neurons has surprisingly subtle effects as the mice run through the alternating T maze. The authors indicate that the mice are moving quickly and thus that precise targeting is required, but no evidence is shared about the precision of targeting in this context beyond images of four trials. From the characterization in Figure 2, at max speed (reported at 241 +/- 53 mm/s, which is faster than the high speeds in Figure 2), successful targeting occurs less than 50% of the time. Is the initial characterization consistent with the accuracy in this context? To what extent does inaccuracy in targeting contribute to the subtlety of affecting trajectory coherence and speed? Is there a relationship between animal speed and disruption of the trajectory?
We thank the reviewer for pointing out the discrepancy in the reported maximum speed. We have corrected the error in the main text: the average maximum speed is 142 ± 26 mm/s (four mice).
The self-paced T-maze alternation task in Figure 5 demonstrates that mice running in a maze can be stimulated using this method. We did not optimize the particular experimental design to assess the hit accuracy, as this was determined in Figure 2. Instead, we optimized for the pulse frequencies, meaning the galvanometers tracked with processed frames but the laser was triggered whether or not the paw was actually targeted. However, even in this case with the system pulsing in the free-run mode, the laser hit rate was 54 ± 6% (mean ± sem, n = 7 mice). We have weakened references to submillimeter as it was only inferred from other experiments and was not directly measured here. We find in this experiment that stimulation in freely moving mice can cause them to briefly halt and evaluate. In the future, we will use experimental designs to more optimally examine learning.
The reviewer also asks if there is a relationship between speed and disruption of the trajectory. We find that this is the case as described above with our additional analysis.
Reviewer #3 (Public review):
Summary:
To explore the diverse nature of somatosensation, Parkes et al. established and characterized a system for precise cutaneous stimulation of mice as they walk and run in naturalistic settings. This paper provides a framework for real-time body part tracking and targeted optical stimuli with high precision, ensuring reliable and consistent cutaneous stimulation. It can be adapted in somatosensation labs as a general technique to explore somatosensory stimulation and its impact on behavior, enabling rigorous investigation of behaviors that were previously difficult or impossible to study.
Strengths:
The authors characterized the closed-loop system to ensure that it is optically precise and can precisely target moving mice. The integration of accurate and consistent optogenetic stimulation of the cutaneous afferents allows systematic investigation of somatosensory subtypes during a variety of naturalistic behaviors. Although this study focused on nociceptors innervating the skin (Trpv1::ChR2 animals), this setup can be extended to other cutaneous sensory neuron subtypes, such as low-threshold mechanoreceptors and pruriceptors. This system can also be adapted for studying more complex behaviors, such as the maze assay and goal-directed movements.
Weaknesses:
Although the paper has strengths, its weakness is that some behavioral outputs could be analyzed in more detail to reveal different types of responses to painful cutaneous stimuli. For example, paw withdrawals were detected after optogenetically stimulating the paw (Figures 3E and 3F). Animals exhibit different types of responses to painful stimuli on the hind paw in standard pain assays, such as paw lifting, biting, and flicking, each indicating a different level of pain. Improving the behavioral readouts from body part tracking would greatly strengthen this system by providing deeper insights into the role of somatosensation in naturalistic behaviors. Additionally, if the laser spot size could be reduced to a diameter of 2 mm², it would allow the activation of a smaller number of cutaneous afferents, or even a single one, across different skin types in the paw, such as glabrous or hairy skin.
We thank the reviewer for highlighting how our system can be combined with improved readouts of coping behavior to provide deeper insights. Optogenetic and infrared cutaneous stimulation are well established generators of coping behaviors (lifting, flicking, licking, biting, guarding). Detection of these behaviors is an active and evolving field with progress being made regularly (e.g. Jones et al., eLife 2020 [PAWS]; Wotton et al., Mol Pain 2020; Zhang et al., Pain 2022; Oswell et al., bioRxiv 2024 [LUPE]; Barkai et al., Cell Reports Methods 2025 [BAREfoot], along with more general tools like Hsu et al., Nature Communications 2021 [B-SOiD]; Luxem et al., Communications Biology 2022 [VAME]; Weinreb et al,. Nature Methods 2024 [Keypoints-MoSeq]). One output of our system is bodypart keypoints, which are the typical input to many of these tools. We will leave the readers and users of the system to decide which tools are appropriate for their experimental designs - the focus of this current manuscript is describing the novel stimulation approach in moving animals.
Recommendations for the authors:
Reviewer #1 (Recommendations for the authors):
(1) It is hard to see how the rig is arranged from the render of Figure 2AB due to the components being black on black. A particularly useful part of Fig2AB is the aerial view in panel B that shows the light paths. I suggest adding the labelling of Figure 2A also to that. The side/rear views could perhaps be deleted, allowing the aerial view to be larger.
We appreciate this suggestion and have revised Figure 2B to improve the visibility of the optomechanical components. We have enlarged the side and aerial views, removed the rear view, and added further labels to the aerial view.
(2) MAE - to interpret the 0.54 result, it would be useful to state the arena size in this paragraph.
Thank you. We have added the arena size in this paragraph and also added scales in the relevant figure (Figure 2).
(3) "pairwise correlations of R = 0.999 along both x- and y-axes". Is this correlation between hindpaw keypoint and galvo coordinates?
Yes, we have added the following to clarify: “...between galvanometer coordinates and hind paw keypoints”
(4) Latency was 84 ms. Is this mainly/entirely the delay between DLC receiving the camera image and outputting key point coordinates?
Yes, we hope that the additional detail in the Methods and Discussion described above will now clarify the current closed-loop latencies.
(5) "Mice move at variable speeds": in this sentence, spell out when "speed" refers to mouse and when it refers to hindpaw. Similarly, Fig 2i. The sentence is potentially confusing to general readers (paws stationary although the mouse is moving). Presumably, it's due to gait. I suggest explaining this here.
The speed values that relate to the mouse body and paws are now clearer in the main text and in the legend for Figure 2I.
(6) Figure 2k and associated main text. It is not clear what "success/hit rate" means here.
We have added the following sentence in the main text: “Hit accuracy refers to the percentage of trials in which the laser successfully targeted (‘hit’) the intended hind paw.” and use hit accuracy throughout instead of success rate.
(7) Figure 2L. All these points are greater than the "average" 0.54 reported in the text. How is this possible?
The MAE of 0.54 mm refers to the “predicted and actual laser spot locations” (that is, the difference between where the calibration map should place the laser spot and where it actually fell), while Figure 2L MAE values refers to the error between the ground truth keypoint to laser spot (that is, the error between the human-observed paw target and where the laser spot fell). The latter error will include the former error so is expected to be larger. We have clarified this point throughout the text, for example, stating “As laser targeting relies on real-time tracking to direct the laser to the specified body part, this metric inherently accounts for any errors introduced by the tracking and targeting.”. This is also discussed above in response to Reviewer 2.
(8) "large circular arena". State the size here
We have added this to the Figure 2 legend.
(9) Figure 3c-left. Can the contrast between the mouse and floor be increased here?
We have improved the contrast in this image.
(10) Figure 5c. It is unclear what C1, C2, etc refers to. Mice?
Yes, these refer to mice. We have removed reference to these now as they are not needed.
(11) Discussion. A comment. There is scope for elaborating on the potential for new research by combining it with new methods for measurements of neural activity in freely moving animals in the somatosensory system.
Thank you. We agree and have added more detail on this in the discussion stating “The system may be combined with existing tools to record neural activity in freely-moving mice, such as fiber photometry, miniscopes, or large-scale electrophysiology, and manipulations of this neural activity, such as optogenetics and chemogenetics. This can allow mechanistic dissection of cell and circuit biology in the context of naturalistic behaviors.”
Reviewer #3 (Recommendations for the authors):
(1) Include the number of animals for behavior assays for the panels (e.g., Figures 4G).
Where missing, we now state the number of animals in panels.
(2) If representative responses are shown, such as in Figures 3E and 4F, include the average response with standard deviation so readers can appreciate the variation in the responses.
We appreciate the suggestion to show variability in the responses. We have made several changes to Figures 3 and 4. Specifically, to illustrate the variability across multiple trials more clearly, Figure 3E now shows representative keypoint traces for each body part from two mice during their 5 trials. For Figure 4, we have re-analyzed the thermal stimulation trials and shown a raster plot of keypoint-based local motion energy (Figure 4E) sorted by response latency for hundreds of trials. Figure 4G now presents the cumulative distribution for all trials and animals for thermal (18 wild-type mice, 315 trials) and optogenetic stimulation trials (9 Trpv1::ChR2 mice, 181 trials). We also now provide means ± SD for the key metrics for optogenetic and thermal stimulation trials in Figure 4 in the Results section. This keeps the manuscript focused on the methodological advances while showing the trial variability.
(3) "optical targeting of freely-moving mice in a large environments" should be "optical targeting of freely-moving mice in a large environment".
Corrected
(4) Define fps when you first mention this in the manuscript.
Added
(5) Data needs to be shown for the claim "Mice concurrently turned their heads toward the stimulus location while repositioning their bodies away from it".
We state this observation to qualify that the stimulation of stationary mice resulted in behavioral responses “consistent with previous studies”. It would be redundant to repeat our full analysis and might distract from the novelty of the current manuscript. We have restricted this sentence to make it clearer: “Consistent with previous studies, we observed the whole-body behaviors like head orienting concurrent with local withdrawal (Browne et al., Cell Reports 2017; Blivis et al., eLife, 2017.)”
Author response:
The following is the authors’ response to the original reviews.
Public Reviews:
Reviewer #1 (Public review):
Summary:
The study by Druker et al. shows that siRNA depletion of PHD1, but not PHD2, increases H3T3 phosphorylation in cells arrested in prometaphase. Additionally, the expression of wild-type RepoMan, but not the RepoMan P604A mutant, restored normal H3T3 phosphorylation localization in cells arrested in prometaphase. Furthermore, the study demonstrates that expression of the RepoMan P604A mutant leads to defects in chromosome alignment and segregation, resulting in increased cell death. These data support a role for PHD1-mediated prolyl hydroxylation in controlling progression through mitosis. This occurs, at least in part, by hydroxylating RepoMan at P604, which regulates its interaction with PP2A during chromosome alignment.
Strengths:
The data support most of the conclusions made. However, some issues need to be addressed.
Weaknesses:
(1) Although ectopically expressed PHD1 interacts with ectopically expressed RepoMan, there is no evidence that endogenous PHD1 binds to endogenous RepoMan or that PHD1 directly binds to RepoMan.
We do not fully agree that this comment is accurate - the implication is that we only show interaction between two exogenously expressed proteins, i.e. both exogenous PHD1 and RepoMan, when in fact we show that tagged PHD1 interacts with endogenous RepoMan. The major technical challenge here is the well-known difficulty of detecting endogenous PHD1 in such cell lines. We agree that co-IP studies do not prove that this interaction is direct and never claim to have shown this, though we do feel that a direct interaction is most likely, albeit not proven.
(2) There is no genetic evidence indicating that PHD1 controls progression through mitosis by catalyzing the hydroxylation of RepoMan.
We agree that our current study is primarily a biochemical and cell biological study, rather than a genetic study. Nonetheless, similar biochemical and cellular approaches have been widely used and validated in previous studies in mechanisms regulating cell cycle progression and we are confident in the conclusions drawn based on the data obtained so far.
(3) Data demonstrating the correlation between dynamic changes in RepoMan hydroxylation and H3T3 phosphorylation throughout the cell cycle are needed.
We agree that it will be very interesting to analyse in more detail the cell cycle dynamics of RepoMan hydroxylation and H3T3 phosphorylation - along with other cell cycle parameters. We view this as outside the scope of our present study and are actively engaged in raising the additional funding needed to pursue such future experiments.
(4) The authors should provide biochemical evidence of the difference in binding ability between RepoMan WT/PP2A and RepoMan P604A/PP2A.
Here again we agree that it will be very interesting to analyse in future the detailed binding interactions between wt and mutant RepoMan and other interacting proteins, including PP2A. We show reduced interaction in cells by PLA (Figure 5A) and in biochemical analysis (Figure 5C). More in vitro analysis is, in our view, outside the scope of our present study and we are actively engaged in raising the additional funding needed to pursue such future experiments.
(5) PHD2 is the primary proline hydroxylase in cells. Why does PHD1, but not PHD2, affect RepoMan hydroxylation and subsequent control of mitotic progression? The authors should discuss this issue further.
We agree with the main point underpinning this comment, i.e., that there are still many things to be learned concerning the specific roles and mechanisms of the different PHD enzymes in vivo. We address this in the Discussion section and look forward to addressing these questions experimentally in future studies.
Reviewer #2 (Public review):
Summary:
This is a concise and interesting article on the role of PHD1-mediated proline hydroxylation of proline residue 604 on RepoMan and its impact on RepoMan-PP1 interactions with phosphatase PP2A-B56 complex leading to dephosphorylation of H3T3 on chromosomes during mitosis. Through biochemical and imaging tools, the authors delineate a key mechanism in the regulation of the progression of the cell cycle. The experiments performed are conclusive with well-designed controls.
Strengths:
The authors have utilized cutting-edge imaging and colocalization detection technologies to infer the conclusions in the manuscript.
Weaknesses:
Lack of in vitro reconstitution and binding data.
We agree that it will be very interesting to pursue in vitro reconstitution studies and detailed binding data. We view this as outside the scope of our present study and are actively engaged in raising the additional funding needed to pursue such future experiments. We do provide in vitro hydroxylation data in our accompanying manuscript by Jiang et al, 2025 Elife.
Reviewer #3 (Public review):
Summary:
The manuscript is a comprehensive molecular and cell biological characterisation of the effects of P604 hydroxylation by PHD1 on RepoMan, a regulatory subunit of the PPIgamma complex. The identification and molecular characterisation of the hydroxylation site have been written up and deposited in BioRxiv in a separate manuscript. I reviewed the data and came to the conclusion that the hydroxylation site has been identified and characterised to a very high standard by LC-MS, in cells and in vitro reactions. I conclude that we should have no question about the validity of the PHD1-mediated hydroxylation.
In the context of the presented manuscript, the authors postulate that hydroxylation on P604 by PHD1 leads to the inactivation of the complex, resulting in the retention of pThr3 in H3.
Strengths:
Compelling data, characterisation of how P604 hydroxylation is likely to induce the interaction between RepoMan and a phosphatase complex, resulting in loading of RepoMan on Chromatin. Loss of the regulation of the hydroxylation site by PHD1 results in mitotic defects.
Weaknesses:
Reliance on a Proline-Alanine mutation in RepoMan to mimic an unhydroxylatable protein. The mutation will introduce structural alterations, and inhibition or knockdown of PHD1 would be necessary to strengthen the data on how hydroxylates regulate chromatin loading and interactions with B56/PP2A.
We do not agree that we rely solely on analysis of the single site pro-ala mutant in RepoMan for our conclusions, since we also present a raft of additional experimental evidence, including knock-down data and experiments using both fumarate and FG. We would also reference the data we present on RepoMan in the parallel study by Jiang et al, which has also published in eLife(https://doi.org/10.7554/eLife.108128.1)). Of course, we agree with the reviewer that even although the mutant RepoMan features only a single amino acid change, this could still result in undetermined structural effects on the RepoMan protein that could conceivably contribute, at least in part, to some of the phenotypic effects observed. We now provide evidence in the current revision (new Figure 5D) that reduced interaction between RepoMan and B56gamma/PP2A is also evident when PHD1 is depleted from cells.
Recommendations for the authors:
Reviewer #2 (Recommendations for the authors):
(1) The manuscript can benefit from improved quality of writing and avoidance of grammatical errors.
We have checked through the manuscript again and corrected any mistakes we have encountered in the Current revision.
(2) Although the data in the manuscript is compelling, it is difficult to rule out indirect effects in the interactions. Hence, in vitro binding assays with purified proteins are important to validate the findings, along with in vitro reconstitution of phosphatase activity.
It is possible that cofactors and / or additional PTMs are required to promote these interactions in vivo. We have provided in vitro hydroxylation analysis and the additional experiments suggested will be the subject of follow-on future studies.
(3) Proline to alanine is a drastic mutation in the amino acid backbone. The authors could purify PHD1 and reconstitute P604 hydroxylation to show if it performs as expected.
This is likely to be a challenging experiment technically, given that RepoMan is a component of multiple distinct complexes, some of which are dynamic. We did not feel able to address this within the scope of the current study.
(4) The confocal images showing the overlap of two fluorescent signals need to show some sort of quantification and statistics to prove that the overlap is significant.
We now provide Pearson correlation measurements for Figure 2A in new Figure 2B in the Current revision.
(5) Kindly provide a clearer panel for the Western blot of H3T3ph in Figure 3c.
We have now included a new panel for this Figure in the Current revision.
(6) Kindly also include the figures for validation of siRNAs used in the study
We have added this throughout in supplementary figures.
Reviewer #3 (Recommendations for the authors):
(1) The authors have shown that PHD1 and RepoMan interact; can the interaction be "trapped" by the addition of DMOG? Generally, hydroxylase substrates can be trapped, which would add an additional layer of confidence that PHD1 and RepoMan form an enzyme-substrate complex.
This is something we are planning to do for follow-up studies using the established methods from the von Kriesgheim laboratory.
(2) How does P604A mutation affect the interaction with PHD1? One would expect a reduction in interaction.
Another interesting point we are planning to investigate in the future.
(3) The effects of expression of the wt and P604A mutant repoman are well-characterised. Could the authors check the effects of overexpressing PHD1 and deadPHD1, inhibition on the mitosis/H3 phosphorylation? My concerns are that a P-A mutation will disrupt the secondary structure, and although it is a good tool, data should be backed up by increasing/decreasing the hydroxylation of RepoMan over the mutation. Repeat some of the most salient experiments where the P604A mutation has been used and modulate the hydP604 by modulating PHD1 activity/expression (such as Chromatin interaction, PLA assay, B56gamma interaction, H3 phosphorylation localisation, Monastrol release, etc.)
We agree, the PA mutant can potentially affect the protein structure. In our manuscript we have provided pH3 analysis for PHD inhibition using siRNA, FG4592 and Fumarate. In the Current revision ee also data showing that depletion of PHD1 results in a reduction in interaction between RepoMan and B56gamma/PP2A. This is now presented in new figure 5D.
(4) I also have a general question, as a point of interest, as the interaction between PHD1 and RepoMan appears to be cell cycle dependent, is it possible that the hydroxylation status cycles as well? Could this explain how some sub-stochiometric hydroxylation events observed may be masked by assessing unsynchronised cells in bulk?
Indeed, a very good question. We believe this is an interesting question for follow up studies. Given our previous publication showing phosphorylation of PHD1 by CDKs alters substrate binding (Ortmann et al, 2016 JCS), this is our current hypothesis.
Reviewer #1 (Public review):
Summary:
In this article by Xiao et al., the authors aimed to identify the precise targets by which magnesium isoglycyrrhizinate (MgIG) functions to improve liver injury in response to ethanol treatment. The authors found through a series of in vivo and molecular approaches that MgIG treatment attenuates alcohol-induced liver injury through a potential SREBP2-IdI1 axis. This manuscript adds to a previous set of literature showing MgIG improves liver function across a variety of etiologies, and also provides mechanistic insight into its mechanism of action.
Strengths:
(1) The authors use a combination of approaches from both in-vivo mouse models to in-vitro approaches with AML12 hepatocytes to support the notion that MgIG does improve liver function in response to ethanol treatment.
(2) The authors use both knockdown and overexpression approaches, in vivo and in vitro, to support most of the claims provided.
(3) Identification of HSD11B1 as the protein target of MgIG, as well as confirmation of direct protein-protein interactions between HSD11B1/SREBP2/IDI1, is novel.
Weaknesses:
Major weaknesses can be classified into 3 groups:
(1) The results do not support some claims made.
(2) Qualitative analyses of some of the lipid measures, as opposed to more quantitative analyses.
(3) There are no appropriate readouts of Srebp2 translocation and/or activity.
More specific comments:
(1) A few of the claims made are not supported by the references provided. For instance, line 76 states MgIG has hepatoprotective properties and improved liver function, but the reference provided is in the context of myocardial fibrosis.
(2) MgIG is clinically used for the treatment of liver inflammatory disease in China and Japan. In the first line of the abstract, the authors noted that MgIG is clinically approved for ALD. In which countries is MgIG approved for clinical utility in this space?
(3) Serum TGs are not an indicator of liver function. Alterations in serum TGs can occur despite changes in liver function.
(4) There are discrepancies in the results section and the figure legends. For example, line 302 states Idil is upregulated in alcohol fed mice relative to the control group. The figure legend states that the comparison for Figure 2A is that of ALD+MgIG and ALD only.
(5) Oil Red O staining provided does not appear to be consistent with the quantification in Figure 1D. ORO is nonspecific and can be highly subjective. The representative image in Figure 1C appears to have a much greater than 30% ORO (+) area.
(6) The connection between Idil expression in response to EtOH/PA treatment in AML12 cells with viability and apoptosis isn't entirely clear. MgIG treatment completely reduces Idi1 expression in response to EtOH/PA, but only moderate changes, at best, are observed in viability and apoptosis. This suggests the primary mechanism related to MgIG treatment may not be via Idi1.
(7) The nile red stained images also do not appear representative with its quantification. Several claims about more or less lipid accumulation across these studies are not supported by clear differences in nile red.
(8) The authors make a comment that Hsd11b1 expression is quite low in AML12 cells. So why did the authors choose to knockdown Hsd11b1 in this model?
(9) Line 380 - the claim that MGIG weakens the interaction between HSD11b1 and SREBP2 cannot be made solely based on one Western blot.
(10) It's not clear what the numbers represent on top of the Western blots. Are these averages over the course of three independent experiments?
(11) The claim in line 382 that knockdown of Hsd11b1 resulted in accumulation of pSREBP2 is not supported by the data provided in Figure 6D.
(12) None of the images provided in Figure 6E support the claims stated in the results. Activation of SREBP2 leads to nuclear translocation and subsequent induction of genes involved in cholesterol biosynthesis and uptake. Manipulation of Hsd11b1 via OE or KD does not show any nuclear localization with DAPI.
(13) The entire manuscript is focused on this axis of MgIG-Hsd11b1-Srebp2, but no Srebp2 transcriptional targets are ever measured.
(14) Acc1 and Scd1 are Srebp1 targets, not Srebp2.
(15) A major weakness of this manuscript is the lack of studies providing quantitative assessments of Srebp2 activation and true liver lipid measurements.
Reviewer #2 (Public review):
Summary:
In this manuscript, the authors investigated magnesium isoglycyrrhizinate (MgIG)'s hepatoprotective actions in chronic-binge alcohol-associated liver disease (ALD) mouse models and ethanol/palmitic acid-challenged AML-12 hepatocytes. They found that MgIG markedly attenuated alcohol-induced liver injury, evidenced by ameliorated histological damage, reduced hepatic steatosis, and normalized liver-to-body weight ratios. RNA sequencing identified isopentenyl diphosphate delta isomerase 1 (IDI1) as a key downstream effector. Hepatocyte-specific genetic manipulations confirmed that MgIG modulates the SREBP2-IDI1 axis. The mechanistic studies suggested that MgIG could directly target HSD11B1 and modulate the HSD11B1-SREBP2-IDI1 axis to attenuate ALD. This manuscript is of interest to the research field of ALD.
Strengths:
The authors have performed both in vivo and in vitro studies to demonstrate the action of magnesium isoglycyrrhizinate on hepatocytes and an animal model of alcohol-associated liver disease.
Weaknesses:
The data were not well-organised, and the paper needs proofreading again, with a focus on the use of scientific language throughout.
Here are several comments:
(1) In Supplemental Figure 1A, all the treatment arms (A-control, MgIG-25 mg/kg, MgIG-50 mg/kg) showed body weight loss compared to the untreated controls. However, Figure 1E showed body weight gain in the treatment arms (A-control and MgIG-25 mg/kg), why? In Supplemental Figure 1A, the mice with MgIG (25 mg/kg) showed the lowest body weight, compared to either A-control or MgIG (50 mg/kg) treatment. Can the authors explain why MgIG (25 mg/kg) causes bodyweight loss more than MgIG (50 mg/kg)? What about the other parameters (ALT, ALS, NAS, etc.) for the mice with MgIG (50 mg/kg)?
(2) IL-6 is a key pro-inflammatory cytokine significantly involved in ALD, acting as a marker of ALD severity. Can the authors explain why MgIG 1.0 mg/ml shows higher IL-6 gene expression than MgIG (0.1-0.5 mg/ml)? Same question for the mRNA levels of lipid metabolic enzymes Acc1 and Scd1.
(3) For the qPCR results of Hsd11b1 knockdown (siRNA) and Hsd11b1 overexpression (plasmid) in AML-12 cells (Figure 5B), what is the description for the gene expression level (Y axis)? Fold changes versus GAPDH? Hsd11b1 overexpression showed non-efficiency (20-23, units on Y axis), even lower than the Hsd11b1 knockdown (above 50, units on Y axis). The authors need to explain this. For the plasmid-based Hsd11b1 overexpression, why does the scramble control inhibit Hsd11b1 gene expression (less than 2, units on the Y axis)? Again, this needs to be explained.
ATCCCat#CRL-2577
DOI: 10.1016/j.chembiol.2026.01.004
Resource: (ATCC Cat# CRL-2577, RRID:CVCL_0504)
Curator: @areedewitt04
SciCrunch record: RRID:CVCL_0504
RRID:AB_10000240
DOI: 10.64898/2026.01.25.701593
Resource: (Aves Labs Cat# GFP-1020, RRID:AB_10000240)
Curator: @scibot
SciCrunch record: RRID:AB_10000240
RRID:AB_10572253
DOI: 10.1016/j.isci.2025.114148
Resource: (DSHB Cat# BA-F8, RRID:AB_10572253)
Curator: @scibot
SciCrunch record: RRID:AB_10572253
As a rhetoric of becoming, Asian American rhetoric is also an exampleof hybridity. Operating in a space that is “crisscrossed with a variety of lan-guages, experiences, and voices” and that “intermingles with the weightof particular histories that will not fit into the master narrative of a mono-lithic culture” (Giroux 1992, 209), Asian American rhetoric draws upondiscursive practices both from the European American tradition and fromAsian, as well as other ethnic and worldly, traditions.
discussed in class. pressures that create conditions. noting that AA are not fully foreign or domesticated (a little like limbo) Hybridity in connection with the "rhetorics of" versus the "rhetorics from" the group.
Therefore, to remember rhetorically, for Asian Americans, isto investigate histories that are formed through the transnational tiesamong Asia and the United States, and to trace and stitch togethermemories of seemingly disparate moments and cultural sites
discussed in class: good summary of points Q: would be interesting to compare AA rhetoric to Asian rhetoric.<br /> engaging with the past and the present. the continuation of symbols. connections to the notion of hybridity on pg 5
particularizing speech settings, specific communicative purposes,and situated discursive acts.
places where aa rhetoric can take place
Este código de proveedor se inyecta en la Spec de la versión como primary_provider.
Tener en cuenta en flujo de sim change profile
xistan en la CapabilityLibrary
lista con capacidades predefinidas ( fase 1) no hay abm de libreria capacidades
Validación de Delta Crítico: El sistema compara el coverage y provider_code entrante vs. el existente. Si hay cambios en coverage (Geografía/RATs) o provider_code: RECHAZA la actualización de este ítem específico. // CONSULTAR IVAN Error: 409 Conflict - Immutable Coverage in Use.
preguntar ivan
asos de Uso Código UCCapacidadCaso de UsoActorDescripciónFaseCAT-UC-01-02CAT-CAP-02Crear Footprint TécnicoAdmin MVNADefinir un Footprint técnico que represente una zona de cobertura geográfica y tecnológica reutilizable por múltiples Service Profiles.MVPCAT-UC-02-02CAT-CAP-02Modificar Footprint TécnicoAdmin MVNAActualizar la definición de un Footprint técnico existente.MVP Flujos Administrativos Normalizados FAN-CAT-01 --- Creación de Footprint Técnico Usado por: CAT-UC-01-02 Precondiciones El nombre del footprint debe ser único semánticamente para evitar confusión operativa. Pasos Canónicos Se ingresa un name descriptivo (ej. "Global Tier 1 - Data Only"). Composición de Cobertura (CoverageZone): Se ingresa la lista de países usando código estándar ISO-3166 (ej. AR, BR, US). Para cada país, se define la lista de RATs (Radio Access Technologies) permitidas (ej. 4G, NB-IoT, LTE-M). Validación: El sistema valida que los códigos de país y tecnologías existan en los diccionarios maestros. Se genera el footprint_id (UUID) y se guarda la estructura coverage como un JSONB inmutable. El Footprint queda disponible para ser asociado a múltiples Service Profiles. Resultado: El Footprint queda disponible para ser asociado a múltiples Service Profiles. FAN-CAT-02 --- Modificación de Footprint Técnico Usado por: CAT-UC-02-02 Precondiciones El Footprint existe. Pasos Canónicos El sistema consulta si este footprint_id está referenciado por alguna Versión de Service Profile que esté en estado ACTIVE. Caso A: Footprint "Libre" (Uso = 0): Permite la edición completa de la estructura coverage (países y tecnologías). Permite edición de name. Persiste los cambios y emite evento FootprintUpdated. - Caso B: Footprint "En Uso" (Uso > 0): Bloqueo de Estructura: El sistema rechaza (Error 409 Conflict) cualquier intento de modificar coverage (agregar/quitar países o RATs). Razón: Modificar esto alteraría el contrato técnico de productos que ya están vendidos/activos sin pasar por el ciclo de versionado del perfil. Excepción: Se permite modificar solo el name (metadato descriptivo) para correcciones ortográficas o de claridad. Si se rechaza por estar en uso, el mensaje debe instruir: "Este Footprint está en uso. Para cambiar la cobertura, cree un nuevo Footprint y asócielo a una nueva versión del Service Profile". Resultado: El Footprint queda actualizado.
dejar solmante los pasos para usar el json de footprint (usar precondicion de validar eschema de JSON)
consultar a IVAN que decisión tomamos sobre este punto: Bloqueo de Estructura: El sistema rechaza (Error 409 Conflict) cualquier intento de modificar coverage (agregar/quitar países o RATs). Razón: Modificar esto alteraría el contrato técnico de productos que ya están vendidos/activos sin pasar por el ciclo de versionado del perfil. Excepción: Se permite modificar solo el name (metadato descriptivo) para correcciones ortográficas o de claridad. Si se rechaza por estar en uso, el mensaje debe instruir: "Este Footprint está en uso. Para cambiar la cobertura, cree un nuevo Footprint y asócielo a una nueva versión del Service Profile".
CUANDO CREAMOS EL FOOTPRINT ( VA A TENER UN IDENTIFICADOR DE PROVEEDOR QUE LO ADMITE) ENTONCES CUANDO GENERO UN SERVICE PROFILE CON ESE FOOTPRINT, HEREDA LOS PROVEEDORES QUE ADMITEN ESE SERVICE PROFILE. --> DAR VUELTA CON IA, EN CASO DE QUE CIERRE, HABRIA QUE SACAR LA CAP 07
Reviewer #2 (Public review):
Summary:
The authors aimed to dissect the plasticity of circadian outputs by combining evolutionary biology with chronobiology. By utilizing Drosophila strains selected for "Late" and "Early" adult emergence, they sought to investigate whether selection for developmental timing co-evolves with plasticity in daily locomotor activity. Specifically, they examined how these diverse lines respond to complex, desynchronized environmental cues (temperature and light cycles) and investigated the molecular role of the splicing factor Psi and timeless isoforms in mediating this plasticity.
Major strengths and weaknesses:
The primary strength of this work is the novel utilization of long-term selection lines to address fundamental questions about how organisms cope with complex environmental cues. The behavioral data are compelling, clearly demonstrating that "Late" and "Early" flies possess distinct capabilities to track temperature cycles when they are desynchronized from light cycles.
However, a significant weakness lies in the causal links proposed between the molecular findings and these behavioral phenotypes. The molecular insights (Figures 2, 4, 5, and 6) rely on mRNA extracted from whole heads. As head tissue is dominated by photoreceptor cells and glia rather than the specific pacemaker neurons (LNv, LNd) driving these behaviors, this approach introduces a confound. Differential splicing observed here may reflect the state of the compound eye rather than the central clock circuit, a distinction highlighted by recent studies (e.g., Ma et al., PNAS 2023).
Furthermore, while the authors report that Psi mRNA loses rhythmicity under out-of-sync conditions, this correlation does not definitively prove that Psi oscillation is required for the observed splicing patterns or behavioral plasticity. The amplitude of the reported Psi rhythm is also low (~1.5 fold) and variable, raising questions about its functional significance in the absence of manipulation experiments (such as constitutive expression) to test causality.
Appraisal of aims and conclusions:
The authors successfully demonstrate the co-evolution of emergence timing and activity plasticity, achieving their aim on the behavioral level. However, the conclusion that the specific molecular mechanism involves the loss of Psi rhythmicity driving timeless splicing changes is not yet fully supported by the data. The current evidence is correlative, and without spatial resolution (specific clock neurons) or causal manipulation, the mechanistic model remains speculative.
This study is likely to be of significant interest to the chronobiology and evolutionary biology communities as it highlights the "enhanced plasticity" of circadian clocks as an adaptive trait. The findings suggest that plasticity to phase lags - common in nature where temperature often lags light - may be a key evolutionary adaptation. Addressing the mechanistic gaps would significantly increase the utility of these findings for understanding the molecular basis of circadian plasticity.
Author response:
Public Reviews:
Reviewer #1 (Public review):
Summary:
This manuscript addresses an important question: how do circadian clocks adjust to a complex rhythmic environment with multiple daily rhythms? The focus is on the temperature and light cycles (TC and LD) and their phase relationship. In nature, TC usually lags the LD cycle, but the phase delay can vary depending on seasonal and daily weather conditions. The authors present evidence that circadian behavior adjusts to different TC/LD phase relationships, that temperature-sensitive tim splicing patterns might underlie some of these responses, and that artificial selection for preferential evening or morning eclosion behavior impacts how flies respond to different LD/TC phase relationship
Strength:
Experiments are conducted on control strains and strains that have been selected in the laboratory for preferential morning or evening eclosion phenotypes. This study is thus quite unique as it allows us to probe whether this artificial selection impacted how animals respond to different environmental conditions, and thus gives hints on how evolution might shape circadian oscillators and their entrainment. The authors focused on circadian locomotor behavior and timeless (tim) splicing because warm and cold-specific transcripts have been described as playing an important role in determining temperature-dependent circadian behavior. Not surprisingly, the results are complex, but there are interesting observations. In particular, the "late" strain appears to be able to adjust more efficiently its evening peak in response to changes in the phase relationship between temperature and light cycles, but the morning peak seems less responsive in this strain. Differences in the circadian pattern of expression of different tim mRNA isoforms are found under specific LD/TC conditions.
We sincerely thank the reviewer for this generous assessment and for recognizing several key strengths of our study. We are particularly gratified that the reviewer values our use of long-term laboratory-selected chronotype lines (350+ generations), which provide a unique evolutionary perspective on how artificial selection reshapes circadian responses to complex LD/TC phase relationships—precisely our core research question.
Weaknesses:
These observations are interesting, but in the absence of specific genetic manipulations, it is difficult to establish a causative link between tim molecular phenotypes and behavior. The study is thus quite descriptive. It would be worth testing available tim splicing mutants, or mutants for regulators of tim splicing, to understand in more detail and more directly how tim splicing determines behavioral adaptation to different phase relationships between temperature and light cycles. Also, I wonder whether polymorphisms in or around tim splicing sites, or in tim splicing regulators, were selected in the early or late strains.
We thank the reviewer for this insightful comment. We agree that our current data do not establish a direct causal link between tim splicing (or Psi) and behaviour, and we appreciate that some of our wording (e.g. “linking circadian gene splicing to behavioural plasticity” or describing tim splicing as a “pivotal node”) may have suggested unintended causal links. In the revision, we will (i) explicitly state in the Abstract, Introduction, and early Discussion that the main aim was to test whether selection for timing of eclosion is accompanied by correlated evolution of temperature‑dependent tim splicing patterns and evening activity plasticity under complex LD/TC regimes, and (ii) consistently describe the molecular findings as correlational and hypothesis‑generating rather than causal. We will also add phrases throughout the text to point the reader more clearly to existing passages where we already emphasize “correlated evolution” and explicitly label our mechanistic ideas as “we speculate” / “we hypothesize” and as future experiments.
We fully agree that studies using tim splicing mutants or manipulations of splicing regulators under in‑sync and out‑of‑sync LD/TC regimes will be essential to ascertain what role tim variants play under such environmental conditions, and we will highlight this as a key future direction. At the same time, we emphasize that the long‑term selection lines provide a complementary perspective to classical mutant analyses by revealing how behavioural and molecular phenotypes can exhibit correlated evolution under a specific, chronobiologically relevant selection pressure (timing of emergence).
Finally, we appreciate the suggestion regarding polymorphisms. Whole‑genome analyses of these lines in a PhD thesis from our group (Ghosh, 2022, unpublished, doctoral dissertation) reveal significant SNPs in intronic regions of timeless in both Early and Late populations, as well as SNPs in CG7879, a gene implicated in alternative mRNA splicing, in the Late line. Because these analyses are ongoing and not yet peer‑reviewed, we do not present them as main results.
I also have a major methodological concern. The authors studied how the evening and morning phases are adjusted under different conditions and different strains. They divided the daily cycle into 12h morning and 12h evening periods, and calculated the phase of morning and evening activity using circular statistics. However, the non-circadian "startle" responses to light or temperature transitions should have a very important impact on phase calculation, and thus at least partially obscure actual circadian morning and evening peak phase changes. Moreover, the timing of the temperature-up startle drifts with the temperature cycles, and will even shift from the morning to the evening portion of the divided daily cycle. Its amplitude also varies as a function of the LD/TC phase relationship. Note that the startle responses and their changes under different conditions will also affect SSD quantifications.
We thank the reviewer for this perceptive methodological concern, which we had anticipated and systematically quantified but had not included in the original submission. The reviewer is absolutely correct that non-circadian startle responses to zeitgeber transitions could confound both circular phase (CoM) calculations and SSD quantifications, particularly as TC drift creates shifting startle locations across morning/evening windows.
We will be including startle response quantification (previously conducted but unpublished) as new a Supplementary figure, systematically measuring SSD in 1-hour windows immediately following each of the four environmental transitions (lights-ON, lights-OFF, temperature rise and temperature fall) across all six LDTC regimes (2-12hr TC-LD lags) for all 12 selection lines (early<sub>1-4</sub>, control<sub>1-4</sub>, late<sub>1-4</sub>).
Author response image 1.
Startle responses in selection lines under LDTC regimes: SSD calculated to assess startle response to each of the transitions (1-hour window after the transition used for calculations). Error bars are 95% Tukey’s confidence intervals for the main effect of selection in a two-factor ANOVA design with block as a random factor. Non-overlapping error bars indicate significant differences among the values. SSD values between in-sync and out-of-sync regimes for a range of phase relationships between LD and TC cycles (A) LDTC 2-hr, (B) LDTC 4-hr, (C) LDTC 6-hr, (D) LDTC 8-hr, (E) LDTC 10-hr, (F) LDTC 12-hr.
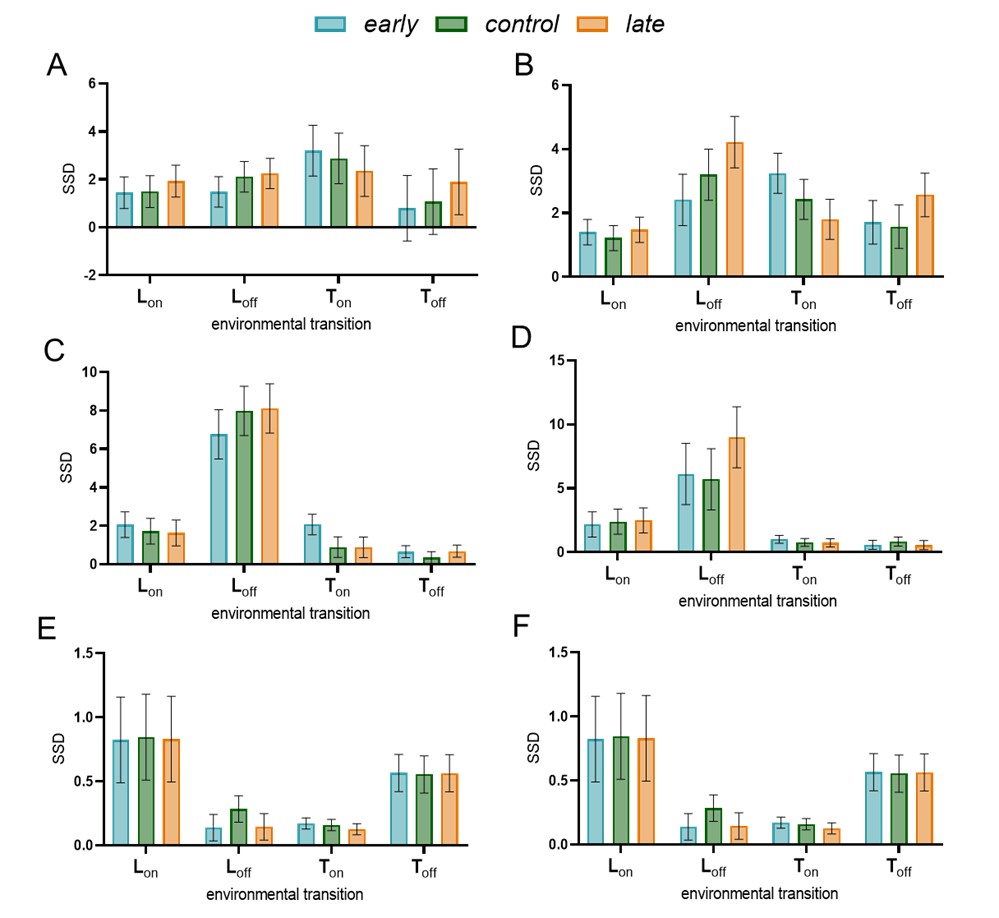
Key findings directly addressing the reviewer's concerns:
(1) Morning phase advances in LDTC 8-12hr regimes are explained by quantified nocturnal startle activity around temperature rise transitions occurring within morning windows. Critically, these startles show no selection line differences, confirming they represent equivalent non-circadian confounds across lines.
(2) Early selection lines exhibit significantly heightened startle responses specifically to temperature rise in LDTC 4hr and 6hr regimes (early > control ≥ late), demonstrating that startle responses themselves exhibit correlated evolution with emergence timing—an important novel finding that strengthens our evolutionary story.
(3) Startle responses differed among selection lines only for the temperature rise transition under two of the regimes used, LDTC 4 hr and 6 hr regimes. Under LDTC 4 hr, temperature rise transition falls in the morning window and despite early having significantly greater startle than late, the overall morning SSD (over 12 hours morning window) did not differ significantly among the selection lines for this regime. Thus, eliminating the startle window would make the selection lines more similar to one another. On the other hand, under LDTC 6 hour regime, the startle response to temperature rise falls in the evening 12 hour window. In this case too, early showed higher startle than control and late. A higher startle in early would thus, contribute to the observed differences among selection lines. We agree with the reviewer that eliminating this startle peak would lead to a clearer interpretation of the change in circadian evening activity.
We deliberately preserved all behavioural data without filtering out startle windows since it would require arbitrary cutoffs like 1 hr, 2 hr or 3 hours post transitions or until the startle peaks declines in different selection lines under different regimes. In the revised version, we will add complementary analyses excluding the startle windows to obtain mean phase and SSD values which are unaffected by the startle responses.
For the circadian phase, these issues seem, for example, quite obvious for the morning peak in Figure 1. According to the phase quantification on panel D, there is essentially no change in the morning phase when the temperature cycle is shifted by 6 hours compared to the LD cycle, but the behavior trace on panel B clearly shows a phase advance of morning anticipation. Comparison between the graphs on panels C and D also indicates that there are methodological caveats, as they do not correlate well.
Because of the various masking effects, phase quantification under entrainment is a thorny problem in Drosophila. I would suggest testing other measurements of anticipatory behavior to complement or perhaps supersede the current behavior analysis. For example, the authors could employ the anticipatory index used in many previous studies, measure the onset of morning or evening activity, or, if more reliable, the time at which 50% of anticipatory activity is reached. Termination of activity could also be considered. Interestingly, it seems there are clear effects on evening activity termination in Figure 3. All these methods will be impacted by startle responses under specific LD/TC phase relationships, but their combination might prove informative.
We agree that phase quantification under entrained conditions in Drosophila is challenging and that anticipatory indices, onset/offset measures, and T50 metrics each have particular strengths and weaknesses. In designing our analysis, we chose to avoid metrics that require arbitrary or subjective criteria (e.g. defining activity thresholds or durations for anticipation, or visually marking onset/offset), because these can substantially affect the estimated phase and reduce comparability across regimes and genotypes. Instead, we used two fully quantitative, parameter-free measures applied to the entire waveform within defined windows: (i) SSD to capture waveform change in shape/amplitude and (ii) circular mean phase of activity (CoM) restricted to the 12 h morning and 12 h evening windows. By integrating over the entire window, these measures are less sensitive to the exact choice of threshold and to short-lived, high-amplitude startles at transitions, and they treat all bins within the window in a consistent, reproducible way across all LDTC regimes and lines. Panels C (SSD) and D (CoM) are intentionally complementary, not redundant: SSD reflects how much the waveform changes in shape and amplitude, whereas CoM reflects the timing of the center of mass of activity. Under conditions where masking alters amplitude and introduces short-lived bouts without a major shift of the main peak, it is expected that SSD and CoM will not correlate linearly across regimes.
We will be including a detailed calculation of how CoM is obtained in our methods for the revised version.
Reviewer #2 (Public review):
Summary:
The authors aimed to dissect the plasticity of circadian outputs by combining evolutionary biology with chronobiology. By utilizing Drosophila strains selected for "Late" and "Early" adult emergence, they sought to investigate whether selection for developmental timing co-evolves with plasticity in daily locomotor activity. Specifically, they examined how these diverse lines respond to complex, desynchronized environmental cues (temperature and light cycles) and investigated the molecular role of the splicing factor Psi and timeless isoforms in mediating this plasticity.
Major strengths and weaknesses:
The primary strength of this work is the novel utilization of long-term selection lines to address fundamental questions about how organisms cope with complex environmental cues. The behavioral data are compelling, clearly demonstrating that "Late" and "Early" flies possess distinct capabilities to track temperature cycles when they are desynchronized from light cycles.
We sincerely thank the reviewer for this enthusiastic recognition of our study's core strengths. We are particularly gratified that the reviewer highlights our novel use of long-term selection lines (350+ generations) as the primary strength, enabling us to address fundamental evolutionary questions about circadian plasticity under complex environmental cues. We thank them for identifying our behavioral data as compelling (Figs 1, 3), which robustly demonstrate selection-driven divergence in temperature cycle tracking.
However, a significant weakness lies in the causal links proposed between the molecular findings and these behavioral phenotypes. The molecular insights (Figures 2, 4, 5, and 6) rely on mRNA extracted from whole heads. As head tissue is dominated by photoreceptor cells and glia rather than the specific pacemaker neurons (LNv, LNd) driving these behaviors, this approach introduces a confound. Differential splicing observed here may reflect the state of the compound eye rather than the central clock circuit, a distinction highlighted by recent studies (e.g., Ma et al., PNAS 2023).
We thank the reviewer for highlighting this important methodological consideration. We fully agree that whole-head extracts do not provide spatial resolution to distinguish central pacemaker neurons (~100-200 total) from compound eyes and glia, and that cell-type-specific profiling represents the critical next experimental step. As mentioned in our response to Reviewer 1, we appreciate the issue with our phrasing and will be revising it accordingly to more clearly describe that we do not claim any causal connections between expression of the tim splice variants in particular circadian neurons and their contribution of the phenotype observed.
We chose whole-head extracts for practical reasons aligned with our study's specific goals:
(1) Fly numbers: Our artificially selected populations are maintained at large numbers (~1000s per line). Whole-head extracts enabled sampling ~150 flies per time point = ~600 flies per genotype per environmental, providing means to faithfully sample the variation that may exist in such randomly mating populations.
(2) Established method for characterizing splicing patterns: The majority of temperature-dependent period/timeless splicing studies have successfully used whole-head extracts (Majercak et al., 1999; Shakhmantsir et al., 2018; Martin Anduaga et al., 2019) to characterize splicing dynamics under novel conditions.
(3) Novel environmental regimes: Our primary molecular contribution was documenting timeless splicing patterns under previously untested LDTC phase relationships (TC 2-12hr lags relative to LD) and testing whether these exhibit selection-dependent differences consistent with behavioral divergence.
Furthermore, while the authors report that Psi mRNA loses rhythmicity under out-of-sync conditions, this correlation does not definitively prove that Psi oscillation is required for the observed splicing patterns or behavioral plasticity. The amplitude of the reported Psi rhythm is also low (~1.5 fold) and variable, raising questions about its functional significance in the absence of manipulation experiments (such as constitutive expression) to test causality.
We thank the reviewer for this insightful comment and appreciate that our phrasing has been misleading. We will especially pay attention to this issue, raised by two reviewers, and clearly highlight our results as correlated evolution and hypothesis-generating.
We appreciate the reviewer highlighting these points and would like to draw attention to the following points in our Discussion section:
“Psi and levels of tim-cold and tim-sc (Foley et al., 2019). We observe that this correlation is most clearly upheld under temperature cycles wherein tim-medium and Psi peak in-phase while the cold-induced transcripts start rising when Psi falls (Figure 8A1&2). Under LDTC in-sync conditions this relationship is weaker, even though Psi is rhythmic, potentially due to light-modulated factors influencing timeless splicing (Figure 8B1&2). This is in line with Psi’s established role in regulating activity phasing under TC 12:12 but not LD 12:12 (Foley et al., 2019). This is also supported by the fact that while tim-medium and tim-cold are rhythmic under LD 12:12 (Shakhmantsir et al., 2018), Psi is not (datasets from Kuintzle et al., 2017; Rodriguez et al., 2013). Assuming this to be true across genetic backgrounds and sexes and combined with our similar findings for these three transcripts under LDTC out-of-sync (Figure 2B3, D3&E3), we speculate that Psi rhythmicity may not be essential for tim-medium or tim-cold rhythmicity especially under conditions wherein light cycles are present along with temperature cycles (Figure 8C1&2). Our study opens avenues for future experiments manipulating PSI expression under varying light-temperature regimes to dissect its precise regulatory interactions. We hypothesize that flies with Psi knocked down in the clock neurons should exhibit a less pronounced shift of the evening activity under the range LDTC out-of-sync conditions for which activity is assayed in our study. On the other hand, its overexpression should cause larger delays in response to delayed temperature cycles due to the increased levels of tim-medium translating into delay in TIM protein accumulation.”
Appraisal of aims and conclusions:
The authors successfully demonstrate the co-evolution of emergence timing and activity plasticity, achieving their aim on the behavioral level. However, the conclusion that the specific molecular mechanism involves the loss of Psi rhythmicity driving timeless splicing changes is not yet fully supported by the data. The current evidence is correlative, and without spatial resolution (specific clock neurons) or causal manipulation, the mechanistic model remains speculative.
This study is likely to be of significant interest to the chronobiology and evolutionary biology communities as it highlights the "enhanced plasticity" of circadian clocks as an adaptive trait. The findings suggest that plasticity to phase lags - common in nature where temperature often lags light - may be a key evolutionary adaptation. Addressing the mechanistic gaps would significantly increase the utility of these findings for understanding the molecular basis of circadian plasticity.
Thank you for this thoughtful appraisal affirming our successful demonstration of co-evolution between emergence timing and circadian activity plasticity.
Reviewer #3 (Public review):
Summary:
This study attempts to mimic in the laboratory changing seasonal phase relationships between light and temperature and determine their effects on Drosophila circadian locomotor behavior and on the underlying splicing patterns of a canonical clock gene, timeless. The results are then extended to strains that have been selected over many years for early or late circadian phase phenotypes.
Strengths:
A lot of work, and some results showing that the phasing of behavioural and molecular phenotypes is slightly altered in the predicted directions in the selected strains.
We thank the reviewer for acknowledging the substantial experimental effort across 7 environmental regimes (6 LDTC phase relationships + LDTC in-phase), 12 replicate populations (early<sub>1-4</sub>, control<sub>1-4</sub>, late<sub>1-4</sub>), and comprehensive behavioural + molecular phenotyping.
Weaknesses:
The experimental conditions are extremely artificial, with immediate light and temperature transitions compared to the gradual changes observed in nature. Studies in the wild have shown how the laboratory reveals artifacts that are not observed in nature. The behavioural and molecular effects are very small, and some of the graphs and second-order analyses of the main effects appear contradictory. Consequently, the Discussion is very speculative as it is based on such small laboratory effects.
We thank the reviewer for these important points regarding ecological validity, effect sizes, and interpretation scope.
(1) Behavioural effects are robust across population replicates in selection lines (not small/weak)
Our study assayed 12 populations total (4 replicate populations each of early, control, and late selection lines) under 7 LDTC regimes. Critically, selection effects were consistent across all 4 replicate populations within each selection line for every condition tested. In these randomly mating large populations, the mixed model ANOVA reveals highly significant selection×regime interactions [F(5,45)=4.1, p=0.003; Fig 3E, Table S2], demonstrating strong, replicated evolutionary divergence in evening temperature sensitivity.
(2) Molecular effects test critical evolutionary hypothesis
As stated in our Introduction, "selection can shape circadian gene splicing and temperature responsiveness" (Low et al., 2008, 2012). Our laboratory-selected chronotype populations—known to exhibit evolved temperature responsiveness (Abhilash et al., 2019, 2020; Nikhil et al., 2014; Vaze et al., 2012)—provide an apt system to test whether selection for temporal niche leads to divergence in timeless splicing. With ~600 heads per environmental regime per selection line, we detect statistically robust, selection line-specific temporal profiles [early4 advanced timeless phase (Fig 4A4); late4 prolonged tim-cold (Fig 5A4); significant regime×selection×time interactions (Tables S3-S5)], providing initial robust evidence of correlated molecular evolution under novel LDTC regimes.
(3) Systematic design fills critical field gap
Artificial conditions like LD/DD have been useful in revealing fundamental zeitgeber principles. Our systematic 2-12hr TC-LD lags directly implement Pittendrigh & Bruce (1959) + Oda & Friesen (2011) validated design, which discuss how such experimental designs can provide a more comprehensive understanding of zeitgeber integration compared to studies with only one phase jump between two zeitgebers.
(4) Ramping regimes as essential next step
Gradual ramping regimes better mimic nature and represent critical future experiments. New Discussion addition in the revised version: "Ramping LDTC regimes can test whether selection-specific zeitgeber hierarchy persists under naturalistic gradients." While ramping experiments are essential, we would like to emphasize that we aimed to use this experimental design as a tool to test if evening activity exhibits greater temperature sensitivity and if this property of the circadian system can undergo correlated evolution upon selection for timing of eclosion/emergence.
(5) New startle quantification addresses masking
Our startle quantification (which will be added as a new supplementary figure) confirms circadian evening tracking persists despite quantified, selection-independent masking in most of the regimes.
Opción B (Clone): El Admin puede solicitar "Basar en v2". El sistema copia la Spec (Footprint + Capabilities + References) de la versión anterior hacia la nueva v3.
lo sacamos por fase 1
Benefício
Há lacunas na coluna "Benefício" que estão vazias. Manter assim?
Figura 1: Área do SISCEAB
Valores diferem do contido na tabela1 que se encontra na pasta Apoio.
Dit besluit wordt binnen 2 jaar na inwerkingtreding geëvalueerd waarbij ook op de werking van de nieuwe structuur wordt ingegaan. Vervolgens vindt evaluatie plaats wanneer daar aanleiding voor is.
Dat zou in 2024 zijn geweest. Maar is kennelijk nog van kracht zonder wijziging. En zou dan nu ongeveer opnieuw moeten worden geevalueerd, voorjaar 2026. #openvraag komt met het nieuwe kabinet dit besluit onder druk?
The variants confirmed in this family were MYH7-A934V and MYH7-E1387K (Fig. 3A).
Variants that cause HCM.
L'École au Cœur des Valeurs de la République : Faire Vivre l'Égalité, la Mixité et la Réussite
Ce document de synthèse analyse les interventions de la table ronde organisée par l'INSPÉ Lille HdF, portant sur l'incarnation des valeurs républicaines au sein des établissements scolaires.
Le constat central est que la transmission des valeurs ne peut se limiter à un discours théorique ; elle nécessite une approche systémique touchant à la fois la pédagogie, le pilotage institutionnel et l'aménagement physique des lieux.
Les points clés identifiés sont :
• L'éducabilité comme principe moteur : Reconnaître l'aptitude de chaque élève à être éduqué et transformé par l'école est le socle de l'engagement professionnel.
• La mixité sociale harmonieuse : L'expérimentation montre que le brassage de populations sociologiquement opposées favorise la tolérance et réduit le décrochage, à condition d'être soutenu par un projet fort.
• Le levier du « bâti » et de l'accueil : La matérialisation des valeurs (beauté des lieux, aménagement convivial) est un facteur déterminant pour le bien-être et le respect mutuel.
• La complexité de la notion de « réussite » : Des recherches en psychologie sociale alertent sur le fait qu'une focalisation étroite sur la performance peut paradoxalement nuire aux attitudes inclusives des enseignants.
--------------------------------------------------------------------------------
L'ancrage des valeurs républicaines en milieu scolaire repose sur des piliers éthiques et professionnels partagés par les acteurs de terrain.
L'éducabilité est définie comme la reconnaissance de l'aptitude de chaque individu à recevoir une éducation et à évoluer par son intermédiaire.
• Une obligation pour les professionnels : Ce principe oblige les personnels de l'éducation à développer des relations de confiance, à valoriser l'élève et à pratiquer une bienveillance éducative constante.
• Finalité : L'objectif est de permettre aux jeunes de s'instruire, de s'émanciper et de devenir des citoyens actifs et éclairés.
La transmission des valeurs est présentée comme une mission impossible à mener de manière isolée.
• Le travail d'équipe : Que ce soit au sein des équipes académiques « Valeurs de la République » ou au niveau des établissements, le collectif est essentiel pour penser et agir.
• L'articulation des échelles : L'action doit se situer à la confluence de l'individuel (posture de l'enseignant), du collectif (classe/établissement) et de l'institutionnel (Académie).
--------------------------------------------------------------------------------
L'égalité n'est pas seulement un principe constitutionnel (Article 6 de la DDHC), c'est une pratique quotidienne qui se décline en plusieurs dimensions.
• Pédagogie universelle : L'enjeu est d'identifier et de lever les obstacles qui empêchent certains élèves d'accéder aux compétences (par exemple, permettre l'accès au savoir en histoire même si la lecture n'est pas maîtrisée).
• Donner plus à ceux qui ont des besoins particuliers : L'égalité en établissement se traduit souvent par l'équité, c'est-à-dire l'adaptation des moyens aux besoins spécifiques des élèves, notamment dans le cadre de l'école inclusive.
Des travaux de recherche en psychologie sociale mettent en lumière une tension entre les objectifs de performance et d'inclusion :
• Risque de rejet de l'inclusion : Lorsque le système éducatif valorise exclusivement la réussite au sens de la performance et du développement des compétences, les enseignants peuvent développer des attitudes plus négatives à l'égard de l'éducation inclusive.
• Nécessité d'une définition large : La réussite doit être associée à l'épanouissement et au bien-être pour ne pas devenir un facteur d'exclusion.
--------------------------------------------------------------------------------
L'exemple du collège Berlioz à Paris (18e arrondissement) illustre la mise en œuvre concrète de la mixité sociale et de la lutte contre les déterminismes.
Pour contrer un évitement scolaire massif (50 %) et un ghetto social, deux établissements (un très favorisé et un très défavorisé) ont fusionné leurs effectifs par un système de niveaux alternés.
• Résultats : Apprentissage de la tolérance par la confrontation à l'autre, disparition quasi totale du décrochage scolaire, et absence d'exclusions définitives sur plusieurs années.
• Mixité harmonieuse : La diversité (origine sociale, culturelle, élèves en situation de handicap) crée un environnement où chacun trouve sa place.
Le cadre physique est un levier majeur pour le climat scolaire. Farid Bouelifa souligne l'importance d'un établissement « accueillant et beau » :
• Aménagements concrets : Installation de fontaines, de jardins pédagogiques, de fresques végétales, de drapeaux et de canapés dans les espaces communs.
• Symbolique : Utilisation des couleurs républicaines (bleu, blanc, rouge) de manière esthétique dans le bâti pour ancrer l'identité républicaine sans qu'elle soit vécue comme une contrainte.
--------------------------------------------------------------------------------
Pour transformer l'école en un « territoire vivant », plusieurs dispositifs et instances doivent être mobilisés.
Le Comité d'Éducation à la Santé, à la Citoyenneté et à l'Environnement (CESCE) est identifié comme un levier systémique majeur.
• Rôle : Définir la politique de prévention, lutter contre les discriminations et le harcèlement, et promouvoir l'égalité fille-garçon.
• Composition : Il permet de créer des « alliances éducatives » en associant parents, partenaires extérieurs, élèves (éco-délégués, élus CVL/CVC) et personnels de santé.
L'école ne doit pas être un territoire clos. L'interaction avec l'extérieur est vitale :
• Partenariats associatifs : Collaboration avec des structures locales (centres sociaux, associations) pour prendre en charge le jeune dans sa globalité.
• Sorties pédagogiques : Elles sont jugées aussi importantes que les cours, car elles permettent aux élèves issus de milieux défavorisés d'accéder à des lieux de culture (Louvre, Philharmonie, Versailles) qu'ils ne visiteraient jamais autrement.
--------------------------------------------------------------------------------
« Le principe d'éducabilité nous oblige, nous professionnels de l'éducation. C'est reconnaître l'aptitude de chacun à être éduqué. » — Sandrine Benavkir
« La mixité sociale, on apprend la tolérance à travers elle avec celui qui est différent de soi. » — Farid Bouelifa
« Parler de réussite, de performance, du développement des compétences... quand on proposait aux enseignants de lire ce magazine, ils avaient des attitudes bien plus négatives à l'égard de l'éducation inclusive. » — Anne-Laure Perrin
« L'école, c'est aussi parfois la parenthèse de ces élèves dans leur vie... leur faire sentir que ces valeurs de la République, eux peuvent les vivre à l'école. » — Anne-Laure Perrin
« Lorsque vous enseignez la tolérance au quotidien, c'est une manière de lutter contre tout : le harcèlement, l'homophobie, les discriminations. » — Farid Bouelifa
--------------------------------------------------------------------------------
Faire vivre les valeurs de la République en établissement exige de passer de l'affirmation (le discours) à l'incarnation (l'action).
Cela passe par un engagement collectif des personnels, une attention particulière portée au climat scolaire et une volonté politique de briser les ghettos sociaux par des dispositifs de mixité audacieux.
L'école doit être ce lieu où l'égalité des droits et des chances se traduit par une équité pédagogique et un respect profond de la singularité de chaque élève.
La SPL Clisson Sèvre et Loire
Destination Vignoble Nantais
L'Intelligence Artificielle en Milieu Scolaire : Transformer l'Illusion de Connaissance en Levier d'Apprentissage
Résumé Exécutif
L'intégration de l'intelligence artificielle (IA) dans le milieu éducatif présente un paradoxe : si elle facilite la production de contenus structurés, elle risque de favoriser une « illusion de connaissance » où l'élève externalise sa pensée sans réelle compréhension.
Ce document analyse une approche pédagogique visant à transformer l'IA, de simple outil de génération automatique, en un partenaire de réflexion, un assistant d'écriture et un tuteur de révision.
L'objectif central est de passer d'une utilisation passive à un usage actif et supervisé, permettant de renforcer l'esprit critique, la capacité d'argumentation et la maîtrise méthodologique des élèves, tout en respectant un cadre éthique et technique strict.
--------------------------------------------------------------------------------
L'émergence de l'IA générative crée un risque majeur pour l'apprentissage : la capacité de produire des devoirs rédigés sans effort intellectuel réel.
• Le concept d'illusion : Les élèves peuvent avoir l'impression de maîtriser un sujet parce qu'ils obtiennent un résultat immédiat et bien structuré, alors qu'ils ne font que survoler le contenu.
• L'externalisation de la pensée : L'outil risque de devenir un substitut au travail personnel, sortant des réponses « du chapeau » sans que l'élève puisse les justifier ou les expliquer.
• L'analogie de la calculatrice : À l'instar de l'arrivée des calculatrices en mathématiques, l'IA doit être perçue comme une « calculatrice pour les mots » (selon Sam Altman).
Une méta-analyse de 2003 démontre que l'usage de la calculatrice, lorsqu'elle est intégrée à l'enseignement, permet aux élèves de mieux se concentrer sur les concepts de base et la résolution de problèmes.
--------------------------------------------------------------------------------
L'une des fonctions clés identifiées est l'utilisation de l'IA pour structurer le raisonnement logique sans que l'outil ne se substitue à l'élève.
Pour éviter que l'IA ne réponde à la place de l'élève, un processus en plusieurs phases est préconisé :
1. Clarification du sujet : Analyse des termes et des mots-clés (ex: définir « mobiliser » ou « ensemble des sociétés » dans un sujet d'histoire).
2. Renforcement des idées : Aide à l'identification des axes majeurs et des acteurs concernés.
3. Organisation de l'argumentation : Élaboration conjointe d'un plan.
4. Structuration finale : Justification des choix argumentatifs.
• Dépassement de la peur de formuler : L'élève se concentre sur le fond de sa pensée.
• Empathie intellectuelle : En demandant à l'IA d'envisager des points de vue contraires, l'élève développe son esprit critique.
• Justification des choix : L'élève apprend à comprendre ce qu'il écrit en devant expliquer ses décisions à l'outil.
--------------------------------------------------------------------------------
Contre le « syndrome de la page blanche », l'IA agit comme un déclencheur plutôt que comme un auteur autonome.
| Fonction | Description de l'intervention | | --- | --- | | Aide à l'étincelle | Fournit le premier élan pour mettre les idées en mots. | | Vérification logique | Analyse la progression entre les parties du plan (ex: passage de la mobilisation humaine à la mobilisation des savoirs). | | Soutien méthodologique | Rappelle les attentes académiques (ex: structure d'une introduction : accroche, définition, problématique, plan). | | Affinement rédactionnel | Force une discussion pour améliorer la clarté sans générer le bloc de texte final d'un coup. |
--------------------------------------------------------------------------------
L'IA peut également remplir un rôle de soutien individualisé en orthographe et en révision.
Au lieu d'un correcteur automatique passif, l'IA est sollicitée comme un « professeur bienveillant » :
• Principe : Ne pas corriger à la place de l'élève.
• Méthode : Mettre les fautes en gras, expliquer la règle simplement, donner un exemple et laisser l'élève effectuer la correction activement.
L'IA peut tester la compréhension profonde de l'élève pour repérer les lacunes :
• Niveaux de questionnement : Progression des concepts fondamentaux vers des analyses plus complexes (ex: le rôle des colonies dans l'effort de guerre).
• Feedback constructif : L'outil doit valoriser les bonnes réponses tout en utilisant les erreurs comme des occasions d'apprentissage pédagogique.
--------------------------------------------------------------------------------
Pour que l'IA reste un outil au service de l'humain, son utilisation doit être encadrée par des principes stricts :
• Âge requis : Pas d'usage de l'IA avant la classe de 4ème.
• Plus-value pédagogique : Recourir à l'IA uniquement lorsqu'elle apporte une réelle valeur ajoutée à l'apprentissage.
• Transparence : Mentionner systématiquement l'usage de l'IA et citer son aide comme on citerait une source (référence au système de Martin Petters).
• Responsabilité environnementale et technique : Privilégier des solutions sobres écologiquement et respecter scrupuleusement la protection des données personnelles.
• Posture de l'élève : L'élève doit rester maître du processus en pratiquant, manipulant et confrontant les connaissances pour assurer une mémorisation durable.
Cet article n'est pas rédigé de façon équilibrée
Sa longueur crée un déséquilibre dans l'article, et donne à certains aspects de la page une importance disproportionnée au point d'en compromettre la neutralité. Améliorez-le ou discutez des points à vérifier. Motif : L'article indique que y a pléthore d'ouvrages sur les hommes incels mais quasi rien sur les femmes incels, or y a seulement deux lignes sur les hommes et au contraire plusieurs paragraphes sur les femmes..
Note: This preprint has been reviewed by subject experts for Review Commons. Content has not been altered except for formatting.
Learn more at Review Commons
Summary
The authors employed a genome-wide CRISPR-Cas9 screen to search for the genes selectively involved in the activation of ER stress sensor ATF6. Deletion of Slc33a1, which encodes a transporter of acetyl-CoA into the ER lumen, compromised the ATF6 pathway (as assessed by BiP::GFP reporter), while IRE1 and PERK were activated in basal conditions, in the absence of ER stress (as assessed by XBP1s::mCherry reporter and endogenous XBP1s and CHOP::GFP reporter). Moreover, IRE1, but not ATF6, replied to ER stress. Consistently, in Slc33a1Δ cells upon ER stress the levels of the processed N-ATF6α were significantly lowered compared to the parental cells, and microscopy study showed that in Slc33a1-deficient cells ATF6 is translocated to Golgi even in the absence of ER stress, but fails to reach the nucleus even after ER stress is imposed. Golgi-type sugar modification of ATF6α is decreased in Slc33a1Δ cells. These data show the importance of SLC33A1 for ATF6 processing and functioning through the mechanism which remains to be revealed.
Major comments.
Taken together, the reported data do support the conclusion about the role of SLC33A1 functioning in post-ER maturation of ATF6. Data and methods are presented in a reproducible way. Still, there are several issues worth attention.
Minor comments.
Referee cross-commenting
I agree with Reviewer 1 that the authors need to clarify that authors need to clarify better how exactly BiP::GFP reporter works and whether it reflects ATF6 activation (rev 1 pointed to unclear responsiveness of the reporter to ATF6 and I asked to show the level of BiP by WB and the scheme of the mechanisms of readouts of the reporters)
I also agree with the comment on 2-DG which for some experiments may not be the best choice to activate UPR (or as Reviewer 1 pointed out shouldn't be the only one used to induce UPR). I still think that there's no contradiction in partial cleavage of ATF6 and suppression of BiP::GFP in Slc33a1Δ cells if then (as authors show) it doesn't reach nucleus.
General assessment. The article shows the necessity of SLC33A1, a transporter of acetyl-CoA in ER lumen, for ATF6 processing and functioning. It is well-written. However, the molecular mechanism which underlies the link is yet to be discovered (and this is clearly mentioned by the authors).
The study is of interest for the basic research and of potential interest for clinical research.
My main field of expertise is UPR. While I have broad knowledge and interest in protein science in general, my experience with protein glycosylation is rather limited.
Esto debido a que bajo convergencia puntual, en nuestro caso es convergencia uniforme casi segura, se puede preservar la adaptabilidad, además el límite uniforme de funciones càdlàg es càdlàg.
Separar los argumentos para adaptabilidad y cadlag
Tabela
Essa tabela precisa de: 1. casa de milhar 2. virgula no lugar do ponto decimal 3. mostrar 1 casa decimal 4. Não quebrar linha na coluna de rotas
3.5 PARTICIPAÇÃO DA COMUNIDADE ATM
falta o numero 3.6 e 3.7 nos indices
A figura 3.31 precisa ser alterada, pois os aeródromos comentados abaixo já possuem dados de Capacidade Declarada de Chegada no DASHBOARD do CGNA - 1. SBDN - 3.3.3 (2023,2024,2025, respectivamente), 2. SBMG - 4.4.4.
Na Figura 3.30, o valor da capacidade de chegada no gráfico de SBGR de 2023 está em 32. O correto é 34. 32 é a taxa pico, não a capacidade de chegada.
Stratégies et Outils pour une Coopération Efficace en Milieu Scolaire
La coopération en classe ne se limite pas à un simple travail de groupe ; elle constitue un levier d'apprentissage puissant et une compétence citoyenne inscrite au socle commun (cycles 3 et 4).
Ce document synthétise les approches pédagogiques et les outils pragmatiques nécessaires pour transformer la coopération d'une contrainte organisationnelle en un moteur de réussite.
Les points clés incluent l'adoption d'une posture de « lâcher-prise » par l'enseignant, l'instauration d'un cadre structuré pour la gestion du bruit et des rôles, ainsi que l'utilisation d'outils de suivi visuels comme le tétraèdre.
L'évaluation, centrée sur la compétence coopérative elle-même plutôt que sur le seul produit final, s'avère essentielle pour l'autonomisation des élèves.
La coopération est définie comme l'acte d'apprendre ensemble par le partage d'idées, l'entraînement mutuel et la confrontation des points de vue.
Elle ne doit pas être perçue comme une simple modalité pratique, mais comme une mission fondamentale de l'école.
• Légitimité institutionnelle : La coopération est une compétence du socle commun de connaissances, de compétences et de culture. Elle fait l'objet d'un apprentissage explicite et d'une évaluation.
• Validation scientifique : Une étude publiée dans la revue Science en 2019 confirme que les étudiants apprennent mieux lorsqu'ils sont actifs, malgré une perception parfois inverse par rapport aux cours magistraux.
• Compétences transversales développées :
◦ Organisation et planification.
◦ Débat, argumentation et écoute active.
◦ Gestion des émotions et des conflits.
◦ Capacité à faire des concessions.
Pour réussir, l'enseignant doit accepter de modifier sa posture.
Le « lâcher-prise » ne signifie pas l'autogestion totale, mais la délégation et l'acceptation de l'imprévisible.
• Acceptation de l'erreur : Laisser les élèves chercher, se tromper et recommencer.
• Gestion de l'imprévu : Anticiper que les débats peuvent être houleux et que le niveau sonore augmentera.
• Constitution des groupes : Il n'existe pas de solution universelle.
Le choix (affinités, imposé ou aléatoire) dépend des objectifs pédagogiques et de la dynamique de la classe.
L'organisation peut évoluer au fil de l'année selon les besoins constatés.
L'environnement physique et sonore doit être rigoureusement pensé pour limiter les débordements.
Le chuchotement n'est pas inné ; il doit faire l'objet d'un enseignement.
Une technique consiste à faire placer la main sur la gorge pour sentir l'absence de vibration des cordes vocales lors du chuchotement.
• Signaux d'arrêt : Utiliser des outils pour préserver la voix de l'enseignant (buzzer, sonnerie, feux tricolores ou signal verbal prédéfini).
Si possible, privilégier une classe flexible avec des tables mobiles. Dans une salle classique, il est recommandé de :
• Créer des « coins groupes ».
• Anticiper les règles de circulation (notamment vers les ressources en autonomie) pour éviter les déplacements massifs.
Pour éviter d'être sollicité de manière anarchique, l'enseignant peut utiliser un code couleur par groupe :
| Couleur | Signification | | --- | --- | | Vert | Tout va bien, le groupe progresse. | | Bleu | Travail terminé ; demande de validation ou tutorat possible vers un autre groupe. | | Jaune | Question non urgente. | | Rouge | Blocage complet ; intervention urgente nécessaire. |
Afin d'éviter qu'un élève ne se retrouve isolé ou, à l'inverse, n'assume toute la charge de travail, des outils de distribution des tâches sont nécessaires.
• Cartes de rôles : Distribuer des fonctions précises (scribe, orateur/oratrice, modérateur/modératrice, meneur/meneuse).
Il est crucial de faire tourner ces rôles à chaque séance pour garantir l'équité.
• La méthode du « Placemat » : Utilisation d'une grande feuille divisée en cases individuelles entourant une case centrale de mise en commun.
Cela impose un temps de réflexion personnel avant la production collective.
L'évaluation doit porter sur la coopération en tant que compétence distincte de la production finale.
• Critères de réussite co-construits : Fournir une grille d'évaluation élaborée avec les élèves pour clarifier les attentes dès le début de l'année.
• L’Étoile de Sylvain Connac : Un outil d'auto-évaluation permettant aux élèves de porter un regard critique sur quatre axes :
1. L'entente au sein du groupe.
2. La qualité de l'écoute.
3. La compréhension des consignes et des notions.
4. La gestion du temps.
• Feedback de fin de séance : Consacrer un temps court (un mot ou une phrase par groupe) pour ajuster les modalités lors de la séance suivante.
La coopération est un processus évolutif qui requiert de la patience.
Commencer par des structures simples (travail en binôme, introduction progressive des rôles) permet de stabiliser le cadre avant de complexifier les dispositifs.
L'objectif final demeure l'autonomisation et la responsabilité des élèves au sein du collectif.
Guide Stratégique sur l'Intégration des Jeux Pédagogiques en Milieu Scolaire
L'intégration du jeu dans le cadre pédagogique n'est pas une simple activité ludique de divertissement, mais un levier puissant pour l'engagement des élèves et l'acquisition de compétences.
Ce document synthétise l'expertise de Solène Paris, enseignante expérimentée, sur la transformation des séquences de classe par le jeu.
La réussite de cette approche repose sur le respect de quatre piliers cognitifs (attention, engagement actif, retour d'information et consolidation) et sur une mise en œuvre progressive, allant du détournement de jeux existants à la création d'escape games complexes.
L'analyse souligne que la valeur pédagogique ne réside pas seulement dans l'activité elle-même, mais de manière critique dans la phase de débriefing, qui permet d'ancrer durablement les notions théoriques et les compétences transversales.
Bien que la préparation exige un investissement initial conséquent, les bénéfices en termes de motivation, de réduction des inégalités et de mémorisation constituent un avantage éducatif majeur.
--------------------------------------------------------------------------------
Pour être efficace, le jeu en classe doit dépasser le simple stade du "mot croisé" ou de l'activité occupationnelle.
Il doit s'aligner sur des principes de neurosciences et des objectifs sociaux.
Selon les travaux de Stanislas Dehaene, le jeu pédagogique doit impérativement mobiliser :
• L'attention : Capter et canaliser la concentration de l'élève sur l'objet d'apprentissage.
• L'engagement actif : L'élève ne doit pas être passif ; il doit agir, tester et s'impliquer.
• Le feedback (retour sur information) : Le jeu permet une correction immédiate et constructive.
• La consolidation : La répétition et l'expérience ludique favorisent la rétention à long terme.
Compétences et Valeurs Ajoutées
Le jeu développe une double typologie de compétences :
• Compétences Psychosociales (CPS) : Autonomie, gestion des émotions, coopération, persévérance et esprit d'initiative.
• Bénéfices Pédagogiques : Diversification des pratiques de classe, concrétisation des notions abstraites et remobilisation des élèves habituellement réfractaires ou en difficulté.
--------------------------------------------------------------------------------
L'adoption du jeu peut se faire de manière graduelle afin de limiter la charge de travail initiale de l'enseignant.
| Niveau | Approche | Exemples et Outils | | --- | --- | --- | | Niveau 1 : Débutant | Détournement de jeux populaires aux règles déjà connues. | Dobble (verrerie), 7 familles (réchauffement climatique), Jungle Speed (énergies), Domino (molécules). | | Niveau 2 : Apprenti | Adaptation ou création de jeux spécifiques à un besoin précis. | Damier de l'alimentation durable, jeux sur la précarité menstruelle. Utilisation de Canva pour le design. | | Niveau 3 : Numérique | Escape games en ligne. | Plateformes : Géniali, bibliothèque S’CAPE. | | Niveau 4 : Expert | Escape games physiques en classe entière. | Nécessite : énigmes, matériel dédié, gestion du temps et de la coopération. |
--------------------------------------------------------------------------------
L'introduction du jeu comporte des défis logistiques et pédagogiques que l'enseignant doit anticiper pour éviter le "moment de solitude" face à la classe.
• Le manque d'anticipation : Il est impératif de tester le jeu en petit comité avant de le lancer en classe entière pour identifier les bugs de conception ou les règles trop complexes.
• Le piège chronophage : Le jeu ne doit pas occuper tout le temps scolaire au détriment du programme. L'équilibre entre temps ludique et temps de synthèse est primordial.
• La gestion de classe : L'agitation, le bruit et les conflits potentiels doivent être encadrés par des règles claires et simples définies au préalable.
• La charge de préparation : Bien que lourde au départ (impression, plastification, conception), elle doit être vue comme un investissement réutilisable et améliorable sur plusieurs années.
--------------------------------------------------------------------------------
Le débriefing est l'étape la plus importante pour transformer une expérience agréable en un apprentissage effectif. Sans cette phase, l'élève risque de ne retenir que le divertissement.
1. Recueil des réactions à chaud : Permettre aux élèves d'exprimer leurs émotions et leur vécu (ce qu'ils ont aimé ou non).
2. Institutionnalisation des notions : Faire le lien direct entre les mécanismes du jeu et le contenu théorique (ex: relier une énigme sur le sucre aux concepts de dissolution, soluté et solvant).
3. Analyse des compétences transversales : Faire un retour sur la communication, la persévérance et la capacité à coopérer durant l'activité.
4. Suggestions d'amélioration : Impliquer les élèves dans l'évolution du support pour optimiser son efficacité future.
Pour maintenir l'engagement même durant le bilan, plusieurs méthodes sont suggérées :
• Outils numériques : Wooclap pour un feedback collectif instantané.
• Méthodes visuelles : Cartes mentales collectives ou "leçons à manipuler".
• Réflexion structurée : Utilisation de post-its ou du "placemat" (réflexion individuelle suivie d'une synthèse de groupe).
--------------------------------------------------------------------------------
Le jeu pédagogique constitue une "quête" exigeante mais gratifiante pour l'enseignant.
En s'appuyant sur des ressources existantes (sites académiques, blogs comme pédagodeseggo.fr ou la Team Ludens) et en respectant une structure rigoureuse incluant impérativement un débriefing, le jeu devient un outil de différenciation sociale et de réussite scolaire.
L'objectif ultime est de rendre les élèves acteurs de leurs apprentissages, cherchant et résolvant des problèmes "sans même s'en rendre compte".
Dynamiques de Classe et Construction des Inégalités Scolaires : Analyse de la Psychologie Sociale de l'Éducation
Ce document de synthèse examine les travaux de Sébastien Goudeau sur les mécanismes par lesquels les interactions quotidiennes en classe et les contextes scolaires contribuent à l'amplification des inégalités sociales.
Résumé Exécutif
L'analyse des situations scolaires révèle que l'école ne se contente pas de refléter les inégalités sociales préexistantes, elle tend à les amplifier par le biais de processus psychologiques et interactionnels. Les points clés identifiés sont :
• Le "Paradoxe du Monopoly" : Tout comme les joueurs de Monopoly attribuent leur succès à leur stratégie plutôt qu'à leur avantage financier initial, les élèves interprètent les écarts de réussite comme des différences de capacités intrinsèques.
• La Comparaison Sociale comme Menace : Les situations rendant la réussite des uns visible pour les autres (comme le fait de lever la main) génèrent un sentiment d'incompétence et un stress qui détériorent la performance des élèves issus de milieux populaires.
• Inégalités de Participation Orale : Dès l'école maternelle, les élèves de milieux favorisés bénéficient d'un temps de parole plus long et de sollicitations plus fréquentes de la part des enseignants, souvent de manière non intentionnelle.
• Leviers d'Action : Agir sur la "métacognition sociale" — la façon dont les élèves expliquent leurs réussites et échecs — et promouvoir une conception malléable de l'intelligence sont des pistes prometteuses pour réduire ces écarts.
--------------------------------------------------------------------------------
1. L'Origine des Inégalités : Capital Culturel et Familiarité Scolaire
Avant même l'entrée à l'école, des disparités marquées existent en fonction de l'origine sociale. Ces inégalités ne sont pas dues au hasard, mais à des contextes de socialisation différenciés.
La Construction du Capital Culturel
Le milieu familial influence l'acquisition de dispositions culturelles plus ou moins proches des attentes de l'école :
• Compétences précoces : Dès 1 ou 2 ans, des différences apparaissent dans la connaissance des lettres, l'identification des sons et la familiarité avec la littérature jeunesse.
• Pédagogisation de la vie quotidienne : Les familles favorisées transforment souvent des activités banales (ex: mettre le couvert en comptant les fourchettes) en opportunités d'apprentissage.
• Pratiques de socialisation : La fréquence des visites dans les musées, les bibliothèques et la durée des lectures partagées confèrent des savoirs hautement "rentables" en contexte scolaire.
Le Postulat de l'Éducabilité
Il est crucial de noter que l'échec des enfants de milieux populaires n'est pas lié à des déficiences génétiques ou familiales, mais à une inadéquation entre leurs dispositions initiales et les codes attendus par l'institution scolaire.
--------------------------------------------------------------------------------
2. Le Rôle de la Comparaison Sociale et de la Menace
La vie en classe impose une comparaison sociale permanente (notes, feedbacks, mains levées). Cette comparaison n'est pas neutre psychologiquement.
L'Impact de la Visibilité de la Réussite
Une étude menée dans 40 classes de 6e sur une tâche de lecture montre que :
• La visibilité pénalise : Lorsque l'on demande aux élèves de lever la main dès qu'ils ont fini une tâche, l'écart de performance entre les élèves de milieux populaires et favorisés s'accroît.
• La menace psychologique : Voir les autres réussir plus vite est perçu comme menaçant. Cela génère un stress et des émotions négatives qui consomment les ressources attentionnelles nécessaires à la tâche.
Preuve Expérimentale de la Familiarité
Pour prouver le rôle causal de la familiarité, une expérience a recréé artificiellement des avantages culturels avec un nouveau système d'écriture (symboles associés à des lettres) :
• Les élèves entraînés au préalable réussissent mieux, mais l'écart se creuse massivement lorsque la situation impose une comparaison sociale avec les élèves non entraînés.
• C'est le sentiment d'incompétence induit par la comparaison qui produit la baisse de performance.
--------------------------------------------------------------------------------
3. Dynamiques d'Interaction en École Maternelle
Bien que l'école maternelle vise à réduire les inégalités par le langage oral, les observations vidéo (dispositif à 360°) révèlent des biais persistants dans les échanges collectifs.
Inégalités dans la Prise de Parole
Les résultats préliminaires sur une centaine d'élèves montrent une asymétrie marquée selon l'origine sociale :
| Type de prise de parole | Élèves de milieux favorisés | Élèves de milieux populaires | | --- | --- | --- | | Sollicitée (par l'enseignant) | Plus fréquente et plus longue. | Moins fréquente et plus courte. | | Non sollicitée (spontanée) | Se saisissent davantage de la parole et la gardent plus longtemps. | Moins enclins à couper la parole ou à s'exprimer spontanément. |
Facteurs d'Influence
• Familiarité des codes : Les enseignants interrogent plus souvent les élèves familiers des postures langagières scolaires pour assurer le bon déroulement de la séance.
• Inégalités de genre : Des différences de participation apparaissent également, les filles s'exprimant moins sur des thématiques mathématiques que littéraires.
--------------------------------------------------------------------------------
4. Leviers d'Action et Perspectives
L'identification de ces mécanismes permet d'envisager des interventions ciblées pour limiter l'amplification des inégalités.
La Métacognition Sociale
La "métacognition sociale" désigne la manière dont les élèves interprètent les différences de réussite qu'ils observent.
• Intervention : Si l'on explique aux élèves que les écarts de réussite sont dus à des différences d'entraînement (causes externes/malléables) plutôt qu'à des capacités (causes internes/fixes), l'effet négatif de la comparaison sociale disparaît.
• Conception de l'intelligence : Promouvoir une vision dynamique de l'intelligence (malléable par l'effort) favorise la résilience et peut même transformer la comparaison sociale en "boost" de confiance.
Recommandations pour la Pratique Enseignante
• Interprétation de l'échec : Présenter la difficulté comme une étape normale et transitoire de l'apprentissage plutôt que comme une limite personnelle.
• Gestion de la parole : Prendre conscience des biais de sollicitation pour assurer une répartition plus équitable du temps de parole.
• Coopération : Utiliser le conflit socio-cognitif (désaccord entre pairs) pour stimuler l'apprentissage, tout en étant attentif à la répartition des rôles selon le niveau de compétence des élèves.
Contexte Structurel Français
Il est noté que la pression sur les élèves est accentuée en France par le lien très étroit entre diplôme et emploi, comparativement à des pays comme l'Allemagne ou les pays nordiques, où la sélection est plus tardive et la confiance en soi des élèves plus élevée dans les classements internationaux (PISA).
Reviewer #1 (Public review):
Summary:
The manuscript by Hao Jiang et al described a systematic approach to identify proline hydroxylation proteins. The authors implemented a proteomic strategy with HILIC-chromatographic separation and reported an identification with high confidence of 4993 sites from HEK293 cells (4 replicates) and 3247 sites from RCC4 cells with 1412 sites overlapping between the two cell lines. A small fraction of about 200 sites from each cell line were identified with HyPro immonium ion. The authors investigated the conditions and challenges of using HyPro immonium ions as a diagnostic tool. The study focused the validation analysis of Repo-man (CDCA2) proline hydroxylation comparing MS/MS spectra, retention time and diagnostic ions of purified proteins with corresponding synthetic peptides. Using SILAC analysis and recombinant enzyme assay, the study evaluated Repo-man HyPro604 as a target of PHD1 enzyme.
Strengths:
The study involved extensive LCMS runs for in-depth characterization of proline hydroxylation proteins including four replicated analysis of 293 cells and three replicated analysis of RCC4 cells with 32 HILIC fractions in each analysis. The identification of over 4000 confident proline hydroxylation sites from the two cell lines would be a valuable resource for the community. The characterization of Repo-man proline hydroxylation is a novel finding.
Weaknesses:
As a study mainly focused on methodology, there are some potential technical weaknesses discussed below.
(1) The study applied HILIC-based chromatographic separation with a goal to enrich and separate hydroxyproline containing peptides. The separation effects for peptides from 293 cells and RCC4 cells seems somewhat different (Figure 2A and Figure S1A), which may indicate that the application efficiency of the strategy may be cell line dependent.
(2) The study evaluated the HyPro immonium ion as a diagnostic ion for HyPro identification showcasing multiple influential factors and potential challenges. It is important to note that with only around 5% of the identifications had HyPro immonium ion, it would be very challenging to implement this strategy in a global LCMS analysis to either validate or invalidate HyPro identifications. In comparison, acetyllysine immonium ion was previously reported to be a useful marker for acetyllysine peptides (PMID: 18338905) and the strategy offered a sensitivity of 70% with a specificity of 98%.
(3) The authors aimed to identify potential PHD targets by comparing the HyPro proteins identified with or without PHD inhibitor FG-4592 treatment. The workflow followed a classification strategy, rather than a typical quantitative proteomics approach for comprehensive analysis.
(4) The authors performed inhibitor treatment and in vitro PHD1 enzyme assay to validate that Repo-man can be hydroxylated by PHD1. It remains unknown if PHD1 expression in cells is sufficient to stimulate Repo-man hydroxylation.
Author response:
The following is the authors’ response to the original reviews.
Public Reviews:
Reviewer #1 (Public review):
Summary:
The manuscript by Hao Jiang et al described a systematic approach to identify proline hydroxylation proteins. The authors implemented a proteomic strategy with HILIC-chromatographic separation and reported an identification of 4993 sites from HEK293 cells (4 replicates) and 3247 sites from RCC4 sites (3 replicates) with 1412 sites overlapping between the two cell lines. From the analysis, the authors identified 225 sites and 184 sites respectively from 293 and RCC4 cells with HyPro diagnostic ion. The identifications were validated by analyzing a few synthetic peptides, with a specific focus on Repo-man (CDCA2) through comparing MS/MS spectra, retention time, and diagnostic ions. With SILAC analysis and recombinant enzyme assay, the study showed that Repo-man HyPro604 is a target of the PHD1 enzyme.
Strengths:
The study involved extensive LC-MS analysis and was carefully implemented. The identification of over 4000 confident proline hydroxylation sites would be a valuable resource for the community. The characterization of Repo-man proline hydroxylation is a novel finding.
Weaknesses:
However, as a study mainly focused on methodology, the findings from the experimental data did not convincingly demonstrate the sensitivity and specificity of the workflow for site-specific identification of proline hydroxylation in global studies.
Proline hydroxylation is an enzymatic post translational protein modification, catalysed by prolyl Hydroxylases (PHDs), which can have profound biological significance, e.g. altering protein half-life and/or the stability of protein-protein interactions. Furthermore, there has been controversy in the field as to the true number of protein targets for PHDs in cells. Thus, there is a clear need for methods to enable the robust identification of genuine PHD targets and to reliably map sites of PHD-catalysed proline hydroxylation in proteins. We believe, therefore, that our methodology, as reported here in Jiang et al., is an important contribution towards this goal. We note that our methodology has already been used successfully by others
(https://doi.org/10.1016/j.mcpro.2025.100969). While further improvements in this methodology may of course be developed in future, we are not currently aware of any superior methods that have been reported previously in the literature. The criticism made by the reviewer notably does not include reference to any such alternative published methodology that interested researchers can use which would offer superior results to the approach we document in this study.
Major concerns:
(1) The study applied HILIC-based chromatographic separation with a goal of enriching and separating hydroxyproline-containing peptides. However, as the authors mentioned, such an approach is not specific to proline hydroxylation. In addition, many other chromatography techniques can achieve deep proteome fractionation such as high pH reverse phase fractionation, strong-cation exchange etc. There was no data in this study to demonstrate that the strategy offered improved coverage of proline hydroxylation proteins, as the identifications of the HyPro sites could be achieved through deep fractionation and a highly sensitive LCMS setup. The data of Figure 2A and S1A were somewhat confusing without a clear explanation of the heat map representations.
The data we present in this study demonstrate clearly that peptides with hydroxylated prolines are enriched in specific HILIC fractions (F10-F18), in comparison with total unfractionated peptides derived from cell extracts. We also refer the reviewer to our previously published study by Bensaddek et al (International Journal of Mass Spectrometry: doi:10.1016/j.ijms.2015.07.029), which was reference 41 in this study, in which we compared directly the performance of both HILIC and strong anionic exchange chromatography, (hSAX). This showed that HILIC provided superior enrichment to hSAX for enrichment of peptides containing hydroxylated proline residues. To clarify this point for readers, we have now included a specific reference to our previous study at the start of the Results section in our current revision. Currently, we use HILIC to provide a degree of enrichment for proline hydroxylated peptides because we are not aware of alternative chromatographic methods that in our hands provide better results.
We have included descriptions of the information shown in the heatmaps in the associated figure legends and captions.
(2) The study reported that the HyPro immonium ion is a diagnostic ion for HyPro identification. However, the data showed that only around 5% of the identifications had such a diagnostic ion. In comparison, acetyl-lysine immonium ion was previously reported to be a useful marker for acetyllysine peptides (PMID: 18338905), and the strategy offered a sensitivity of 70% with a specificity of 98%. In this study, the sensitivity of HyPro immonium ion was quite low. The authors also clearly demonstrated that the presence of immonium ion varied significantly due to MS settings, peptide sequence, and abundance. With further complications from L/I immonium ions, it became very challenging to implement this strategy in a global LC-MS analysis to either validate or invalidate HyPro identifications.
The reviewer appears to have misunderstood the point we make with regard to the identification of the immonium ion and its use as a diagnostic marker for proline hydroxylation in MS analyses. We do not claim that this immonium ion is an essential diagnostic marker for proline hydroxylation. As the reviewer notes, with respect to the acetyl-lysine modification, the corresponding immonium ion is often used in MS studies as a diagnostic for identification of specific post translational modifications. Previous studies have reported that the immonium ion for hydroxylated proline is detected when the transcription factor HIF is analysed, but is often absent with other putative PHD targets, which has been used as an argument that these targets are not genuine proline hydroxylation sites. We are not, therefore, introducing the idea in this study that the hydroxy-proline immonium ion is a required diagnostic marker for proline hydroxylation, but instead demonstrating that detection of this ion, at least in some peptide sequences, may require the use of higher MS collision energies than are typically required for routine peptide identification. We believe that this is an interesting observation that can help to clear up discussions in the literature regarding the true prevalence of PHD-catalysed proline hydroxylation in different target proteins. Our data suggest that, in future MS studies analysing suspected PHD target proteins, two different collision energy might need to be used, i.e., normal collision energy for the routine identification of a peptide, combined with use of a higher collision energy if the hydroxy-proline immonium ion was not already detected.
(3) The study aimed to apply the HILIC-based proteomics workflow to identify HyPro proteins regulated by the PHD enzyme. However, the quantification strategy was not rigorous. The study just considered the HyPro proteins not identified by FG-4592 treatment as potential PHD targeted proteins. There are a few issues. First, such an analysis was not quantitative without reproducibility or statistical analysis. Second, it did not take into consideration that data-dependent LC-MS analysis was not comprehensive and some peptide ions may not be identified due to background interferences. Lastly, FG-4592 treatment for 24 hrs could lead to wide changes in gene expressions and protein abundances. Therefore, it is not informative to draw conclusions based on the data for bioinformatic analysis.
We refer the reviewer to the data we present in this study using SILAC analysis, combined with our MS workflow. to achieve a more accurate quantitative picture of proline hydroxylation levels. While we agree that the point the reviewer makes is valid, regarding our data dependent LC-MS/MS analysis potentially not being comprehensive, this means, however, that we are potentially underestimating the true prevalence of proline hydroxylated peptides, not overestimating the level of these modified peptides. We also refer the reviewer to the accompanying study by Druker et al., (eLife 2025; doi.org/10.7554/eLife.108131.1) in which we present a detailed follow-on study demonstrating the functional significance of the novel proline hydroxylation site we detected in the protein RepoMan (CDCA2). Therefore, even if we have not achieved a fully comprehensive analysis of all proline hydroxylated peptides catalysed by PHD enzymes, we believe that we have advanced the field by documenting a workflow that is able to identify and validate novel PHD targets.
(4) The authors performed an in vitro PHD1 enzyme assay to validate that Repo-man can be hydroxylated by PHD1. However, Figure 9 did not show quantitatively PHD1-induced increase in Repo-man HyPro abundance and it is difficult to assess its reaction efficiency to compare with HIF1a HyPro.
The analysis shown in Figure 9 was not intended to quantify the efficiency of in vitro hydroxylation of RepoMan by PHD1, but rather to answer the question, ‘Can recombinant PHD1 alone hydroxylate P604 on RepoMan in vitro, yes or no?’. The data show that the answer here is ‘yes’. Clearly, the HIF peptide is a more efficient substrate in vitro for recombinant PHD1 than the RepoMan peptide and we have now included a statement in the Discussion that addresses the significance of this observation more directly.
Reviewer #2 (Public review):
Summary:
In this manuscript, Jiang et al. developed a robust workflow for identifying proline hydroxylation sites in proteins. They identified proline hydroxylation sites in HEK293 and RCC4 cells, respectively. The authors found that the more hydrophilic HILIC fractions were enriched in peptides containing hydroxylated proline residues. These peptides showed differences in charge and mass distribution compared to unmodified or oxidized peptides. The intensity of the diagnostic hydroxyproline iminium ion depended on parameters including MS collision energy, parent peptide concentration, and the sequence of amino acids adjacent to the modified proline residue. Additionally, they demonstrate that a combination of retention time in LC and optimized MS parameter settings reliably identifies proline hydroxylation sites in peptides, even when multiple proline residues are present.
Strengths:
Overall, the manuscript presents an advanced, standardized protocol for identifying proline hydroxylation. The experiments were well designed, and the developed protocol is straightforward, which may help resolve confusion in the field.
Weaknesses:
(1) The authors should provide a summary of the standard protocol for identifying proline hydroxylation sites in proteins that can easily be followed by others.
This is a good suggestion and we have now included a figure (Figure 10) with a summary of our workflow in the current revision.
(2) Cockman et al. proposed that HIF-α is the only physiologically relevant target for PHDs. Their approach is considered the gold standard for identifying PHD targets. Therefore, the authors should discuss the major progress they made in this manuscript that challenges Cockman's conclusion.
While we had mentioned the Cockman et al., paper in the Introduction, we had not focussed on this somewhat controversial issue. However, in response to the Reviewer’s request, we have now added a comment in the Discussion section in the current revision of how our new data address the proposal discussed previously by Cockman et al. In brief, we believe that our findings are not consistent with a model in which PHDs have no protein targets other than HIFs.
Reviewer #3 (Public review):
Summary:
The authors present a new method for detecting and identifying proline hydroxylation sites within the proteome. This tool utilizes traditional LC-MS technology with optimized parameters, combined with HILIC-based separation techniques. The authors show that they pick up known hydroxy-proline sites and also validate a new site discovered through their pipeline.
Strengths:
The manuscript utilizes state-of-the-art mass spectrometric techniques with optimized collision parameters to ensure proper detection of the immonium ions, which is an advance compared to other similar approaches before. The use of synthetic control peptides on the HILIC separation step clearly demonstrates the ability of the method to reliably distinguish hydroxy-proline from oxidized methionine - containing peptides. Using this method, they identify a site on CDCA2, which they go on to validate in vitro and also study its role in regulation of mitotic progression in an associated manuscript.
Weaknesses:
Despite the authors' claim about the specificity of this method in picking up the intended peptides, there is a good amount of potential false positives that also happen to get picked (owing to the limitations of MS-based readout), and the authors' criteria for downstream filtering of such peptides require further clarification. In the same vein, greater and more diverse cell-based validation approach will be helpful to substantiate the claims regarding enrichment of peptides in the described pathway analyses.
We of course agree that false positives may arise, as is true for essentially all PTM studies. There are two issues here; first, are identified sites technically correct? (i.e. not misidentifications from the MS data) and second, are the identified modifications of biological significance? We have addressed this using the popular MaxQuant software suite to evaluate the modifications identified and to control the false discovery rate (FDR) at both the precursor and protein level, as described in the manuscript. We are aware that false positives could arise from confusing oxidation of methionine with hydroxylation of proline. Therefore, to address the issue as to whether we could identify bona fide PHD protein targets outside of the HIF family, we adopted a conservative approach by simply filtering out peptides where there was a methionine residue within three amino acids of the predicted proline hydroxylation site. This was a pragmatic decision made to reduce the likelihood of false positives in our dataset and we recognise that this likely results in us overlooking some genuine proline hydroxylation sites that occur nearby methionine residues. To address the potential biological relevance of the proline hydroxylation sites identified, we analysed extracts from cells treated with FG inhibitors. Of course a detailed understanding of biological significance relies upon follow-on experimental analyses for each site, which we have performed for P604 on RepoMan in accompanying study by Druker et al., (eLife 2025; doi.org/10.7554/eLife.108131.1).
Recommendations for the authors:
Reviewer #1 (Recommendations for the authors):
(1) The finding that the immonium ion intensities of L/I did not increase with increasing collision energy was surprising. Was this specific to this synthetic peptide?
We agree this is an interesting and unexpected finding. We have no reason to believe that it is specific to synthetic peptides per se, but rather think this reflects an effect of amino acid composition in the peptides analysed. It will be interesting to explore this phenomenon in more detail in future.
(2) The sequence logos in Figure 4 seemed to lack any amino acid enrichment in most positions except for collagen peptides. Have these findings been tested with statistical analysis?
The results we show for sequence logo analysis were generated using WebLogo (10.1101/gr.849004) and correspond to an analysis of all proline hydroxylated peptides we detected across all cell lines and replicates analysed. The fact that collagens are highly abundant proteins with very high levels of proline hydroxylation likely explains why collagen peptides dominated the outcome of the sequence logo analysis. There is clearly scope for more detailed follow up analysis in future of the sequence specificity of proline hydroxylation sites in no- collagen proteins that are validated PHD targets.
(3) Overall figure quality was not ideal. The resolution and font sizes of figures should be carefully evaluated and adjusted. The figure legend should contain a title for the figure. Annotations of the figures were somewhat confusing.
We agree with the criticism of the figure resolution in the review copies - the lower resolution appears to have been generated after we had uploaded higher resolution original images. We are providing again higher resolution versions of all figures for the current revision.
Reviewer #3 (Recommendations for the authors):
Certain concerns regarding portions of the manuscript that need addressing:
(1) " These data show that two different cell lines show unique profiles of proteins with hydroxylated peptides." - It is difficult to conclusively say this statement after profiling the prolyl hydroxy proteome from just two cell lines, especially since the amino acids with the highest frequency in the most enriched peptides are similar in both cell lines.
We agree with this point and have changed the current revision to state instead, “This shows that each of the two cell lines analysed have distinct profiles.”
(2) "We noted that there was a high frequency of a methionine residues appearing either at the first, second, or even third positions after the HyPro site.." - according to the authors, claim, the advantage of their method was that they were able to overcome the limitation of older methods that couldn't separate methionine oxidation from proline hydroxylation. However, in this statement, they say that the high frequency of methionine residues may be because of the similar mass shift. These statements are contradictory. The authors should either tone down the claim or prove that those are indeed hydroxyproline sites. Is it possible that in the filtering step of excluding these high-frequency of methionine - containing peptides, we are losing potential positive hits for hydroxy-proline sites? What is the authors' take on this?
We respectfully do not agree that our, “statements are contradictory”, with respect to the potential confusion between identification of methionine oxidation and proline hydroxylation, but acknowledge that we have not explained this issue clearly enough. It is a fact that the similar mass shift resulting from proline hydroxylation and methionine oxidation is a technical challenge that can potentially lead to misidentifications in MS studies and that is what we state clearly in the manuscript. We have addressed this issue head on experimentally in this study and show using synthetic peptides how detailed analysis of specific proline hydroxylation sites in target proteins can be distinguished from methionine oxidation, based upon differential chromatographic behaviour of peptides with either hydroxylated proline or oxidised methionine, as well as by detailed analysis of fragmentation spectra. However, in the case of our global analysis, as we were not able to perform synthetic peptide comparisons for every putative site identified, we took the pragmatic approach of filtering out examples of peptides where a methionine residue was present within three residues of a potential proline hydroxylation site. This was done simply to reduce the possibility of misidentification in the set of novel proline hydroxylated peptides identified and we accept that as a consequence we are likely filtering out peptides that include bona fide proline hydroxylation sites. We have clarified this point in the current revision and hope to be able to address this issue more comprehensively in future studies.
(3) "Accordingly, a score cut-off of 40 for hydroxylated peptides and a localisation probability cut-off of more than 0.5 for hydroxylated peptides was performed." Could the authors shed more light and clarify what was the basis for this value of cut-off to be used in this filtering step? Is this sample dependent? What should be the criteria to determine this value?
We used MaxQuant software (10.1016/j.cell.2006.09.026), for PTM analysis, in which a localization probability score of 0.75 and score cut-off of 40 is a commonly used threshold to define high confidence. The reason that we used 0.5 at the first step was to investigate how likely it might be that the misassignment of delta m/z +16 Da (oxidation) on Methionine would affect the identification of hydroxylation on Proline. However, we note that in the final results set used for analysis, all putative proline hydroxylated peptides that had a Methionine residue near to the hydroxylated proline were disregarded as a pragmatic step to reduce the probability of false identifications.
(4) The authors are requested to kindly make the HPLC and MS traces more legible and use highresolution images, with clearly labeled values on the peaks. Kindly extract coordinates from the underlying data files to plot the curves if needed to make it clearer.
We have reviewed the clarity of all images and figures in the current revision.
(5) There seems to be no error bars in Figure 3, Figure 7E, and panels of Figure 8 with bar graphs. Are those single replicate data?
These specific figures are from single replicate data.
(6) For Figure 9C, the control with only PHD1 (no peptide) is missing.
The ‘no peptide control’ was not included in the figure because it is simply a blank lane and there is nothing to see.
Note: This response was posted by the corresponding author to Review Commons. The content has not been altered except for formatting.
Learn more at Review Commons
Reviewer #1 (Evidence, reproducibility and clarity (Required)):
Summary:
Damaris et al. perform what is effectively an eQTL analysis on microbial pangenomes of E. coli and P. aeruginosa. Specifically, they leverage a large dataset of paired DNA/RNA-seq information for hundreds of strains of these microbes to establish correlations between genetic variants and changes in gene expression. Ultimately, their claim is that this approach identifies non-coding variants that affect expression of genes in a predictable manner and explain differences in phenotypes. They attempt to reinforce these claims through use of a widely regarded promoter calculator to quantify promoter effects, as well as some validation studies in living cells. Lastly, they show that these non-coding variations can explain some cases of antibiotic resistance in these microbes.
Major comments
Are the claims and the conclusions supported by the data or do they require additional experiments or analyses to support them?
The authors convincingly demonstrate that they can identify non-coding variation in pangenomes of bacteria and associate these with phenotypes of interest. What is unclear is the extent by which they account for covariation of genetic variation? Are the SNPs they implicate truly responsible for the changes in expression they observe? Or are they merely genetically linked to the true causal variants. This has been solved by other GWAS studies but isn't discussed as far as I can tell here.
We thank the reviewer for their effective summary of our study. Regarding our ability to identify variants that are causal for gene expression changes versus those that only “tag” the causal ones, here we have to again offer our apologies for not spelling out the limitation of GWAS approaches, namely the difficulty in separating associated with causal variants. This inherent difficulty is the main reason why we added the in-silico and in-vitro validation experiments; while they each have their own limitations, we argue that they all point towards providing a causal link between some of our associations and measured gene expression changes. We have amended the discussion (e.g. at L548) section to spell our intention out better and provide better context for readers that are not familiar with the pitfalls of (bacterial) GWAS.
They need to justify why they consider the 30bp downstream of the start codon as non-coding. While this region certainly has regulatory impact, it is also definitely coding. To what extent could this confound results and how many significant associations to expression are in this region vs upstream?
We agree with the reviewer that defining this region as “non-coding” is formally not correct, as it includes the first 10 codons of the focal gene. We have amended the text to change the definition to “cis regulatory region” and avoided using the term “non-coding” throughout the manuscript. Regarding the relevance of this including the early coding region, we have looked at the distribution of associated hits in the cis regulatory regions we have defined; the results are shown in Supplementary Figure 3.
We quantified the distribution of cis associated variants and compared them to a 2,000 permutations restricted to the -200bp and +30bp window in both E. coli * (panel A) and P. aeruginosa* (panel B). As it can be seen, the associated variants that we have identified are mostly present in the 200bp region and the +30bp region shows a mild depletion relative to the random expectation, which we derived through a variant position shuffling approach (2,000 replicates). Therefore, we believe that the inclusion of the early coding region results in an appreciable number of associations, and in our opinion justify its inclusion as a putative “cis regulatory region”.
The claim that promoter variation correlates with changes in measured gene expression is not convincingly demonstrated (although, yes, very intuitive). Figure 3 is a convoluted way of demonstrating that predicted transcription rates correlate with measured gene expression. For each variant, can you do the basic analysis of just comparing differences in promoter calculator predictions and actual gene expression? I.e. correlation between (promoter activity variant X)-(promoter activity variant Y) vs (measured gene expression variant X)-(measured gene expression variant Y). You'll probably have to
We realize that we may not have failed to properly explain how we carried out this analysis, which we did exactly in the way the reviewer suggests here. We had in fact provided four example scatterplots of the kind the reviewer was requesting as part of Figure 4. We have added a mention of their presence in the caption of Figure 3.
Figure 7 it is unclear what this experiment was. How were they tested? Did you generate the data themselves? Did you do RNA-seq (which is what is described in the methods) or just test and compare known genomic data?
We apologize for the lack of clarity here; we have amended the figure’s caption and the corresponding section of the results (i.e. L411 and L418) to better highlight how the underlying drug susceptibility data and genomes came from previously published studies.
Are the data and the methods presented in such a way that they can be reproduced?
No, this is the biggest flaw of the work. The RNA-Seq experiment to start this project is not described at all as well as other key experiments. Descriptions of methods in the text are far too vague to understand the approach or rationale at many points in the text. The scripts are available on github but there is no description of what they correspond to outside of the file names and none of the data files are found to replicate the plots.
We have taken this critique to heart, and have given more details about the experimental setup for the generation of the RNA-seq data in the methods as well as the results sections. We have also thoroughly reviewed any description of the methods we have employed to make sure they are more clearly presented to the readers. We have also updated our code repository in order to provide more information about the meaning of each script provided, although we would like to point out that we have not made the code to be general purpose, but rather as an open documentation on how the data was analyzed.
Figure 8B is intended to show that the WaaQ operon is connected to known Abx resistance genes but uses the STRING method. This requires a list of genes but how did they build this list? Why look at these known ABx genes in particular? STRING does not really show evidence, these need to be substantiated or at least need to justify why this analysis was performed.
We have amended the Methods section (“Gene interaction analysis”, L799) to better clarify how the network shown in this panel was obtained. In short, we have filtered the STRING database to identify genes connected to members of the waa operon with an interaction score of at least 0.4 (“moderate confidence”), excluding the “text mining” field. Antimicrobial resistance genes were identified according to the CARD database. We believe these changes will help the readers to better understand how we derived this interaction.
Are the experiments adequately replicated and statistical analysis adequate?
An important claim on MIC of variants for supplementary table 8 has no raw data and no clear replicates available. Only figure 6, the in vitro testing of variant expression, mentions any replicates.
We have expanded the relevant section in the Methods (“Antibiotic exposure and RNA extraction”, L778) to provide more information on the way these assays were carried out. In short, we carried out three biological replicates, the average MIC of two replicates in closest agreement was the representative MIC for the strain. We believe that we have followed standard practice in the field of microbiology, but we agree that more details were needed to be provided in order for readers to appreciate this.
Minor comments
Specific experimental issues that are easily addressable..
Are prior studies referenced appropriately?
There should be a discussion of eQTLs in this. Although these have mostly been in eukaryotes a. https://doi.org/10.1038/s41588-024-01769-9 ; https://doi.org/10.1038/nrg3891.
We have added these two references, which provide a broader context to our study and methodology, in the introduction.
Line 67. Missing important citation for Ireland et al. 2020 https://doi.org/10.7554/eLife.55308
Line 69. Should mention Johns et al. 2018 (https://doi.org/10.1038/nmeth.4633) where they study promoter sequences outside of E. coli
Line 90 - replace 'hypothesis-free' with unbiased
We have implemented these changes.
Line 102 - state % of DEGs relative to the entire pan-genome
Given that the study is focused on identifying variants that were associated with changes in expression for reference genes (i.e. those present in the reference genome), we think that providing this percentage would give the false impression that our analysis include accessory genes that are not encoded by the reference isolate, which is not what we have done.
Figure 1A is not discussed in the text
We have added an explicit mention of the panels in the relevant section of the results.
Line 111: it is unclear what enrichment was being compared between, FIgures 1C/D have 'Gene counts' but is of the total DEGs? How is the p-value derived? Comparing and what statistical test was performed? Comparing DEG enrichment vs the pangenome? K12 genome?
We have amended the results and methods section, as well as Figure 1’s caption to provide more details on how this analysis was carried out.
Line 122-123: State what letters correspond to these COG categories here
We have implemented the clarifications and edits suggested above
Line 155: Need to clarify how you use k-mers in this and how they are different than SNPs. are you looking at k-mer content of these regions? K-mers up to hexamers or what? How are these compared. You can't just say we used k-mers.
We have amended that line in the results section to more explicitly refer to the actual encoding of the k-mer variants, which were presence/absence patterns for k-mers extracted from each target gene’s promoter region separately, using our own developed method, called panfeed. We note that more details were already given in the methods section, but we do recognize that it’s better to clarify things in the results section, so that more distracted readers get the proper information about this class of genetic variants.
Line 172: It would be VERY helpful to have a supplementary figure describing these types of variants, perhaps a multiple-sequence alignment containing each example
We thank the reviewer for this suggestion. We have now added Supplementary Figure 3, which shows the sequence alignments of the cis-regulatory regions underlying each class of the genetic marker for both E. coli and P. aeruginosa.
Figure 4: THis figure is too small. Why are WaaQ and UlaE being used as examples here when you are supposed to be explicitly showing variants with strong positive correlations?
We rearranged the figure’s layout to improve its readability. We agree that the correlation for waaQ and ulaE is weaker than for yfgJ and kgtP, but our intention was to not simply cherry-pick strong examples, but also those for which the link between predicted promoter strength and recorded gene expression was less obvious.
Figure 4: Why is there variation between variants present and variant absent? Is this due to other changes in the variant? Should mention this in the text somewhere
Variability in the predicted transcription rate for isolates encoding for the same variant is due to the presence of other (different) variants in the region surrounding the target variant. PromoterCalculator uses nucleotide regions of variable length (78 to 83bp) to make its predictions, while the variants we are focusing on are typically shorter (as shown in Figure 4). This results in other variants being included in the calculation and therefore slightly different predicted transcription rates for each strain. We have amended the caption of Figure 4 to provide a succinct explanation of these differences.
Line 359: Need to talk about each supplementary figure 4 to 9 and how they demonstrate your point.
We have expanded this section to more explicitly mention the contents of these supplementary figures and why they are relevant for the findings of this section (L425).
Are the text and figures clear and accurate?
Figure 4 too small
We have fixed the figure, as described above
Acronyms are defined multiple times in the manuscript, sometimes not the first time they are used (e.g. SNP, InDel)
Figure 8A - Remove red box, increase label size
Figure 8B - Low resolution, grey text is unreadable and should be darker and higher resolution
Line 35 - be more specific about types of carbon metabolism and catabolite repression
Line 67 - include citation for ireland et al. 2020 https://doi.org/10.7554/eLife.55308
Line 74 - You talk about looking in cis but don't specify how mar away cis is
Line 75 - we encoded genetic variants..... It is unclear what you mean here
Line 104 - 'were apart of operons' should clarify you mean polycistronic or multi-gene operons. Single genes may be considered operonic units as well.
We have addressed all the issues indicated above.
Figure 2: THere is no axis for the percents and the percents don't make sense relative to the bars they represent??
We realize that this visualization might not have been the most clear for readers, and have made the following improvement: we have added the number of genes with at least one association before the percentage. We note that the x-axis is in log scale, which may make it seem like the light-colored bars are off. With the addition of the actual number of associated genes we think that this confusion has been removed.
Figure 2: Figure 2B legend should clarify that these are individual examples of Differential expression between variants
Line 198-199: This sentence doesn't make sense, 'encoded using kmers' is not descriptive enough
Line 205: Should be upfront about that you're using the Promoter Calculator that models biophysical properties of promoter sequences to predict activity.
Line 251: 'Scanned the non-coding sequences of the DEGs'. This is far too vague of a description of an approach. Need to clarify how you did this and I didn't see in the method. Is this an HMM? Perfect sequence match to consensus sequence? Some type of alignment?
Line 257-259: This sentence lacks clarity
We have implemented all the suggested changes and clarified the points that the reviewer has highlighted above.
Line346: How were the E. coli isolates tested? Was this an experiment you did? This is a massive undertaking (1600 isolates * 12 conditions) if so so should be clearly defined
While we have indicated in the previous paragraph that the genomes and antimicrobial susceptibility data were obtained from previously published studies, we have now modified this paragraph (e.g. L411 and L418) slightly to make this point even clearer.
Figure 6A: The tile plot on the right side is not clearly labeled and it is unclear what it is showing and how that relates to the bar plots.
In the revised figure, we have clarified the labeling of the heatmap to now read “Log2(Fold Change) (measured expression)” to indicate that it represents each gene’s fold changes obtained from our initial transcriptomic analysis. We have also included this information in the caption of the figure, making the relationship between the measured gene expression (heatmap) and the reporter assay data (bar plots) clear to the reader.
FIgure 6B: typo in legend 'Downreglation'
We thank the review for pointing this out. The typo has been corrected to “Down regulation” in the revised figure.
Line 398: Need to state rationale for why Waaq operon is being investigated here. WHy did you look into individual example?
We thank the reviewer for asking for a clarification here. Our decision to investigate the waaQ gene was one of both biological relevance and empirical evidence. In our analysis associating non-coding variants with antimicrobial resistance using the Moradigaravand et al. dataset, we identified a T>C variant at position 3808241 that was associated with resistance to Tobramycin. We also observed this variant in our strain collection, where it was associated with expression changes of the gene, suggesting a possible functional impact. The waa operon is involved in LPS synthesis, a central determinant of the bacteria’s outer membrane integrity and a well established virulence factor. This provided a plausible biological mechanism through which variation could influence antimicrobial susceptibility. As its role in resistance has not been extensively characterized, this represents a good candidate for our experimental validation. We have now included this rationale in our revised manuscript (i.e. L476).
Figure 8: Can get rid of red box
We have now removed the red box from Figure 8 in the revised version.
Line 463 - 'account for all kinds' is too informal
Mix of font styles throughout document
We have implemented all the suggestions and formatting changes indicated above.
Reviewer #2 (Evidence, reproducibility and clarity (Required)):
In their manuscript "Cis non-coding genetic variation drives gene expression changes in the E. coli and P. aeruginosa pangenomes", Damaris and co-authors present an extensive meta-analysis, plus some useful follow up experiments, attempting to apply GWAS principles to identify the extent to which differences in gene expression between different strains within a given species can be directly assigned to cis-regulatory mutations. The overall principle, and the question raised by the study, is one of substantial interest, and the manuscript here represents a careful and fascinating effort at unravelling these important questions. I want to preface my review below (which may otherwise sound more harsh than I intend) with the acknowledgment that this is an EXTREMELY difficult and challenging problem that the authors are approaching, and they have clearly put in a substantial amount of high quality work in their efforts to address it. I applaud the work done here, I think it presents some very interesting findings, and I acknowledge fully that there is no one perfect approach to addressing these challenges, and while I will object to some of the decisions made by the authors below, I readily admit that others might challenge my own suggestions and approaches here. With that said, however, there is one fundamental decision that the authors made which I simply cannot agree with, and which in my view undermines much of the analysis and utility of the study: that decision is to treat both gene expression and the identification of cis-regulatory regions at the level of individual genes, rather than transcriptional units. Below I will expand on why I find this problematic, how it might be addressed, and what other areas for improvement I see in the manuscript:
We thank the reviewer for their praise of our work. A careful set of replies to the major and minor critiques are reported below each point.
In the entire discussion from lines roughly 100-130, the authors frequently dissect out apparently differentially expressed genes from non differentially expressed genes within the same operons... I honestly wonder whether this is a useful distinction. I understand that by the criteria set forth by the authors it is technically correct, and yet, I wonder if this is more due to thresholding artifacts (i.e., some genes passing the authors' reasonable-yet-arbitrary thresholds whereas others in the same operon do not), and in the process causing a distraction from an operon that is in fact largely moving in the same direction. The authors might wish to either aggregate data in some way across known transcriptional units for the purposes of their analysis, and/or consider a more lenient 'rescue' set of significance thresholds for genes that are in the same operons as differentially expressed genes. I would favor the former approach, performing virtually all of their analysis at the level of transcriptional units rather than individual genes, as much of their analysis in any case relies upon proper assignment of genes to promoters, and this way they could focus on the most important signals rather than get lots sometimes in the weeds of looking at every single gene when really what they seem to be looking at in this paper is a property OF THE PROMOTERS, not the genes. (of course there are phenomena, such as rho dependent termination specifically titrating expression of late genes in operons, but I think on the balance the operon-level analysis might provide more insights and a cleaner analysis and discussion).
We agree with the reviewer that the peculiar nature of transcription in bacteria has to be taken into account in order to properly quantify the influence of cis variants in gene expression changes. We therefore added the exact analysis the reviewer suggested; that is, we ran associations between the variants in cis to the first gene of each operon and a phenotype that considered the fold-change of all genes in the operon, via a weighted average (see Methods for more details). As reported in the results section (L223), we found a similar trend as with the original analysis: we found the highest proportion of associations when encoding cis variants using k-mers (42% for E. coli and 45% for P. aeruginosa). More importantly, we found a high degree of overlap between this new “operon-level” association analysis and the original one (only including the first gene in each operon). We found a range of 90%-94% of associations overlapping for E. coli and between 75% and 91% for P. aeruginosa, depending on the variant type. We note that operon definitions are less precise for P. aeruginosa, which might explain the higher variability in the level of overlap. We have added the results of this analysis in the results section.
This also leads to a more general point, however, which I think is potentially more deeply problematic. At the end of the day, all of the analysis being done here centers on the cis regulatory logic upstream of each individual open reading frame, even though in many cases (i.e., genes after the first one in multi-gene operons), this is not where the relevant promoter is. This problem, in turn, raises potentially misattributions of causality running in both directions, where the causal impact on a bona fide promoter mutation on many genes in an operon may only be associated with the first gene, or on the other side, where a mutation that co-occurs with, but is causally independent from, an actual promoter mutation may be flagged as the one driving an expression change. This becomes an especially serious issue in cases like ulaE, for genes that are not the first gene in an operon (at least according to standard annotations, the UlaE transcript should be part of a polycistronic mRNA beginning from the ulaA promoter, and the role played by cis-regulatory logic immediately upstream of ulaE is uncertain and certainly merits deeper consideration. I suspect that many other similar cases likewise lurk in the dataset used here (perhaps even moreso for the Pseudomonas data, where the operon definitions are likely less robust). Of course there are many possible explanations, such as a separate ulaE promoter only in some strains, but this should perhaps be carefully stated and explored, and seems likely to be the exception rather than the rule.
While we again agree with the reviewer that some of our associations might not result in a direct causal link because the focal variant may not belong to an actual promoter element, we also want to point out how the ability to identify the composition of transcriptional units in bacteria is far from a solved problem (see references at the bottom of this comment, two in general terms, and one characterizing a specific example), even for a well-studied species such as E. coli. Therefore, even if carrying out associations at the operon level (e.g. by focusing exclusively on variants in cis for the first gene in the operon) might be theoretically correct, a number of the associations we find further down the putative operons might be the result of a true biological signal.
Conway, T., Creecy, J. P., Maddox, S. M., Grissom, J. E., Conkle, T. L., Shadid, T. M., Teramoto, J., San Miguel, P., Shimada, T., Ishihama, A., Mori, H., & Wanner, B. L. (2014). Unprecedented High-Resolution View of Bacterial Operon Architecture Revealed by RNA Sequencing. mBio, 5(4), 10.1128/mbio.01442-14. https://doi.org/10.1128/mbio.01442-14
Sáenz-Lahoya, S., Bitarte, N., García, B., Burgui, S., Vergara-Irigaray, M., Valle, J., Solano, C., Toledo-Arana, A., & Lasa, I. (2019). Noncontiguous operon is a genetic organization for coordinating bacterial gene expression. Proceedings of the National Academy of Sciences, 116(5), 1733–1738. https://doi.org/10.1073/pnas.1812746116
Zehentner, B., Scherer, S., & Neuhaus, K. (2023). Non-canonical transcriptional start sites in E. coli O157:H7 EDL933 are regulated and appear in surprisingly high numbers. BMC Microbiology, 23(1), 243. https://doi.org/10.1186/s12866-023-02988-6
Another issue with the current definition of regulatory regions, which should perhaps also be accounted for, is that it is likely that for many operons, the 'regulatory regions' of one gene might overlap the ORF of the previous gene, and in some cases actual coding mutations in an upstream gene may contaminate the set of potential regulatory mutations identified in this dataset.
We agree that defining regulatory regions might be challenging, and that those regions might overlap with coding regions, either for the focal gene or the one immediately upstream. For these reasons we have defined a wide region to identify putative regulatory variants (-200 to +30 bp around the start codon of the focal gene). We believe this relatively wide region allows us to capture the most cis genetic variation.
Taken together, I feel that all of the above concerns need to be addressed in some way. At the absolute barest minimum, the authors need to acknowledge the weaknesses that I have pointed out in the definition of cis-regulatory logic at a gene level. I think it would be far BETTER if they performed a re-analysis at the level of transcriptional units, which I think might substantially strengthen the work as a whole, but I recognize that this would also constitute a substantial amount of additional effort.
As indicated above, we have added a section in the results section to report on the analysis carried out at the level of operons as individual units, with more details provided in the methods section. We believe these results, which largely overlap with the original analysis, are a good way to recognize the limitation of our approach and to acknowledge the importance of gaining a better knowledge on the number and composition of transcriptional units in bacteria, for which, as the reference above indicates, we still have an incomplete understanding.
Having reached the end of the paper, and considering the evidence and arguments of the authors in their totality, I find myself wondering how much local x background interactions - that is, the effects of cis regulatory mutations (like those being considered here, with or without the modified definitions that I proposed above) IN THE CONTEXT OF A PARTICULAR STRAIN BACKGROUND, might matter more than the effects of the cis regulatory mutations per se. This is a particularly tricky problem to address because it would require a moderate number of targeted experiments with a moderate number of promoters in a moderate number of strains (which of course makes it maximally annoying since one can't simply scale up hugely on either axis individually and really expect to tease things out). I think that trying to address this question experimentally is FAR beyond the scope of the current paper, but I think perhaps the authors could at least begin to address it by acknowledging it as a challenge in their discussion section, and possibly even identify candidate promoters that might show the largest divergence of activities across strains when there IS no detectable cis regulatory mutation (which might be indicative of local x background interactions), or those with the largest divergences of effect for a given mutation across strains. A differential expression model incorporating shrinkage is essential in such analysis to avoid putting too much weight on low expression genes with a lot of Poisson noise.
We again thank the reviewer for their thoughtful comments on the limitations of correlative studies in general, and microbial GWAS in particular. In regards to microbial GWAS we feel we may have failed to properly explain how the implementation we have used allows to, at least partially, correct for population structure effects. That is, the linear mixed model we have used relies on population structure to remove the part of the association signal that is due to the genetic background and thus focus the analysis on the specific loci. Obviously examples in which strong epistatic interactions are present would not be accounted for, but those would be extremely challenging to measure or predict at scale, as the reviewer rightfully suggests. We have added a brief recap of the ability of microbial GWAS to account for population structure in the results section (“A large fraction of gene expression changes can be attributed to genetic variations in cis regulatory regions”, e.g. L195).
I also have some more minor concerns and suggestions, which I outline below:
It seems that the differential expression analysis treats the lab reference strains as the 'centerpoint' against which everything else is compared, and yet I wonder if this is the best approach... it might be interesting to see how the results differ if the authors instead take a more 'average' strain (either chosen based on genetics or transcriptomics) as a reference and compared everything else to that.
While we don’t necessarily disagree with the reviewer that a “wild” strain would be better to compare against, we think that our choice to go for the reference isolates is still justified on two grounds. First, while it is true that comparing against a reference introduces biases in the analysis, this concern would not be removed had we chosen another strain as reference; which strain would then be best as a reference to compare against? We think that the second point provides an answer to this question; the “traditional” reference isolates have a rich ecosystem of annotations, experimental data, and computational predictions. These can in turn be used for validation and hypothesis generation, which we have done extensively in the manuscript. Had we chosen a different reference isolate we would have had to still map associations to the traditional reference, resulting in a probable reduction in precision. An example that will likely resonate with this reviewer is that we have used experimentally-validated and high quality computational operon predictions to look into likely associations between cis-variants and “operon DEGs”. This analysis would have likely been of worse quality had we used another strain as reference, for which operon definitions would have had to come from lower-quality predictions or be “lifted” from the traditional reference.
Line 104 - the statement about the differentially expressed genes being "part of operons with diverse biological functions" seems unclear - it is not apparent whether the authors are referring to diversity of function within each operon, or between the different operons, and in any case one should consider whether the observation reflects any useful information or is just an apparently random collection of operons.
We agree that this formulation could create confusion and we have elected to remove the expression “with diverse biological functions”, given that we discuss those functions immediately after that sentence.
Line 292 - I find the argument here somewhat unconvincing, for two reasons. First, the fact that only half of the observed changes went in the same direction as the GWAS results would indicate, which is trivially a result that would be expected by random chance, does not lend much confidence to the overall premise of the study that there are meaningful cis regulatory changes being detected (in fact, it seems to argue that the background in which a variant occurs may matter a great deal, at least as much as the cis regulatory logic itself). Second, in order to even assess whether the GWAS is useful to "find the genetic determinants of gene expression changes" as the authors indicate, it would be necessary to compare to a reasonable, non-straw-man, null approach simply identifying common sequence variants that are predicted to cause major changes in sigma 70 binding at known promoters; such a test would be especially important given the lack of directional accuracy observed here. Along these same lines, it is perhaps worth noting, in the discussion beginning on line 329, that the comparison is perhaps biased in favor of the GWAS study, since the validation targets here were prioritized based on (presumably strong) GWAS data.
We thank the reviewer for prompting us into reasoning about the results of the in-vitro validation experiments. We agree that the agreement between the measured gene expression changes agree only partly with those measured with the reporter system, and that this discrepancy could likely be attributed to regulatory elements that are not in cis, and thus that were not present in the in-vitro reporter system. We have noted this possibility in the discussion. Additionally, we have amended the results section to note that even though the prediction in the direction of gene expression change was not as accurate as it could be expected, the prediction of whether a change would be present (thus ignoring directionality) was much higher.
I don't find the Venn diagrams in Fig 7C-D useful or clear given the large number of zero-overlap regions, and would strongly advocate that the authors find another way to show these data.
While we are aware that alternative ways to show overlap between sets, such as upset plots, we don’t actually find them that much easier to parse. We actually think that the simple and direct Venn diagrams we have drawn convey the clear message that overlaps only exist between certain drug classes in E. coli, and virtually none for P. aeruginosa. We have added a comment on the lack of overlap between all drug classes and the differences between the two species in the results section (i.e. L436 and L465).
In the analysis of waa operon gene expression beginning on line 400, it is perhaps important to note that most of the waa operon doesn't do anything in laboratory K12 strains due to the lack of complete O-antigen... the same is not true, however, for many wild/clinical isolates. It would be interesting to see how those results compare, and also how the absolute TPMs (rather than just LFCs) of genes in this operon vary across the strains being investigated during TOB treatment.
We thank the reviewer for this helpful suggestion. We examined the absolute expression (TPMs) of waa operon genes under the baseline (A) and following exposure to Tobramycin (B). The representative TPMs per strain were obtained by averaging across biological replicates. We observed a constitutive expression of the genes in the reference strain (MG1655) and the other isolates containing the variant of interest (MC4100, BW25113). In contrast, strains lacking the variants of interest (IAI76 and IAI78), showed lower expression of these operon genes under both conditions. Strain IAI77, on the other hand, displayed increased expression of a subset of waa genes post Tobramycin exposure, indicating strain-specific variation in transcriptional response. While the reference isolate might not have the O-antigen, it certainly expresses the waa operon, both constitutively and under TOB exposure.
I don't think that the second conclusion on lines 479-480 is fully justified by the data, given both the disparity in available annotation information between the two species, AND the fact that only two species were considered.
While we feel that the “Discussion” section of a research paper allows for speculative statements, we have to concede that we have perhaps overreached here. We have amended this sentence to be more cautious and not mislead readers.
Line 118: "Double of DEGs"
Line 288 - presumably these are LOG fold changes
Fig 6b - legend contains typos
Line 661 - please report the read count (more relevant for RNA-seq analysis) rather than Gb
We thank the reviewer for pointing out the need to make these edits. We have implemented them all.
Source code - I appreciate that the authors provide their source code on github, but it is very poorly documented - both a license and some top-level documentation about which code goes with each major operation/conclusion/figure should be provided. Also, ipython notebooks are in general a poor way in my view to distribute code, due to their encouragement of nonlinear development practices; while they are fine for software development, actual complete python programs along with accompanying source data would be preferrable.
We agree with the reviewer that a software license and some documentation about what each notebook is about is warranted, and we have added them both. While we agree that for “consumer-grade” software jupyter notebooks are not the most ergonomic format, we believe that as a documentation of how one-time analyses were carried out they are actually one of the best formats we could think of. They in fact allow for code and outputs to be presented alongside each other, which greatly helped us to iterate on our research and to ensure that what was presented in the manuscript matched the analyses we reported in the code. This is of course up for debate and ultimately specific to someone’s taste, and so we will keep the reviewer’s critique in mind for our next manuscript. And, if we ever decide to package the analyses presented in the manuscript as a “consumer-grade” application for others to use, we would follow higher standards of documentation and design.
Reviewer #3 (Evidence, reproducibility and clarity (Required)):
In this manuscript, Damaris et al. collected genome sequences and transcriptomes from isolates from two bacterial species. Data for E. coli were produced for this paper, while data for P. aeruginosa had been measured earlier. The authors integrated these data to detect genes with differential expression (DE) among isolates as well as cis-expression quantitative trait loci (cis-eQTLs). The authors used sample sizes that were adequate for an initial exploration of gene regulatory variation (n=117 for E. coli and n=413 for P. aeruginosa) and were able to discover cis eQTLs at about 39% of genes. In a creative addition, the authors compared their results to transcription rates predicted from a biophysical promoter model as well as to annotated transcription factor binding sites. They also attempted to validate some of their associations experimentally using GFP-reporter assays. Finally, the paper presents a mapping of antibiotic resistance traits. Many of the detected associations for this important trait group were in non-coding genome regions, suggesting a role of regulatory variation in antibiotic resistance.
A major strength of the paper is that it covers an impressive range of distinct analyses, some of which in two different species. Weaknesses include the fact that this breadth comes at the expense of depth and detail. Some sections are underdeveloped, not fully explained and/or thought-through enough. Important methodological details are missing, as detailed below.
We thank the reviewer for highlighting the strengths of our study. We hope that our replies to their comments and the other two reviewers will address some of the limitations.
Major comments:
An interesting aspect of the paper is that genetic variation is represented in different ways (SNPs & indels, IRG presence/absence, and k-mers). However, it is not entirely clear how these three different encodings relate to each other. Specifically, more information should be given on these two points:
it is not clear how "presence/absence of intergenic regions" are different from larger indels.
In order to better guide readers through the different kinds of genetic variants we considered, we have added a brief explanation about what “promoter switches” are in the introduction (“meaning that the entire promoter region may differ between isolates due to recombination events”, L56). We believe this clarifies how they are very different in character from a large deletion. We have kept the reference to the original study (10.1073/pnas.1413272111) describing how widespread these switches are in E. coli as a way for readers to discover more about them.
- I recommend providing more narration on how the k-mers compare to the more traditional genetic variants (SNPs and indels). It seems like the k-mers include the SNPs and indels somehow? More explanation would be good here, as k-mer based mapping is not usually done in other species and is not standard practice in the field. Likewise, how is multiple testing handled for association mapping with k-mers, since presumably each gene region harbors a large number of k-mers, potentially hugely increasing the multiple testing burden?
We indeed agree with the reviewer in thinking that representing genetic variants as k-mers would encompass short variants (SNP/InDels) as well as larger variants and promoters presence/absence patterns. We believe that this assumption is validated by the fact that we identify the highest proportion of DEGs with a significant association when using this representation of variants (Figure 2A, 39% for both species). We have added a reference to a recent review on the advantages of k-mer methods for population genetics (10.1093/molbev/msaf047) in the introduction. Regarding the issue of multiple testing correction, we have employed a commonly recognized approach that, unlike a crude Bonferroni correction using the number of tested variants, allows for a realistic correction of association p-values. We used the number of unique presence/absence patterns, which can be shared between multiple genetic variants, and applied a Bonferroni correction using this number rather than the number of variants tested. We have expanded the corresponding section in the methods (e.g. L697) to better explain this point for readers not familiar with this approach.
- What was the distribution of association effect sizes for the three types of variants? Did IRGs have larger effects than SNPs as may be expected if they are indeed larger events that involve more DNA differences? What were their relative allele frequencies?
We appreciate the suggestion made by the reviewer to look into the distribution of effect sizes divided by variant type. We have now evaluated the distribution of the effect sizes and allele frequencies for the genetic markers (SNPs/InDels, IGRs, and k-mers) for both species (Supplementary Figure 2). In E. coli, IGR variants showed somewhat larger median effect sizes (|β| = 4.5) than SNPs (|β| = 3.8), whereas k-mers displayed the widest distribution (median |β| = 5.2). In P. aeruginosa, the trend differed with IGRs exhibiting smaller effects (median |β| = 3.2), compared to SNPs/InDels (median |β| =5.1) and k-mers (median |β| = 6.2). With respect to allele frequencies, SNPs/InDels generally occured at lower frequencies (median AF = 0.34 for E.coli, median AF = 0.33 for P. aeruginosa), whereas IGRs (median AF = 0.65 for E. coli and 0.75 for P. aeruginosa) and k-mers (median AF = 0.71 for E. coli and 0.65 for P. aeruginosa) were more often at the intermediate to higher frequencies respectively. We have added a visualization for the distribution of effect sizes (Supplementary Figure 2).
- The GFP-based experiments attempting to validate the promoter effects for 18 genes are laudable, and the fact that 16 of them showed differences is nice. However, the fact that half of the validation attempts yielded effects in the opposite direction of what was expected is quite alarming. I am not sure this really "further validates" the GWAS in the way the authors state in line 292 - in fact, quite the opposite in that the validations appear random with regards to what was predicted from the computational analyses. How do the authors interpret this result? Given the higher concordance between GWAS, promoter prediction, and DE, are the GFP assays just not relevant for what is going on in the genome? If not, what are these assays missing? Overall, more interpretation of this result would be helpful.
We thanks the reviewer for their comment, which is similar in nature to that raised by reviewer #2 above. As noted in our reply above we have amended the results and discussion to indicate that although the direction of gene expression change was not highly accurate, focusing on the magnitude (or rather whether there would be a change in gene expression, regardless of the direction), resulted in a higher accuracy. We postulate that the cases in which the direction of the change was not correctly identified could be due to the influence of other genetic elements in trans with the gene of interest.
- On the same note, it would be really interesting to expand the GFP experiments to promoters that did not show association in the GWAS. Based on Figure 6, effects of promoter differences on GFP reporters seem to be very common (all but three were significant). Is this a higher rate than for the average promoter with sequence variation but without detected association? A handful of extra reporter experiments might address this. My larger question here is: what is the null expectation for how much functional promoter variation there is?
We thank the reviewer for this comment. We agree that estimating the null expectation for the functional promoter would require testing promoter alleles with sequence variation that are not associated in the GWAS. Such experiments, which would directly address if the observed effects in our study exceeds background, would have required us to prepare multiple constructs, which was unfortunately not possible for us due to staff constraints. We therefore elected to clarify the scope of our GFP reporter assays instead. These experiments were designed as a paired comparison of the wild-type and the GWAS-associated variant alleles of the same promoter in an identical reporter background, with the aim of testing allele-specific functional effects for GWAS hits (Supplementary Figure 6). We also included a comparison in GFP fluorescence between the promoterless vector (pOT2) and promoter-containing constructs; we observed higher GFP signals in all but four (yfgJ, fimI, agaI, and yfdQ) variant-containing promoter constructs, which indicates that for most of the construct we cloned active promoter elements. We have revised the manuscript text accordingly to reflect this clarification and included the control in the supplementary information as Supplementary Figure 6.
- Were the fold-changes in the GFP experiments statistically significant? Based on Figure 6 it certainly looks like they are, but this should be spelled out, along with the test used.
We thank the reviewer for pointing this out. We have reviewed Figure 6 to indicate significant differences between the test and control reporter constructs. We used the paired student’s t-test to match the matched plate/time point measurements. We also corrected for multiple testing using the Benhamini-Hochberg correction. As seen in the updated Figure 6A, 16 out of the 18 reporter constructs displayed significant differences (adjusted p-value
- What was the overall correlation between GWAS-based fold changes and those from the GFP-based validation? What does Figure 6A look like as a scatter plot comparing these two sets of values?
We thank the reviewer for this helpful suggestion, which allows us to more closely look into the results of our in-vitro validation. We performed a direct comparison of RNAseq fold changes from the GWAS (x-axis) with the GFP reporter measurements (y-axis) as depicted in the figure above. The overall correlation between the two was weak (Pearson r = 0.17), reflecting the lack of thorough agreement between the associations and the reporter construct. We however note that the two metrics are not directly comparable in our opinion, since on the x-axis we are measuring changes in gene expression and on the y-axis changes in fluorescence expression, which is downstream from it. As mentioned above and in reply to a comment from reviewer 2, the agreement between measured gene expression and all other in-silico and in-vitro techniques increases when ignoring the direction of the change. Overall, we believe that these results partly validate our associations and predictions, while indicating that other factors in trans with the regulatory region contribute to changes in gene expression, which is to be expected. The scatter plot has been included as a new supplementary figure (Supplementary Figure 7).
- Was the SNP analyzed in the last Results section significant in the gene expression GWAS? Did the DE results reported in this final section correspond to that GWAS in some way?
The T>C SNP upstream of waaQ did not show significant association with gene expression in our cis GWAS analysis. Instead, this variant was associated with resistance to tobramycin when referencing data from Danesh et al, and we observed the variant in our strain collection. We subsequently investigated whether this variant also influenced expression of the waa operon under sub-inhibitory tobramycin exposure. The differential expression results shown in the final section therefore represent a functional follow-up experiment, and not a direct replication of the GWAS presented in the first part of the manuscript.
- Line 470: "Consistent with the differences in the genetic structure of the two species" It is not clear what differences in genetic structure this refers to. Population structure? Genome architecture? Differences in the biology of regulatory regions?
The awkwardness of that sentence is perhaps the consequence of our assumption that readers would be aware of the differences in population genetics differences between the two species. We however have realized that not much literature is available (if at all!) about these differences, which we have observed during the course of this and other studies we have carried out. As a result, we agree that we cannot assume that the reader is similarly familiar with these differences, and have changed that sentence (i.e. L548) to more directly address the differences between the two species, which will presumably result in a diverse population structure. We thank the reviewer for letting us be aware of a gap in the literature concerning the comparison of pangenome structures across relevant species.
- Line 480: the reference to "adaption" is not warranted, as the paper contains no analyses of evolutionary patterns or processes. Genetic variation is not the same as adaptation.
We have amended this sentence to be more adherent to what we can conclude from our analyses.
- There is insufficient information on how the E. coli RNA-seq data was generated. How was RNA extracted? Which QC was done on the RNA; what was its quality? Which library kits were used? Which sequencing technology? How many reads? What QC was done on the RNA-seq data? For this section, the Methods are seriously deficient in their current form and need to be greatly expanded.
We thank the reviewer for highlighting the need for clearer methodological detail. We have expanded this section (i.e. L608) to fully describe the generation and quality control of the E. coli RNA-seq data including RNA extraction and sequencing platform.
- How were the DEG p-values adjusted for multiple testing?
As indicated in the methods section (“Differential gene expression and functional enrichment analysis”), we have used DEseq2 for E. coli, and LPEseq for P. aeruginosa. Both methods use the statistical framework of the False Discovery Rate (FDR) to compute an adjusted p-value for each gene. We have added a brief mention of us following the standard practice indicated by both software packages in the methods.
- Were there replicates for the E. coli strains? The methods do not say, but there is a hint there might have been replicates given their absence was noted for the other species.
In the context of providing more information about the transcriptomics experiments for E. coli, we have also more clearly indicated that we have two biological replicates for the E. coli dataset.
- There needs to be more information on the "pattern-based method" that was used to correct the GWAS for multiple tests. How does this method work? What genome-wide threshold did it end up producing? Was there adjustment for the number of genes tested in addition to the number of variants? Was the correction done per variant class or across all variant classes?
In line with an earlier comment from this reviewer, we have expanded the section in the Methods (e.g. L689) that explains how this correction worked to include as many details as possible, in order to provide the readers with the full context under which our analyses were carried out.
- For a paper that, at its core, performs a cis-eQTL mapping, it is an oversight that there seems not to be a single reference to the rich literature in this space, comprising hundreds of papers, in other species ranging from humans, many other animals, to yeast and plants.
We thank both reviewer #1 and #3 for pointing out this lack of references to the extensive literature on the subject. We have added a number of references about the applications of eQTL studies, and specifically its application in microbial pangenomes, which we believe is more relevant to our study, in the introduction.
Minor comments:
- I wasn't able to understand the top panels in Figure 4. For ulaE, most strains have the solid colors, and the corresponding bottom panel shows mostly red points. But for waaQ, most strains have solid color in the top panel, but only a few strains in the bottom panel are red. So solid color in the top does not indicate a variant allele? And why are there so many solid alleles; are these all indels? Even if so, for kgtP, the same colors (i.e., nucleotides) seem to seamlessly continue into the bottom, pale part of the top panel. How are these strains different genotypically? Are these blocks of solid color counted as one indel or several SNPs, or somehow as k-mer differences? As the authors can see, these figures are really hard to understand and should be reworked. The same comment applies to Figure 5, where it seems that all (!) strains have the "variant"?
We thank the reviewer for pointing out some limitations with our visualizations, most importantly with the way we explained how to read those two figures. We have amended the captions to more explicitly explain what is shown. The solid colors in the “sequence pseudo-alignment” panels indicate the focal cis variant, which is indicated in red in the corresponding “predicted transcription rate” panels below. In the case of Figure 5, the solid color indicates instead the position of the TFBS in the reference.
- Figure 1A & B: It would be helpful to add the total number of analyzed genes somewhere so that the numbers denoted in the colored outer rings can be interpreted in comparison to the total.
We have added the total number of genes being considered for either species in the legend.
- Figure 1C & D: It would be better to spell out the COG names in the figure, as it is cumbersome for the reader to have to look up what the letters stand for in a supplementary table in a separate file.
While we do not disagree with the awkwardness of having to move to a supplementary table to identify the full name of a COG category, we also would like to point out that the very long names of each category would clutter the figure to a degree that would make it difficult to read. We had indeed attempted something similar to what the reviewer suggests in early drafts of this manuscript, leading to small and hard to read labels. We have therefore left the full names of each COG category in Supplementary Table 3.
- Line 107: "Similarly," does not fit here as the following example (with one differentially expressed gene in an operon) is conceptually different from the one before, where all genes in the operon were differentially expressed.
We agree and have amended the sentence accordingly.
- Figure 5 bottom panel: it is odd that on the left the swarm plots (i.e., the dots) are on the inside of the boxplots while on the right they are on the outside.
We have fixed the position of the dots so that they are centered with respect to the underlying boxplots.
- It is not clear to me how only one or a few genes in an operon can show differential mRNA abundance. Aren't all genes in an operon encoded by the same mRNA? If so, shouldn't this mRNA be up- or downregulated in the same manner for all genes it encodes? As I am not closely familiar with bacterial systems, it is well possible that I am missing some critical fact about bacterial gene expression here. If this is not an analysis artifact, the authors could briefly explain how this observation is possible.
We thanks the reviewer for their comment, which again echoes one of the main concerns from reviewer #2. As noted in our reply above, it has been established in multiple studies (see the three we have indicated above in our reply to reviewer #2) how bacteria encode for multiple “non-canonical” transcriptional units (i.e. operons), due to the presence of accessory terminators and promoters. This, together with other biological effects such as the presence of mRNA molecules of different lengths due to active transcription and degradation and technical noise induced by RNA isolation and sequencing can result in variability in the estimation of abundance for each gene.
Note: This preprint has been reviewed by subject experts for Review Commons. Content has not been altered except for formatting.
Learn more at Review Commons
In this manuscript, Damaris et al. collected genome sequences and transcriptomes from isolates from two bacterial species. Data for E. coli were produced for this paper, while data for P. aeruginosa had been measured earlier. The authors integrated these data to detect genes with differential expression (DE) among isolates as well as cis-expression quantitative trait loci (cis-eQTLs). The authors used sample sizes that were adequate for an initial exploration of gene regulatory variation (n=117 for E. coli and n=413 for P. aeruginosa) and were able to discover cis eQTLs at about 39% of genes. In a creative addition, the authors compared their results to transcription rates predicted from a biophysical promoter model as well as to annotated transcription factor binding sites. They also attempted to validate some of their associations experimentally using GFP-reporter assays. Finally, the paper presents a mapping of antibiotic resistance traits. Many of the detected associations for this important trait group were in non-coding genome regions, suggesting a role of regulatory variation in antibiotic resistance. A major strength of the paper is that it covers an impressive range of distinct analyses, some of which in two different species. Weaknesses include the fact that this breadth comes at the expense of depth and detail. Some sections are underdeveloped, not fully explained and/or thought-through enough. Important methodological details are missing, as detailed below.
Major comments:
An interesting aspect of the paper is that genetic variation is represented in different ways (SNPs & indels, IRG presence/absence, and k-mers). However, it is not entirely clear how these three different encodings relate to each other. Specifically, more information should be given on these two points:
it is not clear how "presence/absence of intergenic regions" are different from larger indels.
I recommend providing more narration on how the k-mers compare to the more traditional genetic variants (SNPs and indels). It seems like the k-mers include the SNPs and indels somehow? More explanation would be good here, as k-mer based mapping is not usually done in other species and is not standard practice in the field. Likewise, how is multiple testing handled for association mapping with k-mers, since presumably each gene region harbors a large number of k-mers, potentially hugely increasing the multiple testing burden?
Minor comments:
To my knowledge, this work represents the first cis-eQTL mapping in bacteria. As such, it is a useful and interesting exploration of this space that complements the large body of literature on this question in eukaryotic systems. This expansion to bacterial systems is especially interesting given the unique features of bacterial compared to eukaryotic genomes, including a small (10-15%) noncoding fraction of the genome and gene organization in operons. The work will be of interest to readers in the fields of complex trait genetics, gene expression, and regulatory variation. For context of this assessment, I am an expert in genomics and the study of genetic variation in gene expression in eukaryotic systems. I have limited knowledge about bacterial genetics and biology, as well as of antibiotic resistance.
Note: This preprint has been reviewed by subject experts for Review Commons. Content has not been altered except for formatting.
Learn more at Review Commons
Summary:
Damaris et al. perform what is effectively an eQTL analysis on microbial pangenomes of E. coli and P. aeruginosa. Specifically, they leverage a large dataset of paired DNA/RNA-seq information for hundreds of strains of these microbes to establish correlations between genetic variants and changes in gene expression. Ultimately, their claim is that this approach identifies non-coding variants that affect expression of genes in a predictable manner and explain differences in phenotypes. They attempt to reinforce these claims through use of a widely regarded promoter calculator to quantify promoter effects, as well as some validation studies in living cells. Lastly, they show that these non-coding variations can explain some cases of antibiotic resistance in these microbes.
Major comments
Are the claims and the conclusions supported by the data or do they require additional experiments or analyses to support them?
The authors convincingly demonstrate that they can identify non-coding variation in pangenomes of bacteria and associate these with phenotypes of interest. What is unclear is the extent by which they account for covariation of genetic variation? Are the SNPs they implicate truly responsible for the changes in expression they observe? Or are they merely genetically linked to the true causal variants. This has been solved by other GWAS studies but isn't discussed as far as I can tell here.
They need to justify why they consider the 30bp downstream of the start codon as non-coding. While this region certainly has regulatory impact, it is also definitely coding. To what extent could this confound results and how many significant associations to expression are in this region vs upstream?
The claim that promoter variation correlates with changes in measured gene expression is not convincingly demonstrated (although, yes, very intuitive). Figure 3 is a convoluted way of demonstrating that predicted transcription rates correlate with measured gene expression. For each variant, can you do the basic analysis of just comparing differences in promoter calculator predictions and actual gene expression? I.e. correlation between (promoter activity variant X)-(promoter activity variant Y) vs (measured gene expression variant X)-(measured gene expression variant Y). You'll probably have to
Figure 7 it is unclear what this experiment was. How were they tested? Did you generate the data themselves? Did you do RNA-seq (which is what is described in the methods) or just test and compare known genomic data?
Are the data and the methods presented in such a way that they can be reproduced?
No, this is the biggest flaw of the work. The RNA-Seq experiment to start this project is not described at all as well as other key experiments. Descriptions of methods in the text are far too vague to understand the approach or rationale at many points in the text. The scripts are available on github but there is no description of what they correspond to outside of the file names and none of the data files are found to replicate the plots.
Figure 8B is intended to show that the WaaQ operon is connected to known Abx resistance genes but uses the STRING method. This requires a list of genes but how did they build this list? Why look at these known ABx genes in particular? STRING does not really show evidence, these need to be substantiated or at least need to justify why this analysis was performed.
Are the experiments adequately replicated and statistical analysis adequate?
An important claim on MIC of variants for supplementary table 8 has no raw data and no clear replicates available. Only figure 6, the in vitro testing of variant expression, mentions any replicates.
Minor comments
Specific experimental issues that are easily addressable.. Are prior studies referenced appropriately?
There should be a discussion of eQTLs in this. Although these have mostly been in eukaryotes a. https://doi.org/10.1038/s41588-024-01769-9 ; https://doi.org/10.1038/nrg3891
Line 67. Missing important citation for Ireland et al. 2020 https://doi.org/10.7554/eLife.55308 Line 69. Should mention Johns et al. 2018 (https://doi.org/10.1038/nmeth.4633) where they study promoter sequences outside of E. coli Line 90 - replace 'hypothesis-free' with unbiased Line 102 - state % of DEGs relative to the entire pan-genome Figure 1A is not discussed in the text Line 111: it is unclear what enrichment was being compared between, FIgures 1C/D have 'Gene counts' but is of the total DEGs? How is the p-value derived? Comparing and what statistical test was performed? Comparing DEG enrichment vs the pangenome? K12 genome? Line 122-123: State what letters correspond to these COG categories here Line 155: Need to clarify how you use k-mers in this and how they are different than SNPs. are you looking at k-mer content of these regions? K-mers up to hexamers or what? How are these compared. You can't just say we used k-mers. Line 172: It would be VERY helpful to have a supplementary figure describing these types of variants, perhaps a multiple-sequence alignment containing each example Figure 4: THis figure is too small. Why are WaaQ and UlaE being used as examples here when you are supposed to be explicitly showing variants with strong positive correlations? Figure 4: Why is there variation between variants present and variant absent? Is this due to other changes in the variant? Should mention this in the text somewhere Line 359: Need to talk about each supplementary figure 4 to 9 and how they demonstrate your point.
Are the text and figures clear and accurate? Figure 4 too small Acronyms are defined multiple times in the manuscript, sometimes not the first time they are used (e.g. SNP, InDel) Figure 8A - Remove red box, increase label size Figure 8B - Low resolution, grey text is unreadable and should be darker and higher resolution Line 35 - be more specific about types of carbon metabolism and catabolite repression Line 67 - include citation for ireland et al. 2020 https://doi.org/10.7554/eLife.55308 Line 74 - You talk about looking in cis but don't specify how mar away cis is Line 75 - we encoded genetic variants..... It is unclear what you mean here Line 104 - 'were apart of operons' should clarify you mean polycistronic or multi-gene operons. Single genes may be considered operonic units as well. Figure 2: THere is no axis for the percents and the percents don't make sense relative to the bars they represent?? Figure 2: Figure 2B legend should clarify that these are individual examples of Differential expression between variants Line 198-199: This sentence doesn't make sense, 'encoded using kmers' is not descriptive enough Line 205: Should be upfront about that you're using the Promoter Calculator that models biophysical properties of promoter sequences to predict activity. Line 251: 'Scanned the non-coding sequences of the DEGs'. This is far too vague of a description of an approach. Need to clarify how you did this and I didn't see in the method. Is this an HMM? Perfect sequence match to consensus sequence? Some type of alignment? Line 257-259: This sentence lacks clarity Line346: How were the E. coli isolates tested? Was this an experiment you did? This is a massive undertaking (1600 isolates * 12 conditions) if so so should be clearly defined Figure 6A: The tile plot on the right side is not clearly labeled and it is unclear what it is showing and how that relates to the bar plots. FIgure 6B: typo in legend 'Downreglation' Line 398: Need to state rationale for why Waaq operon is being investigated here. WHy did you look into individual example? Figure 8: Can get rid of red box Line 463 - 'account for all kinds' is too informal Mix of font styles throughout document
Provide contextual information to readers (editors and researchers) about the novelty of the study, its value for the field and the communities that might be interested. The following aspects are important:General assessment: provide a summary of the strengths and limitations of the study. What are the strongest and most important aspects? What aspects of the study should be improved or could be developed?
This study applies eQTL concepts to bacterial pangenomes to understand how genetic variation in non-coding regions contributes to microbial phenotypes, which is clever and has not been done in bacterial communities (although has been done in yeast isolates, see citation above). They characterize these same variants using in silico promoter predictions, in vitro experiments, layer biological mechanism via transcription factor binding site mapping, and study associated antibiotic resistance phenotypes. These are all good ideas, but none of these points are very developed. The antibiotic work in particular was a missed opportunity as this is the most impactful demonstration of their approach. For instance, to what extent do these eQTLs explain resistance across isolates vs coding changes? Are non-coding variants more responsible for antibiotic resistance than coding variants? Given how easy it is to adapt gene expression vs establishing other mechanisms, this is plausible. How could knowing this change how we treat infections? While a general overview of their strategy is fine, the approaches are under-described and unclear so difficult to truly assess.
Advance: compare the study to the closest related results in the literature or highlight results reported for the first time to your knowledge; does the study extend the knowledge in the field and in which way? Describe the nature of the advance and the resulting insights (for example: conceptual, technical, clinical, mechanistic, functional,...).
To my knowledge and from a cursory search, this is the first pan-genome mapping of non-coding variants to transcriptional changes in bacteria. This is a good idea that could be applied to any microbe for which large transcriptomic datasets of strains are available or could be generated and is helpful for understanding genetic variation and the architecture of bacterial regulatory systems.
Audience: describe the type of audience ("specialized", "broad", "basic research", "translational/clinical", etc...) that will be interested or influenced by this research; how will this research be used by others; will it be of interest beyond the specific field?
This would be of interest to individuals interested in population genetics, gene regulation, and microbial evolution. It could inspire similar studies of other microbes to understand the contribution of non-coding changes to phenotypes across whole genomes.
Please define your field of expertise with a few keywords to help the authors contextualize your point of view. Indicate if there are any parts of the paper that you do not have sufficient expertise to evaluate.
I am an expert on bacterial gene regulation, especially concerning how promoter activity is encoded within sequences. I have less experience on using GWAS.
Author response:
The following is the authors’ response to the original reviews.
Public Reviews:
Reviewer #1 (Public review):
Summary:
This study aimed to determine whether bacterial translation inhibitors affect mitochondria through the same mechanisms. Using mitoribosome profiling, the authors found that most antibiotics, except telithromycin, act similarly in both systems. These insights could help in the development of antibiotics with reduced mitochondrial toxicity.
They also identified potential novel mitochondrial translation events, proposing new initiation sites for MT-ND1 and MT-ND5. These insights not only challenge existing annotations but also open new avenues for research on mitochondrial function.
Strengths:
Ribosome profiling is a state-of-the-art method for monitoring the translatome at very high resolution. Using mitoribosome profiling, the authors convincingly demonstrate that most of the analyzed antibiotics act in the same way on both bacterial and mitochondrial ribosomes, except for telithromycin. Additionally, the authors report possible alternative translation events, raising new questions about the mechanisms behind mitochondrial initiation and start codon recognition in mammals.
Weaknesses:
The main weaknesses of this study are:
While the authors highlight an interesting difference in the inhibitory mechanism of telithromycin on bacterial and mitochondrial ribosomes, mechanistic explanations or hypotheses are lacking.
We acknowledge that we were not able to present a clear explanation for potential mechanistic differences of telithromycin inhibition between mitochondrial and bacterial ribosomes. In future work, structural analyses in collaboration with experts will provide these insights.
The assignment of alternative start codons in MT-ND1 and MT-ND5 is very interesting but does not seem to fully align with structural data.
We appreciate the reviewer’s comment and consulted a cryo-EM expert to review our findings in the context of the available structural data. We downloaded the density map and reviewed the N-termini of MT-ND1 and MT-ND5. We only observed the density of the N-terminus of MT-ND1 at low confidence. At an RMSD of 2, we could not observe density for the side chains of Met and Pro, and there are gaps in the density for what is modeled as the main chain. The assignment of these residues may have been overlooked due to the expectation that they should be present in the peptide.
For MT-ND5, we did observe some density that could be part of the main chain; however, it did not fill out until we reduced the stringency, and we did not observe density mapping to side chain residues. To summarize, we do not confidently see density for either the side chain or the main chain for either peptide.
The newly proposed translation events in the ncRNAs are preliminary and should be further substantiated with additional evidence or interpreted with more caution.
We agree with the reviewer that we did not provide conclusive evidence that our phased ribosome footprinting data on mitochondrial non-coding RNAs are proof of novel translation events. We do acknowledge this in the main text:” Due to both the short ORFs, minimal read coverage, and lack of a detectable peptide we could not determine if translation elongation occurred on the mitochondrial tRNAs. These sites may be unproductive mitoribosome binding events or simply from tRNAs partially digesting during MNase treatment.”
Reviewer #2 (Public review):
In this study, the authors set out to explore how antibiotics known to inhibit bacterial protein synthesis also affect mitoribosomes in HEK cells. They achieved this through mitoribosome profiling, where RNase I and Mnase were used to generate mitoribosome-protected fragments, followed by sequencing to map the regions where translation arrest occurs. This profiling identified the codon-specific impact of antibiotics on mitochondrial translation.
The study finds that most antibiotics tested inhibit mitochondrial translation similarly to their bacterial counterparts, except telithromycin, which exhibited distinct stalling patterns. Specifically, chloramphenicol and linezolid selectively inhibited translation when certain amino acids were in the penultimate position of the nascent peptide, which aligns with their known bacterial mechanism. Telithromycin stalls translation at an R/K-X-R/K motif in bacteria, and the study demonstrated a preference for arresting at an R/K/A-X-K motif in mitochondria. Additionally, alternative translation initiation sites were identified in MT-ND1 and MT-ND5, with non-canonical start codons. Overall, the paper presents a comprehensive analysis of antibiotics in the context of mitochondrial translation toxicity, and the identification of alternative translation initiation sites will provide valuable insights for researchers in the mitochondrial translation field.
From my perspective as a structural biologist working on the human mitoribosome, I appreciate the use of mitoribosome profiling to explore off-target antibiotic effects and the discovery of alternative mitochondrial translation initiation sites. However, the description is somewhat limited by a focus on this single methodology. The authors could strengthen their discussion by incorporating structural approaches, which have contributed significantly to the field. For example, antibiotics such as paromomycin and linezolid have been modeled in the human mitoribosome (PMID: 25838379), while streptomycin has been resolved (10.7554/eLife.77460), and erythromycin was previously discussed (PMID: 24675956). The reason we can now describe off-target effects more meaningfully is due to the availability of fully modified human mitoribosome structures, including mitochondria-specific modifications and their roles in stabilizing the decoding center and binding ligands, mRNA, and tRNAs (10.1038/s41467-024-48163-x).
These and other relevant studies should be acknowledged throughout the paper to provide additional context.
We appreciate the work that has previously revealed how different antibiotics bind the mitochondrial ribosome. We have included these references in the manuscript to provide background and context for this work in relationship to the field.
Reviewer #3 (Public review):
Summary:
Recently, the off-target activity of antibiotics on human mitoribosome has been paid more attention in the mitochondrial field. Hafner et al applied mitoribosome profilling to study the effect of antibiotics on protein translation in mitochondria as there are similarities between bacterial ribosome and mitoribosome. The authors conclude that some antibiotics act on mitochondrial translation initiation by the same mechanism as in bacteria. On the other hand, the authors showed that chloramphenicol, linezolid and telithromycin trap mitochondrial translation in a context-dependent manner. More interesting, during deep analysis of 5' end of ORF, the authors reported the alternative start codon for ND1 and ND5 proteins instead of previously known one. This is a novel finding in the field and it also provides another application of the technique to further study on mitochondrial translation.
Strengths:
This is the first study which applied mitoribosome profiling method to analyze mutiple antibiotics treatment cells.
The mitoribosome profiling method had been optimized carefully and has been suggested to be a novel method to study translation events in mitochondria. The manuscript is constructive and written well.
Weaknesses:
This is a novel and interesting study, however, most of the conclusion comes from mitoribosome profiling analysis, as a result, the manuscript lacks the cellular biochemical data to provide more evidence and support the findings.
We thank the reviewer for the positive assessment of our work. We agree that future biochemical and structural experiments will strengthen the conclusions we derive from the ribosome profiling.
Recommendations for the authors:
Reviewer #1 (Recommendations for the authors):
In Fig. 1A, the quality of the Western blot for the sucrose gradient is suboptimal. I recommend enhancing the quality of the Western blot image and providing the sucrose gradient sedimentation patterns for both the mtSSU and mtLSU to confirm the accurate selection of the monosome fraction. Additionally, to correctly assign the A260 peaks to mitochondrial and cytosolic ribosomes, it would be helpful to include markers for both the cytoribosomal LSU and SSU, too. Furthermore, do the authors observe mitochondrial polysomes in their sucrose gradient? If so, were those fractions fully excluded from the analysis?
We repeated our sucrose gradient and Western blotting with antibodies for the large and small subunits of the mitoribosome. We did not repeat western blotting for the cytoribosomes as the 40S, 60S, and 80S peaks are present in their canonical heights and locations on a sucrose gradient. Western blotting indicates that the large and small subunits of the mitoribosome are located in the fraction taken for mitoribo-seq. We do see trace amounts of mitoribosome in fractions past the 55S site. Those fractions were excluded from library preparation.
The MNase footprints exhibited a bimodal distribution, which the authors suggest may indicate that "MNase-treatment may have captured two distinct conformations of the ribosome." It would be relevant to clarify whether an enzyme titration was performed, as excessive MNase could lead to ribosomal RNA degradation, potentially influencing the footprints.
We did not perform a titration and instead based our concentration on the protocol from Rooijers et al, 2013. We included a statement of this and a reference to the concentration in the methods.
Is there an explanation for why RNase I footprinting reveals a very high peak at the 5'-end of the MT-CYB transcript, whereas this is not observed with MNase footprinting?
It is not clear. The intensity of peaks at the 5’ end of the transcripts varies. We do observe that the relative intensity of the 5’ peak is greater for RNase I footprinted samples than MNase-treated samples.
I understand that throughout the manuscript, the authors use MT-CYB as an example to illustrate the effects of the antibiotics on mitochondrial translation. However, to strengthen the generality of the conclusions, it would be beneficial to provide the read distribution across the entire mitochondrial transcriptome, possibly in the supplementary material. Additionally, I suggest including the read distribution for MT-CYB in untreated cells to improve data interpretation and enhance the clarity of figures (e.g., Figs. 1B, 2B, 3B).
As these experiments were generated across multiple mitoribo-seq experiments, each was done with its own control experiment. It would be inaccurate to show a single trace as representative of all experiments. Instead, we include Supplementary Figure 1, which shows the untreated MT-CYB trace for all control samples and indicates which treatment they pair with.
It would be very valuable to label each individual data point in the read phasing shown in Fig. 1D with the corresponding transcripts. For improved data visualization, I suggest assigning distinct colors to each transcript.
We are concerned that including the name of each gene in the main figure would be too difficult for the reader to accurately interpret. Instead, we have added a Supplementary Table with those values.
How do the authors explain the significant peak (approx. 10,000 reads) at the 5' end of the transcript in the presence of tiamulin (Fig. 2B)? Does this peak correspond to the start codon, and how does it relate to the quantification reported in Fig. 2C?
Yes, this represents the start codon. These reads are likely derived from the start codon as they are mapping to the 5’ end of the transcript. There are differences in sequencing depth depending on the experiment, so what is critical is the relative distribution of reads on the transcript rather than comparing absolute reads between experiments. MT-CYB has 54% of the reads at the start site, which is representative of what we see across all genes.
Throughout the manuscript, I found the usage of the terms "5' end" and "start codon" somewhat confusing, as they appear to be used synonymously in some instances. For example, in Fig. 2C, the y-axis label states "ribosomes at start codon," while the figure caption mentions "...percentage of reads that map to the 5' end of mitochondrial transcripts." Given the size of the graphs, it is also challenging for the reader to determine whether the peaks correspond specifically to the start codon or if multiple peaks accumulate at the initial codons.
We were selected for this language because two different types of analysis are being carried out. Ribosome profiling carried out in Figures 2 and 3 is carried out with RNase I, which poorly maps the ribosomes at the start codon when we do the read length analysis in Figure 4. Ribosome footprint at the 5’ end may include ribosomes that are on the 2-4 codons following the start codon, so it would not be accurate to label those as “ribosomes at a start codon.” We have renamed the axis to “Ribosomes at 5’ end”. Wig files are available online for all mitoribosome profiling experiments. In this case, the assigned “P-site” is several codons after the start codon due to the offset applied and the minimal 5’ UTR. Thus, it is less important to see which codon density is assigned to, but rather the general distribution of the reads.
The authors state, "Cells treated with telithromycin did show a slight increase in MRPF abundance at the 5' end of MT-CYB" and "the cumulative distribution of MRPFs suggested that ribosome density was biased towards the 5' end of the gene for chloramphenicol and telithromycin, but not significantly for linezolid." Could this observation be linked to the presence of specific stalling motifs in that region? If so, it would be beneficial to display such motifs on the graphs of the read distribution across the transcriptome to substantiate the context-dependent inhibition.
Thank you for this suggestion. For chloramphenicol and linezolid, alanine, serine, and threonine make up nearly 25% of the mitochondrial proteome. As such, there are numerous stall sites across the transcript. Given their identical stalling motifs, the difference between chloramphenicol and linezolid is due to sequence-specific differences. Potentially, this could be due to conditions such as the final concentration of antibiotic inside the mitochondria and the on/off rate of an inhibitor with the translating mitoribosome. Both may affect the kinetics of stalling and allow mitoribosomes to evade early stall sites.
We have also included the sites of all A/K/R-X-K motifs located in the genome and the calculated fold change for each position. As a note, this includes sites that do not pass the minimum filter set by our analysis and we note this in the text.
The comment raises an additional question: Does the increased density at the 5’ end derive from stalled mitoribosomes or queued mitoribosomes behind a stalling event? Recent work by Iwasaki’s group shows that mitoribosomes can form disomes and queue behind each other. However, we could not observe 30 aa periodicities behind stalling events that would be indicative of collided mitoribosomes.
In Fig. 3E, the authors report an additional and very interesting observation that is not discussed. Linezolid treatment causes reduced ribosome occupancy when proline or glycine codons occupy the P-site, or when the amino acids have been incorporated into the polypeptide chain and occupy the -1 position. It is known that the translation of proline and glycine frequently leads to ribosome stalling due to the physicochemical properties of these amino acids. Has this effect of linezolid been reported in the bacterial translation system? Additionally, can the authors propose hypotheses for the mechanism behind this observation? A similar observation is noted for telithromycin when glycine occupies the same positions, as well as when aspartate occupies the P- and A-sites.
In bacteria, Linezolid does have an “anti-stalling” motif when glycine is present in the A-site. However, this is due to the size of the residue being compatible with antibiotic binding.
The most likely cause of this effect is a redistribution of ribosome footprints. As the antibiotics introduce new arrest sites, ribosome density at other sites relatively decreases. This is likely an artifact from mitoribosomes redistributing from endogenously slow codons to new arrest sites. When looking at carrying out our disome profiling in the presence of anisomycin, we see a similar effect. Cytoribosomes are redistributed from endogenous stalling sites, such as proline, and are redistributed throughout the gene. As a result, translation at proline appears “more efficient” upon treatment with an inhibitor but is instead an artifact of analysis.
Figure 3F could benefit from indicating which mtDNA-encoded protein corresponds to each of the strongest stalling motifs.
We have included a supplementary figure to highlight which mitochondrially-encoded genes containing the R/K/A-X-K motif and noted in the text that mitochondrial translation may be unevenly inhibited.
The legend "increasing mRPF abundance" in Fig. 4C may be missing the corresponding colors.
The legend applies to all sections of the figure. We double-checked the range of the colors in the tables, and they do match the legend.
The observation that the start codons in MT-ND1 and MT-ND5 might differ from the annotated canonical ones is intriguing. While the ribosome profiling data appear clear, mass spectrometry (MS) analysis may be misleading. The absence of evidence does not necessarily imply evidence of absence. How does this proposed conclusion correlate with the structural data obtained from HEK cells? For instance, the cryo-EM structural model of a complex I-containing human supercomplex (PDB: 5XTD, PMID: 28844695) shows the presence of Pro2 in MT-ND1 and the full-length MT-ND5 protein. The authors should carefully examine structural data to ascertain whether alternative forms of MT-ND1 and MT-ND5 are actually observed in the assembled complex I.
We really appreciate this comment. We sat down with an expert in cryo-EM and reviewed the figure. We downloaded the density map and reviewed the N-termini of MT-ND1 and MT-ND5. We only observed the density of the N-terminus of MT-ND1 at low confidence. At an RMSD of 2, we could not observe density for the side chains of Met and Pro, and there are gaps in the density for what is modeled as the main chain. The assignment of these residues may have been overlooked due to the expectation that they should be present in the peptide.
For MT-ND5, we did observe some density that could be part of the main chain; however, it did not fill out until we reduced the stringency, and we did not observe density mapping to side chain residues. To summarize, we do not confidently see density for either the side chain or the main chain for either peptide.
Given that ribosome profiling is based on the assumption that ribosomes protect mRNA fragments from RNase digestion, interpreting the data related to Fig. 5 and the proposed existence of translation events involving ncRNAs is challenging. Most importantly, tRNAs and rRNAs are highly folded RNA molecules and, by definition, are protected by ribosomal proteins. Simultaneously, as the authors point out, "These reads could either be products of random digestion of the abundant background of ncRNAs or be genuine MRPFs." RNase I preferentially digests single-stranded RNA (ssRNA), but excess enzyme can still lead to degradation. Consequently, many random tRNA/rRNA fragments may be generated by RNase digestion, potentially resulting in artifacts. I suggest that the authors examine what happens to these reads when mitochondrial translation is inhibited.
We have low-quality mitoribo-seq with initiation inhibitors and Mnase showing footprints of the same size. We do not have a small-molecule inhibitor that is able to completely ablate translation, as they instead stabilize mitoribosomes at different steps in translation. We have considered alternative ways of capturing a background rRNA and tRNA digestion pattern; however, these have their own drawbacks. Dissociation with EDTA prior to digestion or carrying out library prep on the small and large subunits may capture mitoribosomes no longer in the process of translation; however, dissociated subunits would have different surfaces now available for digestion and may not capture tRNAs.
Regarding the statement, "While the ORF on MT-TS1 is longer, MRPF density was low and we did not observe read phasing and thus it is likely not translated (not shown)," the data should not be excluded unless a clear explanation is provided for why translation would not occur from this specific RNA.
We have included this value in the graph as well as in Supplementary Figure 1.
The graph in Fig. 5B shows the periodicity of only the putative RNR1 ORF, but not that of the other proposed ORFs. What is the reason for this?
We have included the MT-TS1 putative ORF in Figure 5 and Figure S1. Other ORFs did not have density in the ORF. If these are real mitoribosome footprints at these start codons, it may be due to them being transient binding events that never result in elongation. Alternatively, they may be due to tRNA degradation during library preparation.
The assumption that the UUG codon can serve as a start site for mitochondrial translation has not been substantiated. Recent data have identified translation initiation events from non-ATG/ATA codons (near-cognate and sub-cognate) using retapamulin, but UUG was not among them. Can the authors detect such events in their ribosome profiling data collected in the presence of retapamulin, tiamulin, or josamycin?
The report of translation initiation at non-ATG/ATA codons strongly disagrees with our findings. We report that sites of translation initiation observed within annotated coding regions in mitochondria occur at the annotated start sites, while the other report finds frequent alternative initiation events. We have looked for those arrest sites and did not observe them.
In the section "Mitoribosome profiling reveals novel translation events," the title may be misleading given the preliminary nature of the results. To support such a claim, the authors should provide experimental evidence demonstrating that the proposed translation events genuinely exist and result in the synthesis of previously unidentified polypeptides. Alternatively, the interpretation should be approached with greater caution and more clearly indicated as preliminary.
We agree with the reviewers that a distinction should be made between reporting truly novel translation events, like the recently reported MT-ND5-dORF, and sites we suspect mitoribosomes may be binding and that require detailed follow-up. We altered the section title to suggest that this may be showing novel translation events. Additionally, we included a statement in the discussion that these MRPFs may be simply tRNA digestion by RNase I.
Although located at the 5' end of RNR1, the newly identified ORF is situated 79 nt downstream. According to current knowledge, this appears to be a lengthened 5' UTR that may hinder mitoribosome loading. The authors should speculate on potential initiation mechanisms.
The start of the putative ORF is not located 79 nts down, but at the 8<sup>th</sup> nucleotide. The reviewer may be including the tRNA-Phe in their calculation, which is cleaved from MT-RNR1. This start site is closer to the 5’ end than our findings with MT-ND5.
To enhance the interpretation of the mitoribosome profiling data, the authors could complement their findings with classical metabolic labeling using (35)S-methionine. This approach would allow for a different assessment of the stringency of the inhibition under the tested experimental conditions.
We are currently working on these experiments using mito-funcats. A future direction we are taking this work is to understand how the cell responds to different mechanisms of translation inhibition. For example, we are trying to understand if telithromycin, which appears highly selective, only partially inhibits translation of the mtDNA-encoded proteome.
Reviewer #2 (Recommendations for the authors):
Other small editorial comments:
Line 24: "translate proteins"?
Revised for clarity
Line 24: The sentence describing mitochondrial translation as "closely resembling the one in prokaryotes" could be reformulated. While the core of the mitoribosome is conserved, the entire apparatus has many mitochondria-specific features.
Since this is the abstract, we simplified the point by saying that mitoribosomes are more similar to prokaryotic than cytosolic ribosomes.
Clarified to highlight that the mitochondrial system is more similar to the bacterial system than the eukaryotic system.
Line 33: "novel" or "previously unrecognized" ?
Rewritten for clarity.
Lines 33-35: The claim made here is not shown in the paper.
We removed the more aspirational goal of this paper and focused on the main findings of the paper.
Lines 44, 47, 89 (and elsewhere): "cytoplasmic" or "cytosolic" ?
Both terms are used in the literature. We opted for cytoplasmic as it can also include ribosomes not free in the cytosol, such as those bound to the ER.
Reviewer #3 (Recommendations for the authors):
(1) The authors should state why they chose these antibiotics for mitoribosome profiling analysis over other antibiotics from same group. Did they screen multiple antibiotics to determine the candidates for next step?
We selected antibiotics that had a known stalling motif in bacteria (initiation or context-dependent elongation inhibitors). In addition, we carried out mitoribosome profiling with erythromycin, azithromycin, thiostrepton, and kanamycin in this work. However, we did not see any effect from these drugs in mitoribosome profiling. We are currently testing other inhibitors, such as doxycycline and tigecycline, and looking at optimizing treatment conditions to identify stalling motifs in samples that previously showed no difference.
(2) What is the reason for choosing the concentration of antibiotics retapamulin, tiamulin and josamycin, this is IC50 value or above this value? On the other hand, none of this information has been provided for the antibiotics in the next part. The authors should provide biochemical study for the effect of these antibiotics on cell survival and/or protein translation such as S35 assay or steady state level of mtDNA-encoded proteins upon cell treatment with these antibiotics.
Prior to mitoribo-seq, we carried out time and concentration assays with all antibiotics. 100 µg/ml and a 30-minute treatment was tolerable for all antibiotics except retapamulin. We aimed to treat cells with a relatively high concentration of inhibitor in order to capture actively translating mitoribosomes. We were concerned that longer treatments may lead to decreased translation initiation, leading to the capture of fewer mitoribosomes. These concentrations were nearly identical to contemporary conditions carried out in Bibel et al, RNA 2025.
(3) Why did the authors choose MT-CYB as the representative for further analysis in the second and third parts of the manuscript?
We chose MT-CYB because its length allowed for easy visualization. Some mitochondrial genes, such as MT-ND6, had a propensity for stronger stalling at initiation. While coverage was throughout the genes, it was difficult to visualize the changes within the ORF. Also, MT-CYB was less visually complex than polycistronic transcripts. All wigs were uploaded to GEO.
(4) Page 11, line 233-234: the authors state that telithromycin induces stalling at R/K/A-X-K motif. The authors should do further analysis on mitochondrial genome which proteins contain this motif. Furthermore, same as comment 2: the authors should confirm by 35S assay or WB to know which mtDNA-encoded proteins are affected.
We have included a supplementary figure showing which mitochondrial genes contain these motifs.
(5) The results and conclusion from the fourth paragraph are very interesting. The authors suggest alternative start codon for two mtDNA encoded proteins: ND1 and ND5 based on ribosome profiling analysis. Again, I have several comments on this part: <br /> (a) For the accumulation of the alternative start codon of ND1 and ND5 as suggested in the manuscript, do the authors observe this trend with the initiation inhibitors used in the second paragraphs of the manuscript?
We did not observe similar read lengths with retapamulin, tiamulin, or josamycin, which produced read lengths that were consistent with other RNase I footprinted samples.
(b) This observation was further confirmed by MS with a peptide form ND1 protein, the authors should show MS peak indicating MW of the peptide and MS/MS data for the peptide which supports this hypothesis.
We are including the MS/MS report for this peptide.
(c) Interestingly, several high-resolution structures of mammalian complex I have been reported so far (PMID: 7614227, 10396290, 38870289), ND1 and ND5 protein express full sequences with fMet at the distal N-terminal. This is different to the suggestion from the manuscript. Could the author discuss or comment on that?
This point was brought up by another reviewer. We have carefully analyzed the density map of PMID: 28844695. We sat down with an expert in cryo-EM and reviewed the figure. We downloaded the density map and reviewed the N-termini of MT-ND1 and MT-ND5. We only observed the density of the N-terminus of MT-ND1 at low confidence. At an RMSD of 2, we could not observe density for the sidechains of Met and Pro, and there is a gap in density for what is modeled as the main chain. The assignment of these residues may have been overlooked due to the expectation that they should be present in the peptide.
For MT-ND5, we did observe some density that could be part of the main chain; however, it did not fill out until we reduced the stringency, and we did not observe density mapping to side chain residues. To summarize, we do not confidently see density for either the side chain or the main chain for either peptide.
Minor comments:
The method should be written more accurately for easily repeating experiments by other groups. For example:
(1) The authors should indicate what was exact HEK293 cell line used in this study.
We have indicated the exact cell line.
(2) Page 22, line 471: which (number) fractions had been collected. The Western Blot analysis shown in Figure 1A should be repeated with both proteins from small and large subunits.
We have repeated the Western blot with antibodies for large and small subunits. We took fractions 8 and 9, which are now indicated in the text and figure.
(3) Page 23, line 502: is this number of cells used for MS experiment is correct? Or is this number of cells per mL?
This is correct and is based on the kit protocol. It is not cells per mL. We have clarified the kit being used in the methods.
Synthèse sur les Biais Cognitifs et le Raisonnement Humain
Résumé
Ce document de synthèse analyse les concepts clés relatifs aux biais cognitifs, au raisonnement humain et aux stratégies de "débiaisage", en s'appuyant sur l'expertise de Wim De Neys, chercheur au CNRS spécialisé en psychologie du raisonnement.
Les principaux points à retenir sont les suivants :
1. Nature des Biais Cognitifs : Loin d'être de simples "défauts de conception", les biais cognitifs sont avant tout des stratégies de pensée rapides et adaptatives (heuristiques) forgées par l'évolution.
Elles permettent de prendre des décisions efficaces dans un monde complexe, bien qu'elles puissent conduire à des erreurs systématiques et prévisibles dans des contextes spécifiques.
2. Le Modèle Système 1 / Système 2 : Le raisonnement humain est modélisé par l'interaction de deux systèmes.
Le Système 1 est intuitif, rapide et automatique, gérant la grande majorité de nos tâches cognitives quotidiennes.
Le Système 2 est délibéré, lent et coûteux en ressources cognitives, activé pour les tâches complexes.
L'idée que le Système 1 est intrinsèquement "irrationnel" est une simplification excessive ; il est essentiel et souvent correct.
3. La Détection des Conflits Cognitifs : Contrairement à l'idée classique selon laquelle les individus sont des "avares cognitifs" aveugles à leurs propres erreurs, les recherches de Wim De Neys démontrent que le cerveau détecte souvent un conflit lorsque la réponse intuitive (Système 1) contredit un principe logique ou probabiliste.
Ce signal de "doute" se manifeste par des temps de réponse plus longs, une activation de zones cérébrales spécifiques (cortex cingulaire antérieur) et une baisse de la confiance, même lorsque l'individu donne la mauvaise réponse.
4. L'Inefficacité du Débiaisage Général : Les tentatives de rendre les gens globalement "plus rationnels" en les incitant à activer plus souvent leur Système 2 se heurtent à un obstacle majeur : le problème du transfert.
Les compétences acquises dans un domaine spécifique ne se généralisent que très difficilement à d'autres contextes.
5. L'Efficacité de l'Entraînement Intuitif : La stratégie la plus prometteuse pour corriger les biais consiste à entraîner le Système 1 lui-même.
En expliquant aux individus les principes logiques sous-jacents à une tâche spécifique, on peut modifier leurs intuitions.
Après un tel entraînement, la première réponse générée devient souvent la bonne, sans nécessiter l'activation coûteuse du Système 2.
6. Le Rôle de l'Argumentation et de l'IA : Le raisonnement n'est pas seulement une activité individuelle mais aussi une compétence sociale, utilisée pour argumenter et délibérer en groupe.
Dans ce contexte, de nombreux biais (comme le biais de confirmation) peuvent être surmontés.
L'intelligence artificielle (IA) émerge comme un outil potentiellement puissant, capable d'agir comme un partenaire de débat neutre et informé pour faciliter le débiaisage individuel, à condition d'être utilisée de manière interactive et critique plutôt que passive.
1. La Nature Duplice des Biais Cognitifs
Les biais cognitifs, identifiés depuis un demi-siècle par des psychologues et économistes comportementaux comme Daniel Kahneman et Amos Tversky, désignent les failles systématiques du raisonnement humain.
Ils incluent des phénomènes tels que le biais d'ancrage, l'effet de cadrage, le biais de confirmation ou l'erreur de conjonction.
Ces découvertes ont contribué à démanteler le mythe de l'homo economicus, l'agent parfaitement rationnel agissant toujours dans son meilleur intérêt.
Cependant, les biais ne sont pas de simples "erreurs" ou "vices de conception".
Ce sont avant tout des stratégies cognitives rapides et adaptatives, appelées heuristiques, façonnées par l'évolution.
Elles permettent à l'esprit humain de naviguer et de prendre des décisions efficaces dans un environnement complexe, avec des contraintes de temps et d'information.
• Fonction Adaptative : Dans la grande majorité des situations quotidiennes, ces raccourcis mentaux sont "super efficaces" et produisent des réponses correctes.
• Source d'Erreur : Ils deviennent problématiques lorsqu'ils entrent en conflit avec des principes logiques ou probabilistes dans des situations spécifiques, conduisant à des erreurs de jugement.
• Risque de Sur-interprétation : L'omniprésence du concept de biais cognitif peut mener à une erreur de diagnostic, décrite par la "loi de l'instrument" :
"lorsqu'on ne possède qu'un marteau, tout finit par ressembler à un clou".
Attribuer toutes les divergences d'opinion à des biais cognitifs est une simplification abusive.
2. Le Modèle du Double Processus : Système 1 et Système 2
Le modèle le plus populaire pour décrire le fonctionnement du raisonnement humain est celui du duo Système 1 / Système 2, popularisé par Kahneman.
• Système 1 (Pensée Intuitive) :
◦ Caractéristiques : Rapide, automatique, ne nécessite pas d'effort ou de ressources cognitives.
◦ Exemples : Répondre à "5 + 5", connaître le nom du président, conduire une voiture sur un trajet familier.
◦ Rôle : Il gère l'écrasante majorité des tâches cognitives quotidiennes (estimé à 99,9%).
Il est essentiel au fonctionnement humain.
• Système 2 (Pensée Délibérée) :
◦ Caractéristiques : Lent, contrôlé, demande de l'effort et charge les ressources cognitives (mémoire de travail).
◦ Exemples : Calculer "22 x 54", apprendre une nouvelle compétence, analyser un argument complexe.
◦ Rôle : Il est activé pour résoudre des problèmes qui dépassent les capacités du Système 1.
L'idée commune que le Système 1 est la source de toutes les erreurs ("irrationnel") et le Système 2 le garant de la rationalité est une simplification.
Le Système 1 génère très souvent des réponses correctes et valides.
Les biais apparaissent principalement dans les situations où la réponse intuitive rapide du Système 1 entre en conflit avec la conclusion logique qui nécessiterait l'intervention du Système 2.
Exemple Classique : La Négligence des Taux de Base Un problème typique illustrant ce conflit est présenté :
1. Données : Un échantillon de 1000 personnes contient 995 hommes et 5 femmes.
2. Description : On tire une personne au hasard qui "aime bien faire du shopping".
3. Question : Est-il plus probable que cette personne soit un homme ou une femme ?
La réponse intuitive (Système 1), activée par le stéréotype, est "une femme".
La réponse logique (Système 2), basée sur les probabilités (taux de base), est "un homme".
La majorité des gens se trompent en suivant leur intuition, illustrant un biais cognitif.
3. La Détection des Conflits Cognitifs : Le Cœur de la Recherche de Wim De Neys
La vision classique de Kahneman suggère que les gens se trompent car ils sont des "avares cognitifs" (cognitive misers), évitant l'effort du Système 2 et ne se rendant donc pas compte du conflit entre leur intuition et la logique.
Les travaux de Wim De Neys remettent en cause cette idée.
Ils montrent que, même lorsque les individus donnent une réponse incorrecte basée sur leur intuition, leur cerveau détecte souvent le conflit sous-jacent.
Méthodologie et Preuves : Les expériences comparent des problèmes "conflictuels" (où intuition et logique divergent) à des problèmes "non conflictuels" (où elles convergent).
Les résultats montrent que pour les problèmes conflictuels, même chez les personnes qui se trompent :
1. Le Temps de Réponse Augmente : Les participants prennent plus de temps pour répondre, signe qu'un processus supplémentaire a lieu.
2. Activation Cérébrale Spécifique : L'imagerie cérébrale (IRMf) montre une activation accrue du cortex cingulaire antérieur, une région connue pour son rôle dans la détection des conflits.
3. Mouvements Oculaires (Eye-tracking) : Les participants ré-inspectent visuellement les informations conflictuelles (par exemple, les taux de base dans l'exemple précédent).
4. Baisse de la Confiance : Les individus rapportent un niveau de confiance en leur réponse plus faible, ce qui est une manifestation comportementale du doute.
Cette détection est un processus implicite et automatique.
Des expériences où le Système 2 est délibérément surchargé (par une tâche de mémorisation simultanée) montrent que cette détection de conflit persiste.
Cela suggère que nous ne sommes pas totalement aveugles à nos biais ; un signal d'alerte, un "doute", est généré, même si nous ne l'écoutons pas toujours.
4. La Question du "Débiaisage" : Stratégies et Limites
La question centrale est de savoir s'il est possible de "débiaiser" les gens, c'est-à-dire de les rendre plus rationnels et moins sujets aux erreurs de jugement.
• L'Approche "Système 2" et le Problème du Transfert :
◦ L'idée d'apprendre aux gens à simplement "activer leur Système 2 plus souvent" est largement considérée comme inefficace.
◦ La raison principale est le problème du transfert : une compétence apprise pour résoudre un type de problème (par exemple, la négligence des taux de base) n'est pas spontanément appliquée à d'autres types de problèmes, même s'ils reposent sur des principes logiques similaires.
Le "transfert" d'une compétence d'un domaine à un autre est extrêmement difficile à obtenir.
• L'Approche "Système 1" : Rééduquer l'Intuition :
◦ Une stratégie plus efficace consiste à se concentrer sur des biais spécifiques, tâche par tâche. ◦
L'intervention consiste à expliquer clairement à une personne pourquoi son intuition est incorrecte et quel est le principe logique à appliquer.
◦ Des projets comme Kojitum proposent des exercices basés sur ce principe.
◦ Fait crucial : cet entraînement ne fonctionne pas seulement en forçant l'usage du Système 2.
Il modifie directement le Système 1.
Après l'intervention, la première réponse générée intuitivement devient la bonne.
On "crée de bonnes intuitions".
En somme, l'espoir de rendre les gens globalement plus rationnels par une intervention unique est illusoire.
La voie la plus prometteuse est une éducation ciblée qui vise à corriger et à affiner les intuitions du Système 1 sur des problèmes spécifiques et importants.
5. Le Rôle du Contexte Social et de l'Argumentation
La théorie argumentative du raisonnement, développée par Hugo Mercier et Dan Sperber, propose que la fonction première du raisonnement n'est pas la recherche de la vérité en solitaire, mais la capacité à argumenter et à interagir dans un contexte social.
• Le Biais de Confirmation Recontextualisé : Ce biais, qui nous pousse à chercher des informations confirmant nos croyances, semble être un défaut majeur du raisonnement individuel.
Cependant, dans un contexte de débat, il devient un outil efficace pour défendre son point de vue.
• La Sagesse des Groupes : Lorsque les gens raisonnent en groupe, échangent des arguments et justifient leurs positions, de nombreux biais individuels ont tendance à disparaître.
Le groupe parvient collectivement à une meilleure solution, car les arguments sont mis à l'épreuve.
• Justification et Système 2 : C'est principalement le Système 2 qui permet de générer des justifications et des arguments explicites pour convaincre les autres, une fonction sociale essentielle.
6. Perspectives Futures : L'Intelligence Artificielle et le Raisonnement Humain
L'émergence des intelligences artificielles (IA) génératives comme ChatGPT offre de nouvelles perspectives pour le raisonnement humain.
• Potentiel Positif :
◦ Débiaisage Ciblé : Des études montrent que l'IA peut être un outil efficace pour débiaiser les individus, y compris sur des sujets comme les théories du complot.
L'IA est perçue comme neutre et peut fournir des contre-arguments très spécifiques et bien informés que des interlocuteurs humains n'ont pas toujours.
◦ Partenaire de Débat : L'IA peut servir de partenaire dans un "contexte argumentatif".
Interagir avec une IA, lui demander des justifications et la mettre au défi peut stimuler la réflexion critique, de la même manière qu'un débat en groupe.
◦ Assistant Pédagogique : Utilisée intelligemment, l'IA peut devenir un "professeur personnel", aidant les apprenants à améliorer leur travail en fournissant des retours et des explications.
• Risques et Limites :
◦ Usage Passif : Si l'IA est utilisée comme un simple "moteur de réponse" pour obtenir des solutions sans effort, elle risque de ne pas stimuler, voire d'atrophier, les compétences de pensée critique et d'évaluation de l'information.
◦ Biais de Complaisance : Les IA sont souvent conçues pour être complaisantes, ce qui peut renforcer les biais de l'utilisateur au lieu de les remettre en question.
◦ L'Importance de l'Usage : L'impact de l'IA sur le raisonnement dépendra fondamentalement de la manière dont elle est utilisée.
Un usage actif et dialogué est bénéfique, tandis qu'un usage passif est préjudiciable.
La coéducation en éducation prioritaire : enjeux, constats et perspectives
Ce document synthétise l'intervention de Pierre Périer, sociologue et professeur en sciences de l'éducation, concernant la coéducation, particulièrement dans les quartiers populaires et l'éducation prioritaire.
L'analyse met en lumière un double renversement historique : le passage d'une école républicaine construite à distance des familles vers une norme de proximité, et le transfert de la responsabilité de la « fabrication de l'élève » de l'institution vers la famille.
Malgré l'inscription de la coéducation dans la loi de 2013, le concept reste flou pour les acteurs. Un paradoxe majeur subsiste : les parents des élèves les plus en difficulté sont souvent les moins associés au système scolaire.
L'enjeu actuel n'est pas seulement de traiter l'éloignement des parents, mais de comprendre comment le fonctionnement institutionnel et les normes implicites de l'école contribuent à les exclure.
Pour y remédier, Périer propose une refonte de la relation basée sur quatre principes : reconnaissance, autorisation, explicitation et diversification.
--------------------------------------------------------------------------------
La relation entre l'école et les familles a subi des transformations structurelles profondes. Pierre Périer identifie deux mouvements majeurs :
• De la distance à la proximité : Historiquement, l'école s'est bâtie à distance des parents pour protéger l'espace républicain.
Aujourd'hui, le paradigme s'est inversé pour devenir une norme de rapprochement et de participation active.
• La professionnalisation du rôle parental : Autrefois, l'école visait à faire de l'enfant un « petit missionnaire des idées modernes » capable de transformer sa famille.
Aujourd'hui, on attend de la famille qu'elle transforme l'enfant en élève (le « métier d'élève »). La réussite scolaire devient une préoccupation centrale des classes populaires, souvent sous l'angle de l'évitement de l'échec.
--------------------------------------------------------------------------------
Les enquêtes menées auprès de 1000 parents et 2000 enseignants révèlent des décalages significatifs dans la compréhension de la notion de coéducation.
• Parents : 2/3 des parents ne savent pas spontanément à quoi associer le terme.
• Enseignants : La notion est mieux connue, mais associée à un périmètre extrêmement large (520 mots différents cités).
| Perspective | Priorité 1 | Priorité 2 | | --- | --- | --- | | Parents | Instruction scolaire et apprentissages (30%) | Éducation de l'enfant (25%) | | Enseignants | Éducation globale et comportement de l'élève (55%) | Instruction scolaire (21%) |
Note : Pour les parents, la coéducation est un outil pour soutenir la scolarité et les apprentissages, tandis que pour les enseignants, elle vise principalement à garantir que l'enfant se comporte conformément aux attentes institutionnelles.
--------------------------------------------------------------------------------
L'intérêt pour la coéducation décroît à mesure que l'on progresse dans la scolarité :
• Maternelle : 65% des enseignants s'y disent très intéressés.
• Élémentaire : 55%.
• Collège : 41%.
On observe un « décrochage parental » au collège, période où les difficultés scolaires s'accentuent pourtant pour les élèves les plus fragiles.
1. Les parents « en proximité » (34%) : Souvent plus diplômés, membres d'associations, enfants en réussite. Ils sont en « connivence culturelle » avec l'école.
2. Les parents « distants » ou « empêchés » (47%) : Intéressés par le principe mais peu ou pas impliqués concrètement.
3. Les parents « invisibles » (20%) : Profil souvent précaire, zone rurale ou quartiers prioritaires, enfants au collège ou en difficulté. Pour eux, la notion est totalement floue.
--------------------------------------------------------------------------------
L'analyse souligne que l'absence des parents n'est pas synonyme de désintérêt, mais résulte souvent de barrières structurelles et symboliques.
• La domination symbolique : Les parents précaires redoutent d'être pris en défaut sur leur maîtrise de la langue ou des codes sociaux (« savoir bien parler pour ne pas être jugé »).
• Le rapport au temps : Prendre rendez-vous suppose une maîtrise du temps programmatique.
Or, les familles vulnérables vivent souvent dans un temps « chaotique » ou de l'urgence.
• La délégitimation par les devoirs : L'externalisation du travail scolaire à la maison aggrave les inégalités.
Les parents qui veulent aider mais ne maîtrisent pas les méthodes vivent une « disqualification symbolique » devant leurs enfants.
• La norme du « parent d'élève » : L'institution définit implicitement un modèle de parent idéal.
Ceux qui s'en éloignent sont rapidement étiquetés comme « démissionnaires », alors qu'ils sont en réalité surexposés au jugement institutionnel dès qu'un problème survient.
« Ce sont des parents que l'école éloigne, plus qu'ils ne sont éloignés de l'école. »
--------------------------------------------------------------------------------
La période de crise sanitaire a agi comme un révélateur et un accélérateur de tendances :
• Exacerbation des inégalités : Les conditions de logement et l'incapacité d'aider aux devoirs ont créé des tensions extrêmes dans les familles.
• Découverte de l'humain : L'usage du téléphone a permis de briser la froideur institutionnelle.
Certains parents ont vécu pour la première fois une « relation humaine » avec les enseignants, basée sur une parole protégée et bienveillante.
• Reconnaissance mutuelle : Le confinement a permis une meilleure valorisation du travail des enseignants par les parents, et une prise de conscience par l'école que le contact avec les familles dites « éloignées » était possible.
--------------------------------------------------------------------------------
Pour construire une coéducation réelle, Pierre Périer propose quatre principes directeurs :
• Égalité : Droits d'information et de statut identiques.
• Mérite : Considérer et gratifier la contribution réelle de chaque parent.
• Confiance : Elle ne se décrète pas, elle découle de la reconnaissance.
• Légitimer les « parents réels » (tels qu'ils sont) plutôt que des parents de fiction.
• Passer de « faire pour » les parents à « faire avec », voire « faire à partir de » leurs attentes.
• Créer des espaces dédiés (café des parents, lieux de médiation) pour symboliquement leur faire une place.
• Clarifier les rôles : qui fait quoi ?
• Éviter les implicites qui ne profitent qu'aux parents déjà initiés. Plus le code est explicite, plus la relation est égalitaire.
• Multiplier les supports de communication (parole, téléphone, vidéo, objets circulants).
• S'appuyer sur des médiateurs (parents relais, associations d'éducation populaire) pour maintenir le lien avec ceux qui restent en retrait de l'institution.
--------------------------------------------------------------------------------
L'enquête montre que la réussite des élèves passe, selon les acteurs, par trois leviers majeurs :
1. L'allègement des effectifs (pour une attention accrue aux élèves en difficulté).
2. Le développement de la coéducation.
3. Le renforcement des temps d'étude.
La coéducation doit être pensée comme un levier collectif et non comme une affaire individuelle, en s'appuyant sur des outils concrets (vidéos de classe, jeux partagés, guides de communication) qui font circuler les savoirs entre l'école et la maison.
L'Avalanche de Conseils à la Parentalité : Analyse du Stress et de la Responsabilisation Individuelle
Le paysage contemporain de la parentalité est marqué par un paradoxe : malgré une accumulation sans précédent de recommandations, de méthodes et de données scientifiques, les parents témoignent d'un niveau croissant de stress, d'épuisement et d'isolement.
Ce document analyse comment le soutien à la parentalité s'est transformé en un marché lucratif (estimé à 20 millions d'euros en France) et en un outil politique de responsabilisation individuelle.
Sous l'influence du modèle néolibéral, l'éducation est désormais perçue à travers le prisme de la « compétence » et de la « rentabilité », délaissant la dimension affective pour une gestion du risque.
Cette évolution tend à transformer le parent en consommateur et l'enfant en un projet de performance, tout en occultant les responsabilités collectives et les disparités socio-économiques.
--------------------------------------------------------------------------------
L'analyse de Michel Van derbrook montre que les préceptes éducatifs ne sont jamais neutres ; ils reflètent le contexte politique et économique de leur époque.
• L'entre-deux-guerres : Dominée par l'eugénisme, la priorité était de former une « race belle et forte » pour l'État à travers une discipline stricte.
• L'après-guerre : L'amour et la théorie de l'attachement (Bolby) sont passés au premier plan, coïncidant avec le retour des femmes au foyer après le conflit.
• L'ère néolibérale actuelle : On observe un glissement de l'« être » vers le « faire ».
La parentalité est devenue une question de compétences individuelles, où le parent est tenu pour seul responsable de la réussite ou de l'échec de son enfant.
| Période | Valeur centrale | Objectif de l'éducation | | --- | --- | --- | | Entre-deux-guerres | Discipline / Eugénisme | Former un citoyen pour la force de l'État | | Après-guerre | Amour / Attachement | Bien-être de l'enfant et retour au foyer | | Époque actuelle | Compétence / Performance | Rentabilité éducative et autonomie individuelle |
--------------------------------------------------------------------------------
Le discours public actuel tend à pointer du doigt les parents comme les principaux responsables des dysfonctionnements sociétaux.
• La « démission » parentale : Des événements comme les émeutes de juillet 2023 en France ou les mauvais résultats du classement PISA en Belgique sont systématiquement imputés à un manque d'autorité ou d'éducation parentale.
• Le désengagement de l'État : En se focalisant sur la responsabilité individuelle, l'État justifie son propre retrait des investissements sociaux.
La solidarité collective s'efface au profit d'un accompagnement individualisé et souvent payant.
• La logique de consommation : Les parents, isolés et insécurisés, deviennent des consommateurs de solutions « protocolées » (comme le programme Triple P), espérant des résultats garantis par la science.
--------------------------------------------------------------------------------
L'usage des neurosciences dans le domaine de l'éducation, bien qu'apportant des connaissances réelles, génère des pressions excessives par une vulgarisation parfois maladroite.
• Le dogme des « 1000 premiers jours » : Ce concept crée une panique chez les parents, suggérant que tout se joue de manière irréversible au début de la vie.
• Confusion entre périodes « sensibles » et « critiques » : Alors que le cerveau reste plastique tout au long de la vie, le discours ambiant laisse croire qu'un retard ou une erreur éducative initiale ne pourra plus jamais être « réparé ».
• Incompétence ressentie : Cette scientifisation dépossède les parents de leur intuition et de leur bon sens. Ils finissent par se sentir incompétents face à des « experts » qui décryptent le développement de l'enfant à leur place.
• Conséquences juridiques : Dans certains pays (comme la Grande-Bretagne), des lois permettent le passage de la garde temporaire à l'adoption pleine sans l'accord des parents biologiques, au nom de l'urgence d'intervenir durant les 1000 premiers jours.
--------------------------------------------------------------------------------
La relation entre l'école et les parents est marquée par un manque de réciprocité et une solitude partagée.
• Injonctions unilatérales : L'école définit les attentes envers les parents (participation, discipline, suivi) sans toujours écouter les besoins ou les contraintes de ces derniers.
• Sentiment d'illégitimité : Dans les quartiers populaires, de nombreux parents se sentent démunis face à l'opacité de systèmes comme Parcoursup, ce qui renforce leur isolement.
• L'élève comme fardeau personnel : La scolarité est souvent vécue comme une aventure individuelle isolante, tant pour l'enfant que pour ses parents, qui voient les notes de leur enfant comme une évaluation de leur propre réussite parentale.
• Déficit de dialogue : L'absence d'espaces de discussion collective empêche de comprendre les raisons réelles de certains comportements (absentéisme, manque de discipline), souvent liés à des contextes sociaux difficiles plutôt qu'à une volonté de démissionner.
--------------------------------------------------------------------------------
Le secteur de la petite enfance subit une mutation profonde, passant d'un service public à un marché lucratif.
• Privatisation des crèches : Autrefois résistante, la France voit ses structures d'accueil massivement rachetées par des entreprises à but lucratif.
Ce modèle privilégie souvent le bénéfice des actionnaires au détriment de la qualité de l'accueil.
• L'enfant comme actif : Dans une société de compétition, l'enfant est préparé dès le plus jeune âge à être un produit désirable sur le « marché » (diplômes, activités extrascolaires, talents).
• Fracture sociale : On assiste à une segmentation entre une population aisée pouvant s'offrir des conseils et des structures de qualité, et une population moins aisée venant vers les associations en « désespoir de cause ».
--------------------------------------------------------------------------------
« Comment se fait-il que malgré l'accumulation de conseils à leur attention, les parents semblent toujours plus stressés, épuisés, isolés ? » — Michel Van derbrook
« L'éducation est un gros mot... en réalité, tout le monde fait ce qu'il peut.
Qu'on se saigne ou qu'on s'en foute, le résultat recèle toujours sa part de mystère. » — Nicolas Mathieu (cité par M. Van derbrook)
« Les parents sont devenus des consommateurs parce qu'on les a mis dans cette position-là.
Maintenant, on achète notre parentalité au lieu de la vivre en société. » — Béatrice Bayo
« On peut très bien définir la maltraitance, c'est beaucoup plus facile que de définir la bientraitance. » — Michel Van derbrook
La Coéducation comme Relation de Reconnaissance Mutuelle : Synthèse des Travaux de Chloé Riban
Ce document de synthèse s'appuie sur l'analyse de Chloé Riban, maîtresse de conférence à l’Université Paris Nanterre, concernant les relations entre l'institution scolaire et les familles issues de milieux populaires et « ethnicisés ».
Il examine les tensions inhérentes au concept de coéducation et propose des pistes pour transformer cette injonction institutionnelle en une véritable rencontre humaine et paritaire.
--------------------------------------------------------------------------------
La coéducation est devenue un paradigme central de l'école républicaine, passant d'une culture de la séparation à une exigence de partenariat.
Cependant, l'analyse révèle un décalage profond entre les attentes normées de l'institution et la réalité des familles les plus précaires.
Points clés à retenir :
• Un malentendu structurel : L'école attend un « parent idéal » (auxiliaire pédagogique) tandis que les parents, bien que très investis, se heurtent à des barrières de codes, de langage et de précarité.
• L'invisibilité de l'investissement parental : Contrairement aux idées reçues sur la « démission » parentale, les mères de milieux populaires déploient un effort considérable (temporel, psychique et financier) qui reste souvent non reconnu par les enseignants.
• Le poids du stigmate : La rencontre avec l'école est vécue par beaucoup comme une mise en danger, un « jet dans l'arène » où domine la peur du jugement ou du signalement.
• Vers la « parité d'estime » : La réussite de la coéducation repose sur la reconnaissance de la légitimité des parents tels qu'ils sont, en substituant le modèle du débat (confrontation) par celui de la « palabre » (construction commune de sens).
--------------------------------------------------------------------------------
L'école républicaine s'est historiquement construite en excluant les parents, matérialisée par des seuils physiques symboliques. Cette posture a évolué sous l'impulsion de plusieurs jalons législatifs :
• Loi Jospin (1989) : Instauration de la notion de « communauté éducative ».
• Années 2000 : Création des réseaux d'éducation prioritaire (REP), ciblant les populations vulnérables.
• Loi de refondation de l'école (2013) : La coopération avec les parents devient un enjeu majeur pour la réussite des élèves.
L'étude de Chloé Riban s'appuie sur une ethnographie de deux ans en quartier prioritaire et mobilise deux concepts clés :
• Le « Différend » (Pierre Perrier) : Les relations école-familles ne sont pas seulement marquées par des malentendus, mais par un conflit de légitimité et d'intérêts.
• L'approche systémique et intersectionnelle : Il est nécessaire de comprendre l'interdépendance des acteurs et les rapports de pouvoir multiples (classe, genre, origine) qui marquent la rencontre institutionnelle.
--------------------------------------------------------------------------------
L'institution scolaire adresse une demande de coéducation différenciée, ciblant prioritairement les parents jugés « éloignés ».
Les professionnels de l'éducation projettent des attentes précises qui définissent le « métier de parent d'élève » :
• Suivi rigoureux (signature des cahiers, devoirs).
• Participation active à la vie de l'école.
• Maîtrise d'une éthique du dialogue et des codes scolaires.
Une distinction sémantique s'opère souvent dans le discours enseignant : le terme « parent » est réservé à ceux qui préparent l'enfant à son rôle d'élève, tandis que le terme « famille » est utilisé pour désigner un groupe perçu comme décalé ou déficitaire.
Ce regard produit deux figures types :
• Le parent démissionnaire : Accusé de manque d'autorité ou de cadre.
• Le parent qui gâte trop : Accusé d'une affection excessive entravant l'autonomie.
| Facteurs de tension identifiés | Perception enseignante | Réalité des familles populaires | | --- | --- | --- | | Styles éducatifs | Manque de règles incorporées. | Discipline souvent imposée de l'extérieur (non négociée). | | Objectif de la coéducation | Acculturation des parents aux normes scolaires. | Recherche de respectabilité et de soutien. | | Origine des difficultés | Registre culturaliste (« c'est leur culture »). | Conditions matérielles et trajectoires biographiques heurtées. |
--------------------------------------------------------------------------------
Contrairement aux préjugés, les parents en REP témoignent d'une grande confiance envers l'école et d'une ambition forte pour l'ascension sociale de leurs enfants. Leur investissement se manifeste par :
• Des sacrifices financiers : Achats de matériel pédagogique (ardoises, etc.) malgré des budgets contraints.
• Un soutien logistique : Accompagnement chronophage vers les spécialistes (orthophonistes).
• Des incitations verbales : Rappel constant de l'importance de l'école.
L'investissement des parents est souvent freiné par des barrières structurelles :
• Méconnaissance du système : Difficulté à comprendre les rouages de l'orientation (ex: passage au collège).
• Précarité temporelle : Horaires de travail instables (intérim) et urgences administratives empêchant la projection.
• Sentiment d'incompétence : Peur d'être jugé « bête » à cause de la barrière de la langue ou d'un parcours scolaire interrompu.
« Quand on ne parle pas bien français parfois les gens nous trouvent bête alors qu’on n’est pas bête. » — Témoignage d'une mère.
--------------------------------------------------------------------------------
Pour les mères de familles populaires, l'école est un espace public où leur respectabilité est mise en jeu.
• La peur du signalement : L'institution est crainte car elle détient le pouvoir de juger la qualité du parentage, allant jusqu'au risque de signalement.
• Le retrait silencieux : Ce qui est interprété comme du désintérêt est souvent une tactique d'évitement pour échapper au sentiment d'humiliation ou d'injustice.
• L'oscillation : Les parents alternent entre proximité (venir au café des parents) et distance (esquiver un rendez-vous formel) selon le degré de sécurité émotionnelle ressenti.
--------------------------------------------------------------------------------
Pour sortir du modèle de la normalisation, Chloé Riban et Catherine Urtique de Lâtre proposent de refonder la relation sur quatre piliers et trois postures.
1. Accueillir : Créer une relation « d'humain à humain » avant d'être une relation de professionnels à usagers.
2. Informer : Expliciter les codes et les attendus de manière claire.
3. Dialoguer : Accepter que la coéducation puisse inclure le désaccord.
4. Impliquer : Permettre une participation réelle à la vie de l'élève.
Inspiré par Isabelle Stengers, ce modèle propose de remplacer le débat par la palabre :
• Reconnaissance de l'insuffisance : Admettre que ni l'enseignant ni le parent ne détient seul la solution. Chacun est « légitime et insuffisant ».
• Parité d'estime : Considérer que la parole du parent sur son enfant est aussi valable que celle du professionnel.
• Construction de convergences : Chercher un sens commun sans forcer l'accord immédiat.
• Transformer le vocabulaire : Préférer « l'invitation » à la « convocation ».
• Favoriser le contact initial positif : Appeler ou rencontrer chaque parent en début d'année pour se présenter, avant l'apparition de problèmes.
• Permettre la présence d'un tiers : Accepter qu'un parent puisse venir accompagné d'une personne de confiance ou d'un médiateur pour réduire l'anxiété de la rencontre.
• Ouvrir la classe : Les « classes ouvertes » permettent aux parents de comprendre concrètement la réalité du métier d'élève et la complexité du travail enseignant.
--------------------------------------------------------------------------------
La coéducation ne doit pas être une injonction à la conformité, mais un principe éthique de reconnaissance mutuelle.
Elle exige de l'institution qu'elle reconnaisse les « parents réels » dans leur singularité et leurs contraintes, plutôt que de s'épuiser à poursuivre le mirage du « parent idéal ».
Approche Scientifique, Droits des Enfants et Scolarité en Protection de l'Enfance : Synthèse et Perspectives
Ce document synthétise les interventions de Marie-Pierre Mackiewicz, chercheuse en sciences de l'éducation, et de Gabrielle Chouin, conseillère principale d'éducation (CPE) et ancienne enfant placée.
L'analyse met en lumière une déconnexion persistante entre les institutions de la protection de l'enfance et de l'Éducation nationale, entraînant des inégalités majeures dans les parcours scolaires et l'accès à l'autonomie.
Les points saillants incluent l'émergence de la "recherche par les pairs", une méthode participative visant à inclure les jeunes concernés non plus comme de simples objets d'étude, mais comme co-chercheurs pour rééquilibrer les rapports de pouvoir.
Malgré des avancées législatives et des victoires concrètes récentes (comme la bonification Parcoursup en 2024), les statistiques restent alarmantes : 35 % des jeunes sortant de l'Aide Sociale à l'Enfance (ASE) n'ont aucun diplôme.
La réussite de ces élèves repose sur la création d'« alliances éducatives » solides et sur un changement de regard des professionnels sur le potentiel de réussite de ces publics.
--------------------------------------------------------------------------------
L'analyse de Gabrielle Chouin souligne que le partenariat entre la protection de l'enfance et l'Éducation nationale est le facteur déterminant de l'obtention d'un diplôme ou d'une qualification.
• Manque d'information mutuelle : Il existe une méconnaissance profonde des droits et des cultures professionnelles entre les deux services publics (Éducation nationale et ASE).
• Logiques d'orientation opposées : Les processus d'orientation conduits par la protection de l'enfance entrent souvent en conflit avec ceux de l'Éducation nationale, privant le jeune d'une réelle capacité de choix.
• Absence de "Droit Commun" : Paradoxalement, certains dispositifs spécifiques dédiés à l'autonomie des jeunes placés les empêchent d'accéder aux droits communs dont bénéficient tous les autres jeunes.
Le document identifie des freins concrets à la continuité scolaire et à l'insertion :
• La bonification Parcoursup : Jusqu'à récemment, les élèves placés n'étaient pas considérés comme boursiers sur la plateforme car pris en charge par les départements.
Une victoire obtenue le 4 avril 2024 permet désormais à tous ces élèves de bénéficier d'une bonification de vœux sur l'ensemble du territoire français.
• Accès aux moyens financiers (PFMP) : En voie professionnelle, l'absence de compte bancaire personnel pour certains élèves protégés bloque l'accès aux gratifications de stage, entravant leur autonomie et le lien de confiance avec les entreprises.
• Vie quotidienne scolaire : Des actes simples comme la signature de documents pour des sorties scolaires restent complexes en raison des questions d'autorité parentale et de tutelle.
--------------------------------------------------------------------------------
Marie-Pierre Mackiewicz expose une approche de recherche qui associe directement les personnes concernées par l'objet d'étude (enfants, jeunes ou anciens de la protection de l'enfance).
• Gestion des rapports de pouvoir : Inspirée des mouvements des années 70 et des Gender Studies, cette approche vise à réduire la dissymétrie entre le chercheur "expert" et le savoir "profane" des populations minorées ou invisibilisées.
• Collectif de recherche : Le chercheur ne travaille pas sur mais avec un collectif. Cela implique une implication forte des chercheurs universitaires, sortant des cadres de bureaux classiques pour créer une "familiarité" nécessaire (rencontres le week-end, soirées, moments conviviaux).
• Le rôle des "Gatekeepers" : L'accès aux mineurs est souvent filtré par les institutions qui détiennent les "clés" (directeurs de foyers, éducateurs), risquant de biaiser l'échantillon en proposant uniquement des "bons profils".
• Risques identitaires : La recherche peut être violente pour le jeune en le réassignant à une identité stigmatisée ("enfant placé") au moment où il cherche à s'en défaire.
• Protocoles de protection : Il existe une tension entre les protocoles de protection de l'enfance (parfois trop rigides) et la nécessité de recueillir une parole libre et authentique.
• Production de connaissances : Utilisation de méthodes sensibles (discussions plutôt qu'entretiens, photos, dessins).
• Émancipation : Participation à des colloques, création d'associations (ADEPAPE) et même mise en scène de résultats sous forme de pièces de théâtre (notamment au festival d'Avignon).
• Coéducation professionnalisée : Concept décrivant la communication directe entre professionnels de l'école et de la protection de l'enfance en l'absence de parents.
--------------------------------------------------------------------------------
Les données récentes (notamment de France Stratégie, septembre 2024) confirment la fragilité des parcours.
| Indicateur | Jeunes ASE | Jeunes Milieu Social Équivalent | | --- | --- | --- | | Absence de diplôme ou brevet seul | 35 % | 16 % |
Les élèves protégés subissent de manière plus fréquente :
• Des redoublements et des retards scolaires.
• Des déscolarisations fréquentes.
• Une orientation quasi-systématique vers les filières professionnelles.
• Un accès extrêmement limité aux études supérieures.
La réussite ou l'échec d'un parcours dépendent de plusieurs variables critiques :
• Stabilité du placement : Les placements multiples sont des facteurs majeurs d'échec.
• Précocité de la prise en charge : L'âge d'entrée dans le dispositif influence la trajectoire.
• Type d'accueil : Les différences entre familles d'accueil et établissements collectifs marquent les parcours.
• Facteur humain : Le manque de croyance des acteurs institutionnels dans la capacité de réussite de ces enfants est un frein psychologique et structurel majeur.
--------------------------------------------------------------------------------
Le document conclut sur la nécessité d'une transformation profonde des pratiques :
1. Acculturation et Formation Commune : Organiser des temps de formation partagés entre les personnels de l'Éducation nationale (professeurs, CPE, psychologues) et ceux de la protection de l'enfance.
2. Mise en place d'Alliances Éducatives : Créer des partenariats quotidiens concrets autour de la continuité scolaire, au-delà des simples réunions de crise.
3. Effectivité du Droit à la Participation : Ne pas se limiter au témoignage, mais permettre une participation effective des jeunes à la construction des politiques publiques les concernant (via le Conseil de la Vie Lycéenne, les associations d'anciens pairs, etc.).
4. Ressources Documentaires : S'appuyer sur les travaux de l'Observatoire National de la Protection de l'Enfance (ONPE) et les revues de littérature (ex: Aurélie Pico, 2020) pour identifier les facteurs de protection à renforcer.
L'enjeu final est de garantir que chaque acteur se sente investi d'une mission de compensation des inégalités, pour permettre à ces "acteurs faibles" de devenir des citoyens diplômés et autonomes.
Reviewer #2 (Public review):
Summary:
Feng, Jing-Xin et al. studied the hemogenic capacity of the endothelial cells in the adult mouse bone marrow. Using Cdh5-CreERT2 in vivo inducible system, though rare, they characterized a subset of endothelial cells expressing hematopoietic markers that were transplantable. They suggested that the endothelial cells need the support of stromal cells to acquire blood-forming capacity ex vivo. These endothelial cells were transplantable and contributed to hematopoiesis with ca. 1% chimerism in a stress hematopoiesis condition (5-FU) and recruited to the peritoneal cavity upon Thioglycolate treatment. Ultimately, the authors detailed the blood lineage generation of the adult endothelial cells in a single cell fashion, suggesting a predominant HSPCs-independent blood formation by adult bone marrow endothelial cells, in addition to the discovery of Col1a2+ endothelial cells with blood-forming potential, corresponding to their high Runx1 expressing property.
The conclusion regarding the characterization of hematopoietic-related endothelial cells in adult bone marrow is well supported by data. However, the paper would be more convincing, if the function of the endothelial cells were characterized more rigorously.
(1) Ex vivo culture of CD45-VE-Cadherin+ZsGreen EC cells generated CD45+ZsGreen+ hematopoietic cells. However, given that FACS sorting can never achieve 100% purity, there is a concern that hematopoietic cells might arise from the ones that got contaminated into the culture at the time of sorting. The sorting purity and time course analysis of ex vivo culture should be shown to exclude the possibility.
(2) Although it was mentioned in the text that the experimental mice survived up to 12 weeks after lethal irradiation and transplantation, the time-course kinetics of donor cell repopulation (>12 weeks) would add a precise and convincing evaluation. This would be absolutely needed as the chimerism kinetics can allow us to guess what repopulation they were (HSC versus progenitors). Moreover, data on either bone marrow chimerism assessing phenotypic LT-HSC and/or secondary transplantation would dramatically strengthen the manuscript.
(3) The conclusion by the authors, which says "Adult EHT is independent of pre-existing hematopoietic cell progenitors", is not fully supported by the experimental evidence provided (Figure 4 and Figure S3). More recipients with ZsGreen+ LSK must be tested.
Strengths:
The authors used multiple methods to characterize the blood-forming capacity of the genetically - and phenotypically - defined endothelial cells from several reporter mouse systems. The polylox barcoding method to trace the adult bone marrow endothelial cell contribution to hematopoiesis is a strong insight to estimate the lineage contribution.
Weaknesses:
It is unclear what the biological significance of the blood cells de novo generated from the adult bone marrow endothelial cells is. Moreover, since the frequency is very rare (<1% bone marrow and peripheral blood CD45+), more data regarding its identity (function, morphology, and markers) are needed to clearly exclude the possibility of contamination/mosaicism of the reporter mice system used.
Perspective Institutionnelle et Historique des Droits de l’Enfant : Synthèse de l’Intervention de Marie Derain de Vaucresson
Ce document de synthèse analyse les points clés de l'intervention de Marie Derain de Vaucresson, ancienne adjointe au Défenseur des enfants.
Il retrace l’évolution des droits de l'enfant, du registre de la charité à celui des droits opposables, tout en examinant les cadres législatifs français et les défis persistants de la scolarisation des enfants placés.
L'approche des droits de l'enfant a connu une mutation profonde, passant d'une protection caritative au XVIIe siècle à une reconnaissance de l'enfant comme sujet de droits avec la Convention internationale des droits de l'enfant (CIDE) de 1989.
L'intervention souligne que si tous les enfants doivent être protégés, les "enfants placés" font face à des vulnérabilités spécifiques, notamment des ruptures dans leur parcours scolaire.
L’évolution législative française (lois de 2007, 2016 et 2022) reflète un changement de paradigme : la priorité est passée de la préservation de la famille à la satisfaction des besoins fondamentaux de l'enfant.
La réussite de cette protection repose désormais sur une coopération pluridisciplinaire accrue entre l'Éducation nationale, les services sociaux et la santé.
--------------------------------------------------------------------------------
L'histoire de la protection de l'enfance s'articule autour de plusieurs étapes clés, souvent déclenchées a posteriori par des constats de mise en danger.
• XVIIe siècle : L'approche caritative émerge avec Vincent de Paul, qui organise l'accueil des enfants abandonnés sur le parvis des églises.
• Milieu du XIXe siècle (1842) : Première loi organisant la protection des enfants au travail.
Elle fixe l'âge minimum à 8 ans pour travailler dans les mines et limite le temps de travail (8h pour les 8-12 ans, 12h pour les 12-16 ans).
• Fin du XIXe siècle (1882) : L'obligation d'instruction (de 6 à 13 ans) vient concurrencer le travail des enfants dans l'industrie et les champs.
• Janusz Korczak : Médecin et pédagogue polonais, il révolutionne l'approche pédagogique en considérant l'enfant comme une personne à part entière.
Dans son orphelinat du ghetto de Varsovie, il instaure une "mini-société" avec un tribunal des enfants et un journal, prônant l'autonomie et la participation.
• Évolutions textuelles : La première Déclaration des droits de l'enfant (1924) est impulsée par Eglantyne Jebb, suivie d'une version renforcée en 1959.
Toutefois, ces textes restent des déclarations non opposables aux États.
--------------------------------------------------------------------------------
Adoptée à l'unanimité le 20 novembre 1989, la CIDE transforme les principes moraux en obligations juridiques pour les États.
| Principe | Description | | --- | --- | | Opposabilité | Contrairement à une déclaration, la Convention est un traité international qui oblige les États à transposer ses dispositions en droit interne. | | Intérêt supérieur | Traduit de l'anglais the best interest, il s'agit de rechercher le "meilleur intérêt" de l'enfant face à des intérêts multiples ou conflictuels. | | Non-discrimination | Garantie d'accès aux droits sans distinction (le droit français identifiant aujourd'hui environ 24 critères de discrimination). | | Participation | L'enfant a le droit d'exprimer son opinion sur les décisions le concernant (famille, école, justice). |
L'intervention présente les droits de l'enfant comme une balance entre deux plateaux :
1. Le plateau de la protection : Il pèse très lourd pour les jeunes enfants incapables de se défendre seuls.
2. Le plateau de la participation : Il prend du poids à mesure que l'enfant grandit, lui permettant de devenir acteur de son propre destin.
--------------------------------------------------------------------------------
La France a ratifié la CIDE en août 1990. Depuis, plusieurs mécanismes de défense ont été mis en place.
• Le Défenseur des enfants (2000) : Institution indépendante créée pour promouvoir les droits et traiter les réclamations individuelles.
• Le Défenseur des droits (2011) : Cette instance a absorbé le Défenseur des enfants. Elle dispose de pouvoirs d'intervention accrus :
◦ Accès direct aux lieux fermés (centres de rétention, centres éducatifs fermés).
◦ Capacité de formuler des recommandations formelles aux administrations (Rectorats, Conseils départementaux).
◦ Saisine possible par les enfants eux-mêmes ou par des adultes signalant un droit bafoué.
--------------------------------------------------------------------------------
Le droit français a connu trois réformes majeures en quinze ans, marquant une rupture avec le "profamilialisme" historique.
1. Loi de 2007 : Elle structure la décentralisation vers les départements et crée les Cellules de Recueil des Informations Préoccupantes (CRIP).
Elle est toutefois critiquée pour avoir parfois retardé des placements nécessaires en tentant de maintenir le lien familial à tout prix.
2. Loi de 2016 : Inversion du paradigme. On ne part plus de la famille, mais de l'enfant et de ses besoins.
Elle insiste sur la stabilité des parcours, le maintien des liens avec les frères et sœurs, et la recherche de l'adoptabilité.
3. Loi de 2022 (Loi Taquet) : Elle vise à remobiliser l'État aux côtés des départements.
Elle met l'accent sur la protection des jeunes majeurs (au-delà de 18 ans) et l'implication de la société civile.
Citation marquante : "L'approche par les droits n'a jamais été acquise en protection de l'enfance et elle est encore un combat à défendre."
--------------------------------------------------------------------------------
L'intervention souligne que si tous les enfants sont des élèves, ils sont avant tout des enfants dont le destin peut entraver l'apprentissage.
• Parcours hachés : Les ruptures de placement (succession de familles d'accueil ou d'établissements) entraînent des ruptures scolaires.
• Absence de scolarisation : En 2011, environ 4 % des adolescents placés n'étaient pas scolarisés.
• Délais d'évaluation : Les périodes de transition (évaluation globale de la situation) peuvent durer plusieurs mois, privant l'enfant d'école durant des moments clés comme l'apprentissage de la lecture.
• Pluridisciplinarité : Nécessité d'une coordination étroite entre les chargés de mission "enfants protégés" des Rectorats et les services de l'Aide Sociale à l'Enfance (ASE).
• Unités mobiles : L'idée que "l'école aille aux enfants" lors de phases critiques de placement pour éviter les déscolarisations prolongées.
• Vision immédiate : Les droits de l'enfant ne doivent pas être perçus comme la préparation d'un "citoyen de demain", mais comme des droits applicables "ici et maintenant", y compris dans le cadre du placement.
--------------------------------------------------------------------------------
La protection de l'enfance et le respect des droits fondamentaux sont présentés comme une responsabilité collective.
L'enjeu actuel réside dans la capacité des acteurs institutionnels à dépasser leurs silos respectifs pour construire des réponses adaptées aux réalités territoriales, garantissant ainsi que le statut d'enfant placé ne soit plus un obstacle à la réussite scolaire et au développement personnel.
a contar da data do ajuizamento
RECURSO EXTRAORDINÁRIO. CONSTITUCIONAL E PROCESSUAL. MANDADO DE SEGURANÇA. VALORES DEVIDOS ENTRE A DATA DA IMPETRAÇÃO E A IMPLEMENTAÇÃO DA ORDEM CONCESSIVA. SUBMISSÃO AO REGIME DE PRECATÓRIOS. REPERCUSSÃO GERAL RECONHECIDA. REAFIRMAÇÃO DE JURISPRUDÊNCIA.
Tema 831
Tese - O pagamento dos valores devidos pela Fazenda Pública entre a data da impetração do mandado de segurança e a efetiva implementação da ordem concessiva <u>deve</u> observar o regime de precatórios previsto no artigo 100 da Constituição Federal.
Outras ocorrências Observação (1)
Impact des Éco-émotions sur la Jeunesse : Analyse et Perspectives
Ce document de synthèse analyse les interventions d'Arnaud Sapin concernant l'impact de la crise environnementale sur la vie affective et psychologique des jeunes.
Il examine les mécanismes de l'éco-anxiété, la diversité des émotions climatiques et les stratégies d'accompagnement pour les éducateurs et les parents.
Synthèse de la problématique
L'éco-anxiété ne doit pas être perçue comme une pathologie mentale en soi, mais comme une préoccupation rationnelle face à une situation climatique objectivement alarmante. Selon les données du GIEC, la trajectoire actuelle menace la disponibilité des ressources (eau, nourriture) et la biodiversité, tout en prévoyant jusqu'à 200 millions de réfugiés climatiques d'ici 2050.
Pour la jeunesse, cette réalité se traduit par un bouleversement profond des émotions et des projections dans l'avenir.
Le défi majeur réside dans la transition d'une anxiété paralysante vers un engagement constructif. Alors que les émotions négatives (tristesse, colère, impuissance) prédominent chez les 16-25 ans, l'enjeu pour les adultes est de valider ces ressentis tout en stimulant le pouvoir d'agir des jeunes pour transformer ces tensions en leviers de changement.
--------------------------------------------------------------------------------
L'éco-anxiété n'est pas un bloc monolithique mais un spectre d'intensités :
• Inquiétude modérée : Une préoccupation saine qui peut motiver une remise en question des habitudes.
• Anxiété profonde : Une anticipation négative et forte de l'avenir climatique, souvent liée à l'idée d'effondrement (collapsologie).
• Dimensions existentielles : Elle interroge le rapport à la finitude, à la mort et à l'identité personnelle et collective.
Au-delà de l'anxiété, une diversité de réactions affectives émerge :
| Émotion | Caractéristiques et Origines | | --- | --- | | Tristesse et Deuil | Sentiment de perte lié à la disparition de la biodiversité ou du patrimoine. On parle de solastalgie pour la douleur liée à la perte d'un lieu naturel cher. | | Colère | Émotion politique dirigée vers des cibles identifiées comme responsables (institutions, entreprises, générations précédentes). | | Culpabilité | Responsabilité dirigée vers soi-même ("je ne fais pas assez"). | | Impuissance | Sentiment de ne disposer d'aucun levier pour remédier à la gravité de la situation. | | Espoir | Peut être irréaliste (attente d'une solution technique externe) ou constructif (engagement actif). |
--------------------------------------------------------------------------------
Une étude internationale de 2021 menée dans 10 pays (dont la France) auprès de 10 000 jeunes révèle l'ampleur du phénomène.
Les jeunes Français se distinguent par un pessimisme et un sentiment d'impuissance plus marqués que la moyenne mondiale :
• Tristesse : 66 % (Monde) / 63 % (France).
• Anxiété : Environ 60 % dans les deux cas.
• Optimisme : 30 % (Monde) / 22 % (France).
• Sentiment d'impuissance : 56 % (Monde) / 68 % (France).
• Colère : 56 % (Monde) / 60 % (France).
« Huit personnes sur dix ressentent de l’éco-anxiété... ce n’est pas un phénomène à la marge, c’est un phénomène majoritaire. » — Arnaud Sapin.
--------------------------------------------------------------------------------
Pour gérer la tension émotionnelle, les individus utilisent différentes stratégies de "coping" :
1. Centré sur l'émotion : Partage des ressentis, distraction, évitement ou déni pour se protéger.
2. Centré sur le sens : Réévaluation positive ("voir le verre à moitié plein") ou minimisation de la gravité.
3. Centré sur le problème : Passage à l'action pour transformer l'émotion en ressource.
Elle est identifiée selon trois critères principaux :
• Intensité et durée : Une souffrance forte qui s'installe durablement.
• Répercussions fonctionnelles : Troubles du sommeil, perte d'appétit, conflits relationnels.
• Paralysie : L'anxiété mobilise toute l'énergie de l'individu, l'empêchant paradoxalement d'agir pour l'environnement.
L'avenir est perçu à travers un prisme pessimiste par 27 jeunes sur 30 interrogés (dégradation des conditions de vie, conflits). Cela influence :
• La carrière : Recherche de métiers à impact ou refus de travailler pour des entreprises polluantes.
• La parentalité : Questionnement profond sur la responsabilité de mettre au monde un enfant dans un contexte de crise (évoqué dans 23 entretiens sur 30).
--------------------------------------------------------------------------------
L'école est citée comme le premier acteur de sensibilisation, mais son action peut être contre-productive si elle se limite à une saturation d'informations sans offrir d'espace d'expression.
• Saturation et fragmentation : Trop d'informations déconnectées du pouvoir d'agir.
• Fossé générationnel : Sentiment de trahison envers les aînés et désillusion face aux figures d'autorité.
• Manque d'espace émotionnel : L'école instruit mais offre rarement un cadre pour exprimer la peur ou la colère.
Pour accompagner les jeunes, les adultes doivent adopter une posture proactive et empathique :
• Valider l'émotion : Ne pas minimiser la peur ; confirmer que ces ressentis sont normaux et rationnels.
• Cultiver l'espoir constructif : Mettre l'accent sur les avancées (scientifiques, associatives) et les rôles modèles.
• Stimuler le sentiment de compétence : Aider les jeunes à identifier des leviers d'action locaux et concrets, sans leur faire porter seuls la responsabilité du monde.
• Inscrire l'action dans le collectif : Sortir de l'approche individuelle pour créer du lien social autour de projets communs.
• Être un modèle : Aligner ses propres comportements (mobilité, consommation) pour réduire la défiance des jeunes envers l'autorité.
« On peut transformer des émotions négatives en émotions positives en passant à l'action... c’est plus joyeux d’agir. » — Citation d'une pâtissière de 24 ans.
--------------------------------------------------------------------------------
L'éco-anxiété témoigne d'une jeunesse lucide et sensible. L'enjeu de l'accompagnement n'est pas de supprimer cette anxiété par le déni ou la "pensée magique" technologique, mais de l'intégrer comme une force de transformation.
En transformant l'information en savoir et le savoir en action, les éducateurs peuvent aider les jeunes à retrouver un sentiment de maîtrise sur leur propre futur.
Cette transcription d'une conférence explore les inégalités scolaires en France à travers le prisme de la socio-géographie.
L'exposé examine les théories sociologiques existantes sur le capital culturel et la reproduction sociale, mettant en lumière le rôle de la socialisation familiale et des stratégies scolaires.
Il analyse ensuite l'impact spatial de la ségrégation scolaire et l'influence des politiques publiques, notamment le système Parcoursup, sur les trajectoires éducatives.
Enfin, la conférence propose des pistes de recherche pour mieux comprendre et potentiellement réduire ces inégalités.
Voici un sommaire minuté de la transcription :
0:00-1:09 Introduction et présentation du plan de la conférence : Leïla Frouillou se présente et explique le déroulement de sa présentation, qui sera divisée en deux parties. La première partie portera sur la sociologie des inégalités sociales à l'école, tandis que la seconde partie s'intéressera à la dimension spatiale de ces inégalités.
1:09-4:19 La sociologie des inégalités scolaires : un rappel historique : Frouillou retrace l'évolution de la sociologie de l'éducation, en soulignant le passage d'une approche centrée sur la socialisation des jeunes générations à une approche axée sur les inégalités sociales à l'école. Elle explique comment la massification du système scolaire a conduit à une reconfiguration des inégalités.
4:19-9:08 Le concept de capital culturel et son rôle dans la reproduction des inégalités : Frouillou aborde le concept de capital culturel développé par Bourdieu et Passeron. Elle explique comment ce capital, transmis de génération en génération, contribue à la reproduction des inégalités scolaires. Elle évoque également la notion d' "idéologie du don" qui permet de légitimer ces différences.
9:08-13:48 Massification scolaire et reconfiguration des inégalités : Frouillou analyse les différentes vagues de massification scolaire et leurs effets sur les inégalités. Elle montre que malgré une augmentation globale du niveau d'éducation, les inégalités persistent et se reconfigurent, notamment au niveau des parcours scolaires et des filières choisies.
**13:48-26:36 Ouverture de la "boîte noire" du capital culturel : le rôle des socialisations familiales ** : Frouillou s'intéresse aux travaux qui cherchent à comprendre comment le capital culturel est transmis au sein des familles. Elle met en lumière l'importance du langage, du rapport au temps et à l'autorité dans la construction des inégalités scolaires. Elle évoque également les travaux de Stéphane Boneri sur les pratiques lectorales des familles.
26:36-36:07 Trajectoires transclasses et stratégies scolaires des familles : Frouillou examine les trajectoires transclasses, qui remettent en question le modèle de reproduction des inégalités. Elle évoque également les différentes stratégies scolaires développées par les familles pour favoriser la réussite de leurs enfants, comme l'évitement scolaire ou les activités extrascolaires.
36:07-43:48 Le rôle spécifique de l'école dans les inégalités scolaires : Frouillou met l'accent sur le rôle de l'école dans la reproduction des inégalités. Elle critique notamment l'individualisation des parcours et l'arbitraire culturel des programmes scolaires. Elle évoque également les travaux qui analysent les pratiques pédagogiques et les dispositifs d'orientation, soulignant les biais inconscients qui peuvent défavoriser les élèves de milieux populaires.
43:48-52:31 La dimension spatiale des inégalités scolaires : la ségrégation scolaire : Frouillou introduit la notion de ségrégation scolaire, qui désigne la concentration d'élèves défavorisés dans certains établissements. Elle explique comment cette ségrégation, souvent liée à la ségrégation résidentielle, contribue à renforcer les inégalités scolaires.
52:31-1:01:10 Focus sur Parcoursup : un exemple de gouvernementalité néolibérale : Frouillou présente ses travaux de recherche sur Parcoursup, plateforme d'affectation post-bac. Elle analyse ce dispositif comme une forme de gouvernementalité néolibérale qui renforce la sélection et la concurrence entre les élèves. Elle met en évidence les effets de la plateforme sur les aspirations et les affectations des étudiants, notamment en région parisienne.
1:01:10-1:02:44 Conclusion et perspectives de recherche : Frouillou conclut sa présentation en soulignant l'importance d'étudier les inégalités scolaires à différentes échelles et en tenant compte de la cumulativité des processus. Elle évoque ses perspectives de recherche sur le fonctionnement des commissions d'évaluation des vœux en master.
1:02:44-1:09:56 Session de questions-réponses : Frouillou répond aux questions de l'auditoire sur des sujets tels que la politique de l'offre scolaire, les raisons du développement de politiques néolibérales en éducation et les stratégies mises en place par les familles.
1:09:56-1:19:15 Conclusion de la conférence : La conférence se termine par des remerciements et des applaudissements.
Briefing sur la Coéducation : Analyse des Regards Croisés entre Parents et Enseignants
Ce document de synthèse s'appuie sur l'enquête inédite menée par Pierre Périer, sociologue et professeur en sciences de l’éducation à l’université de Rennes (laboratoire CREAD), présentée lors d'une conférence pour la plateforme Léa.fr.
L'étude analyse les dynamiques, les représentations et les freins liés à la coéducation en France.
La coéducation, bien qu’institutionnalisée par la loi de 2013, reste un concept en quête de définition pratique sur le terrain.
L'enquête révèle un consensus massif sur l'intérêt du principe (plus de 80 % d'adhésion), mais met en lumière une « coéducation empêchée » par des contraintes structurelles, temporelles et culturelles.
Si les parents envisagent la coéducation comme une responsabilité partagée globale (instruction et éducation), les enseignants ont tendance à la restreindre à la sphère éducative, tout en manifestant une posture défensive face à une potentielle intrusion parentale.
Le défi majeur réside dans la co-construction de projets locaux qui dépassent les simples routines institutionnelles (fêtes d'école, réunions de rentrée) pour devenir un véritable levier de réussite scolaire, particulièrement dans les contextes de précarité ou de transition vers le collège.
--------------------------------------------------------------------------------
L'étude se présente comme la première étape d'un travail au long cours visant à défricher l'appropriation du terme « coéducation ».
• Échantillon : Plus de 1 000 parents (représentatifs par CSP et région) et 2 000 enseignants (membres de la plateforme Léa.fr).
• Profils : Une forte féminisation est observée (71 % de femmes chez les parents, 92 % chez les enseignants).
La diversité des contextes est représentée, incluant l'enseignement public et privé, ainsi que l'éducation prioritaire (8 % des parents répondants).
• Méthode : Questionnaire en ligne avec questions ouvertes et fermées, permettant de recueillir plus de 5 000 termes associés spontanément à la coéducation.
--------------------------------------------------------------------------------
L'analyse des nuages de mots révèle que parents et enseignants n'attribuent pas la même portée au terme.
| Dimension | Point de vue des Parents | Point de vue des Enseignants | | --- | --- | --- | | Concepts clés | Ensemble, valeurs, respect, responsabilité, communauté. | Collaboration, partenariat, coopération, échange, lien. | | Périmètre | Instruction scolaire + Éducation (vision globale de l'enfant). | Principalement Éducation (comportement, règles de vie). | | Objectif | Réussite globale et bien-être de l'enfant. | Préparation de l'élève à l'apprentissage (scolarisabilité). |
Le clivage instruction/éducation : Les enseignants attendent souvent des parents qu'ils préparent l'enfant à son rôle d'élève (discipline, autonomie), tandis qu'ils conservent la primauté sur l'instruction.
Les parents, de leur côté, ne distinguent pas aussi nettement l'enfant de l'élève.
--------------------------------------------------------------------------------
3. L'Intérêt versus l'Implication : Le Paradoxe de l'Action
Il existe un décalage significatif entre l'adhésion de principe et la pratique réelle.
• Intérêt déclaré : Massif (81 % des parents, 94 % des enseignants).
• Implication effective : Seul un tiers des parents et des enseignants se disent "très impliqués".
• La "coéducation empêchée" : Environ 50 % des deux groupes sont intéressés mais peu impliqués.
Ce phénomène s'explique par un manque de clarté sur les "règles du jeu" et les finalités de cette coopération.
• Facteurs d'éloignement : Les parents les plus en retrait sont souvent ceux dont les enfants sont au collège, ceux qui sont peu familiers avec l'institution ou dont les enfants sont en difficulté scolaire (paradoxe de l'éloignement).
--------------------------------------------------------------------------------
L'enquête identifie plusieurs barrières qui freinent le déploiement d'une coéducation fluide.
• Manque de temps : Horaires de travail décalés ou indisponibilité des enseignants.
• Sentiment d'illégitimité : Certains parents ne se sentent pas autorisés à franchir le "seuil symbolique" de l'école (effet portail).
• Invisibilité : 40 % des parents pensent que les autres parents manquent d'intérêt, ce qui traduit une difficulté à créer une dynamique collective.
• Crainte de l'intrusion : Peur que les parents ne s'immiscent dans les méthodes pédagogiques ou ne contrôlent le travail de l'enseignant.
• Vulnérabilité et solitude : Sentiment de solitude face à des parents parfois perçus comme agressifs ou "colonisateurs", aggravé par des événements traumatisants (assassinat de Samuel Paty, suicides dans la profession).
• Manque de formation : La relation avec les familles n'est pas une compétence innée et n'est pas suffisamment valorisée institutionnellement.
--------------------------------------------------------------------------------
Pour transformer la coéducation en un levier d'égalité des chances, plusieurs pistes sont avancées par les acteurs.
• Numérique : Les parents sont favorables à des applications favorisant l'interactivité et la communication immédiate (suivi des difficultés, cahiers de vie en ligne).
Cependant, l'outil ne doit pas remplacer le lien humain, notamment pour les familles éloignées de l'écrit.
• Guides pratiques : Les enseignants privilégient l'élaboration de guides précisant les rôles et responsabilités de chacun.
• Informel et convivialité : Le développement de "cafés des parents", de lieux passerelles ou d'activités de loisirs (sport, jeux de société en maternelle) aide à briser les barrières symboliques.
1. Co-construction : La coéducation ne doit pas être descendante. Les parents doivent être associés à la définition des projets dès leur genèse.
2. Explicitation des rôles : Clarifier le périmètre d'intervention de chaque partie pour construire une relation de confiance.
3. Gestion du temps : Aménager des temps dédiés à cette mission pour éviter qu'elle ne soit perçue comme une surcharge chronophage.
4. Médiation : Utiliser des tiers (CPE, associations, parents traducteurs dans les contextes migratoires) pour faciliter le lien et la compréhension mutuelle.
L'enfant ne doit pas être un simple objet de communication entre adultes.
Il doit être associé à la coéducation de manière différenciée selon son âge et le sujet traité (particulièrement sur les méthodes de travail et l'autonomie), tout en préservant la légitimité des parents sur les questions éducatives sensibles.
--------------------------------------------------------------------------------
La coéducation est perçue par tous comme un facteur clé de la réussite des élèves (troisième priorité des parents, deuxième pour les enseignants).
Toutefois, son succès dépend de la capacité de l'institution à sortir des routines pour proposer des conditions concrètes de dialogue, de formation et de reconnaissance du rôle des familles, dans toute leur diversité.
composto
O Tribunal que julgará o crime de responsabilidade do Governador será composto: - 5 deputados eleitos pela Assembleia; - 5 desembargadores sorteados. - O presidente deste tribunal será o Presidente do Tribunal de Justiça do Estado.
No entanto, ATENÇÃO: - A admissibilidade da acusação é julgada exclusivamente pela Assembleia. Com isso, por maioria absoluta, a Assembleia decreta a procedência da acusação realizada, suspende o Governador de suas funções e, após isso, terá início o julgamento pelo Tribunal composto por Desembargadores e Deputados.
Analyse de la Coéducation et des Relations École-Familles : Enjeux, Limites et Perspectives
Depuis les années 1980, le système éducatif français a placé la relation entre l'école et les familles au cœur de ses priorités, notamment à travers les zones d'éducation prioritaire (ZEP).
L'objectif de la « coéducation » est de transformer les parents en partenaires essentiels de la réussite scolaire.
Cependant, cette ambition se heurte à une réalité sociale complexe : les dispositifs mis en place (cafés des parents, REAP) reposent souvent sur la norme implicite du « parent idéal » — visible, disponible et maître des codes scolaires.
Cette approche tend à favoriser les classes moyennes et supérieures (« parents experts ») tout en marginalisant les familles populaires (« parents décrochés »), exacerbant ainsi les inégalités qu'elle est censée réduire.
Le document qui suit détaille les mécanismes de cette relation, le rôle ambigu de l'enfant comme médiateur, et les pistes pour une école véritablement inclusive.
--------------------------------------------------------------------------------
La transformation des relations école-familles s'est opérée par une institutionnalisation progressive de la place des parents.
• L'impulsion des années 80 : L'école a cherché à se rapprocher des familles, particulièrement dans les zones d'éducation prioritaire (ZEP), pour inclure les parents dans le processus de réussite.
• La multiplication des dispositifs : Plusieurs structures ont été créées pour favoriser ce dialogue :
◦ Les Cafés des Parents : Espaces d'échange informels.
◦ Les REAP : Réseaux d'Écoute, d'Appui et d'Accompagnement des Parents.
◦ Les instances représentatives : Associations de parents d'élèves élus.
• Le paradigme du partenariat : L'idée centrale est que l'école ne peut assumer seule la mission éducative ; le parent est perçu comme un partenaire indispensable à l'accompagnement de l'enfant.
--------------------------------------------------------------------------------
Le partenariat école-famille repose sur des attentes normatives qui ne tiennent pas compte de la diversité des situations sociales.
Le système produit une distinction entre deux profils types, basée sur la maîtrise des codes scolaires :
| Profil de Parent | Caractéristiques | Impact sur l'Enfant | | --- | --- | --- | | Parents « Experts » (Classes moyennes/supérieures) | Décodent les attentes scolaires, familiarisés avec les codes de performance. | Renforcement du capital scolaire et de la réussite. | | Parents « Décrochés » (Classes populaires) | Manquent de ressources ou de temps, horaires décalés, barrière de la langue. | Risque accru de décrochage scolaire par manque de relais. |
Pour de nombreuses familles, l'engagement demandé par l'école est un défi structurel :
• Contraintes temporelles : Travail en horaires décalés.
• Barrières linguistiques : Difficultés à comprendre les bulletins ou à participer aux réunions.
• Pression à la légitimité : Seuls les parents visibles et engagés sont valorisés. Ceux qui ne répondent pas à ces critères sont souvent étiquetés comme « démissionnaires » ou « invisibles ».
--------------------------------------------------------------------------------
Face à la défaillance ou à la complexité du lien direct entre l'école et les parents, l'élève devient le gestionnaire de cette relation.
• La fonction de relais : L'enfant traduit, transmet et interprète les messages entre l'institution et le foyer.
• Conséquences positives : Cela peut responsabiliser l'élève et lui donner une certaine autonomie.
• Risques et dérives :
◦ Isolement : L'enfant porte seul le poids des difficultés scolaires.
◦ Distorsion de l'information : En tant que porteur du message, l'élève peut déformer ou omettre des informations sensibles pour se protéger.
◦ Découragement : La gestion de ce conflit de loyauté ou de cette complexité administrative peut mener au découragement.
--------------------------------------------------------------------------------
Bien que la coéducation soit pensée pour l'inclusion, elle exerce en pratique des mécanismes d'exclusion.
1. L'asymétrie de l'adaptation : Les dispositifs comme les cafés des parents sont souvent perçus comme des outils de contrôle.
L'école attend que les parents s'adaptent à son rythme et à ses exigences, sans que l'institution ne modifie ses propres structures en retour.
2. La négociation de la distance : Les parents doivent trouver la « bonne distance » avec l'école.
Un manque de présence est jugé sévèrement, tandis qu'une trop grande proximité peut être perçue comme intrusive.
3. Le miroir des inégalités : Loin de gommer les disparités sociales, ces dispositifs peuvent les rendre plus visibles et les aggraver en favorisant ceux qui possèdent déjà les codes de l'institution.
--------------------------------------------------------------------------------
Pour dépasser ces paradoxes, l'analyse suggère une mutation profonde de la relation partenariale :
• Reconnaissance de la diversité des ressources : Admettre que toutes les familles n'ont pas les mêmes capacités (temps, langue, culture scolaire) et ajuster les attentes en conséquence.
• Prise en compte du structurel : Ne pas réduire les difficultés de relation à une simple question culturelle, mais intégrer les facteurs sociaux et économiques.
• Flexibilité et Accessibilité :
◦ Proposer des horaires de réunion adaptés aux parents qui travaillent.
◦ Utiliser des outils numériques simples pour faciliter la communication.
• Vers un partenariat souple : Créer un espace où l'école s'adapte également aux besoins réels des familles, faisant de l'institution un véritable espace inclusif qui ne laisse personne « sur le bord de la route ».
RRID:AB_2491009
DOI: 10.64898/2026.01.29.702669
Resource: (Cell Signaling Technology Cat# 9145, RRID:AB_2491009)
Curator: @scibot
SciCrunch record: RRID:AB_2491009
RRID:AB_2313606
DOI: 10.1016/j.neuron.2025.12.037
Resource: (Vector Laboratories Cat# BA-1000, RRID:AB_2313606)
Curator: @scibot
SciCrunch record: RRID:AB_2313606
RRID:AB_1107737
DOI: 10.1016/j.ebiom.2026.106137
Resource: (Bio X Cell Cat# BE0036, RRID:AB_1107737)
Curator: @scibot
SciCrunch record: RRID:AB_1107737
RRID:AB_3075534
DOI: 10.1016/j.cmet.2025.12.017
Resource: (Abcam Cat# ab230482, RRID:AB_3075534)
Curator: @scibot
SciCrunch record: RRID:AB_3075534
RRID:AB_2876689
DOI: 10.1016/j.chom.2026.01.008
Resource: (BioLegend Cat# 366903, RRID:AB_2876689)
Curator: @scibot
SciCrunch record: RRID:AB_2876689
RRID:CVCL_H716
DOI: 10.1016/j.celrep.2026.116937
Resource: (ATCC Cat# SD-3443, RRID:CVCL_H716)
Curator: @scibot
SciCrunch record: RRID:CVCL_H716
RRID:AB_2739426
DOI: 10.1016/j.celrep.2026.116937
Resource: None
Curator: @scibot
SciCrunch record: RRID:AB_2739426
Reviewer #1 (Public review):
Summary:
Morgan et al. studied how paternal dietary alteration influenced testicular phenotype, placental and fetal growth using a mouse model of paternal low protein diet (LPD) or Western Diet (WD) feeding, with or without supplementation of methyl-donors and carriers (MD). They found diet- and sex-specific effects of paternal diet alteration. All experimental diets decreased paternal body weight and the number of spermatogonial stem cells, while fertility was unaffected. WD males (irrespective of MD) showed signs of adiposity and metabolic dysfunction, abnormal seminiferous tubules, and dysregulation of testicular genes related to chromatin homeostasis. Conversely, LPD induced abnormalities in the early placental cone, fetal growth restriction, and placental insufficiency, which were partly ameliorated by MD. The paternal diets changed the placental transcriptome in a sex-specific manner and led to a loss of sexual dimorphism in the placental transcriptome. These data provide a novel insight into how paternal health can affect the outcome of pregnancies, which is often overlooked in prenatal care.
Strengths:
The authors have performed a well-designed study using commonly used mouse models of paternal underfeeding (low protein) and overfeeding (Western diet). They performed comprehensive phenotyping at multiple timepoints, including the fathers, the early placenta, and the late gestation feto-placental unit. The inclusion of both testicular and placental morphological and transcriptomic analysis is a powerful, non-biased tool for such exploratory observational studies. The authors describe changes in testicular gene expression revolving around histone (methylation) pathways that are linked to altered offspring development (H3.3 and H3K4), which is in line with hypothesised paternal contributions to offspring health. The authors report sex differences in control placentas that mimic those in humans, providing potential for translatability of the findings. The exploration of sexual dimorphism (often overlooked) and its absence in response to dietary modification is novel and contributes to the evidence-base for the inclusion of both sexes in developmental studies.
Weaknesses:
The data are overall consistent with the conclusions of the authors. The paternal and pregnancy data are discussed separately, instead of linking the paternal phenotype to offspring outcomes. Some clarifications regarding the methods and the model would improve the interpretation of the findings.
(1) The authors insufficiently discuss their rationale for studying methyl-donors and carriers as micronutrient supplementation in their mouse model. The impact of the findings would be better disseminated if their role were explained in more detail.
(2) It is unclear from the methods exactly how long the male mice were kept on their respective diets at the time of mating and culling. Male mice were kept on the diet between 8 and 24 weeks before mating, which is a large window in which the males undergo a considerable change in body weight (Figure 1A). If males were mated at 8 weeks but phenotyped at 24 weeks, or if there were differences between groups, this complicates the interpretation of the findings and the extrapolation of the paternal phenotype to changes seen in the fetoplacental unit. The same applies to paternal age, which is an important known factor affecting male fertility and offspring outcomes.
(3) The male mice exhibited lower body weights when fed experimental diets compared to the control diet, even when placed on the hypercaloric Western Diet. As paternal body weight is an important contributor to offspring health, this is an important confounder that needs to be addressed. This may also have translational implications; in humans, consumption of a Western-style diet is often associated with weight gain. The cause of the weight discrepancy is also unaddressed. It is mentioned that the isocaloric LPD was fed ad libitum, while it is unclear whether the WD was also fed ad libitum, or whether males under- or over-ate on each experimental diet.
(4) The description and presentation of certain statistical analyses could be improved.
(i) It is unclear what statistical analysis has been performed on the time-course data in Figure 1A (if any). If one-way ANOVA was performed at each timepoint (as the methods and legend suggest), this is an inaccurate method to analyse time-course data.
(ii) It is unclear what methods were used to test the relative abundance of microbiome species at the family level (Figure 2L), whether correction was applied for multiple testing, and what the stars represent in the figure. 3) Mentioning whether siblings were used in any analyses would improve transparency, and if so, whether statistical correction needed to be applied to control for confounding by the father.
Author response:
Public Reviews:
Reviewer #1 (Public review):
Summary:
Morgan et al. studied how paternal dietary alteration influenced testicular phenotype, placental and fetal growth using a mouse model of paternal low protein diet (LPD) or Western Diet (WD) feeding, with or without supplementation of methyl-donors and carriers (MD). They found diet- and sex-specific effects of paternal diet alteration. All experimental diets decreased paternal body weight and the number of spermatogonial stem cells, while fertility was unaffected. WD males (irrespective of MD) showed signs of adiposity and metabolic dysfunction, abnormal seminiferous tubules, and dysregulation of testicular genes related to chromatin homeostasis. Conversely, LPD induced abnormalities in the early placental cone, fetal growth restriction, and placental insufficiency, which were partly ameliorated by MD. The paternal diets changed the placental transcriptome in a sex-specific manner and led to a loss of sexual dimorphism in the placental transcriptome. These data provide a novel insight into how paternal health can affect the outcome of pregnancies, which is often overlooked in prenatal care.
Strengths:
The authors have performed a well-designed study using commonly used mouse models of paternal underfeeding (low protein) and overfeeding (Western diet). They performed comprehensive phenotyping at multiple timepoints, including the fathers, the early placenta, and the late gestation feto-placental unit. The inclusion of both testicular and placental morphological and transcriptomic analysis is a powerful, non-biased tool for such exploratory observational studies. The authors describe changes in testicular gene expression revolving around histone (methylation) pathways that are linked to altered offspring development (H3.3 and H3K4), which is in line with hypothesised paternal contributions to offspring health. The authors report sex differences in control placentas that mimic those in humans, providing potential for translatability of the findings. The exploration of sexual dimorphism (often overlooked) and its absence in response to dietary modification is novel and contributes to the evidence-base for the inclusion of both sexes in developmental studies.
Weaknesses:
The data are overall consistent with the conclusions of the authors. The paternal and pregnancy data are discussed separately, instead of linking the paternal phenotype to offspring outcomes. Some clarifications regarding the methods and the model would improve the interpretation of the findings.
(1) The authors insufficiently discuss their rationale for studying methyl-donors and carriers as micronutrient supplementation in their mouse model. The impact of the findings would be better disseminated if their role were explained in more detail.
We acknowledge the Reviewer’s comments regarding the amount of detail in support of the inclusion of methyl carriers and donors within our diet. Therefore, we will revise the manuscript to include more justification, especially within the Introduction section, for their inclusion.
(2) It is unclear from the methods exactly how long the male mice were kept on their respective diets at the time of mating and culling. Male mice were kept on the diet between 8 and 24 weeks before mating, which is a large window in which the males undergo a considerable change in body weight (Figure 1A). If males were mated at 8 weeks but phenotyped at 24 weeks, or if there were differences between groups, this complicates the interpretation of the findings and the extrapolation of the paternal phenotype to changes seen in the fetoplacental unit. The same applies to paternal age, which is an important known factor affecting male fertility and offspring outcomes.
We thank the Reviewer for their comments regarding the ages of the males analysed. We will provide more detailed descriptions of the males in our manuscript. However, all male ages were balanced across all groups.
(3) The male mice exhibited lower body weights when fed experimental diets compared to the control diet, even when placed on the hypercaloric Western Diet. As paternal body weight is an important contributor to offspring health, this is an important confounder that needs to be addressed. This may also have translational implications; in humans, consumption of a Western-style diet is often associated with weight gain. The cause of the weight discrepancy is also unaddressed. It is mentioned that the isocaloric LPD was fed ad libitum, while it is unclear whether the WD was also fed ad libitum, or whether males under- or over-ate on each experimental diet.
We agree with the Reviewer that the general trend towards a lighter body weight for our experimental animals is unexpected. We can confirm that all diets were fed ad libitum. However, as males were group housed, we were unable to measure food consumption for individual males. We also observed that for males fed the high fat diets, they often shredded significant quantities of their diet, rather than eating it, so preventing accurate measurement of food intake.
We also agree with the Reviewer that body weight can be a significant confounder for many paternal and offspring parameters. However, while the experimental males did become lighter, there were no statistical differences between groups in mean body weight. As such, body weight was not included as a variable within our statistical analysis.
(4) The description and presentation of certain statistical analyses could be improved.
(i) It is unclear what statistical analysis has been performed on the time-course data in Figure 1A (if any). If one-way ANOVA was performed at each timepoint (as the methods and legend suggest), this is an inaccurate method to analyse time-course data.
(ii) It is unclear what methods were used to test the relative abundance of microbiome species at the family level (Figure 2L), whether correction was applied for multiple testing, and what the stars represent in the figure. 3) Mentioning whether siblings were used in any analyses would improve transparency, and if so, whether statistical correction needed to be applied to control for confounding by the father.
We apologize for the lack of clarity regarding the statistical analyses. Going forward, we will revise the manuscript and include a more detailed description of the different analyses, the inclusion of siblings, and the correction for multiple testing.
Reviewer #2 (Public review):
Summary:
The authors investigated the effects of a low-protein diet (LPD) and a high sugar- and fat-rich diet (Western diet, WD) on paternal metabolic and reproductive parameters and fetoplacental development and gene expression. They did not observe significant effects on fertility; however, they reported gut microbiota dysbiosis, alterations in testicular morphology, and severe detrimental effects on spermatogenesis. In addition, they examined whether the adverse effects of these diets could be prevented by supplementation with methyl donors. Although LPD and WD showed limited negative effects on paternal reproductive health (with no impairment of reproductive success), the consequences on fetal and placental development were evident and, as reported in many previous studies, were sex-dependent.
Strengths:
This study is of high quality and addresses a research question of great global relevance, particularly in light of the growing concern regarding the exponential increase in metabolic disorders, such as obesity and diabetes, worldwide. The work highlights the importance of a balanced paternal diet in regulating the expression of metabolic genes in the offspring at both fetal and placental levels. The identification of genes involved in metabolic pathways that may influence offspring health after birth is highly valuable, strengthening the manuscript and emphasizing the need to further investigate long-term outcomes in adult offspring.
The histological analyses performed on paternal testes clearly demonstrate diet-induced damage. Moreover, although placental morphometric analyses and detailed histological assessments of the different placental zones did not reveal significant differences between groups, their inclusion is important. These results indicate that even in the absence of overt placental phenotypic changes, placental function may still be altered, with potential consequences for fetal programming.
Weaknesses:
Overall, this manuscript presents a rich and comprehensive dataset; however, this has resulted in the analysis of paternal gut dysbiosis remaining largely descriptive. While still valuable, this raises questions regarding why supplementation with methyl donors was unable to restore gut microbial balance in animals receiving the modified diets.
We thank the Reviewer for their considered thoughts on the gut dysbiosis induced in our models the minimal impact of the methyl donors and carriers. We will include additional text within the Discussion to acknowledge this. However, at this point in time, we are unsure as to why the methyl donors had minimal impact. It could be that the macronutrients (i.e. protein, fat, carbohydrates) have more of an influence on gut bacterial profiles than micronutrients. Alternatively, due to the prolonged nature of our feeding regimens, any initial influences of the methyl donors may become diluted out over time. We will amend the text to reflect these potential factors.
Yet Kierkegaard's attempt to save faithfrom the onslaught of modernity made even religion modern,that is, subject to doubt and distrust. Traditional beliefs disinte-grated into absurdity when Kierkegaard tried to reassert themon the assumption that man cannot trust the truth-receiving ca-pacity of his reason or of his senses.
It is interesting that through Kierkegaard's attempt to defend religion in a modern context, he goes against the tradition of relgion and opens the door for modern religious scrutiny.
Amusante déconstruction de l'Amérique, alliée, futuriste, démocrate, exactement celle que fond tous les complotistes communistes depuis toujours.
Quant à la domination culturelle à organiser, aujourd'hui réduite au succès planétaire de l'exemple même du kitch ringard qu'est l'Eurovision, universellement méprisée, elle fait un peu rire quand on pense au catalogue existant, dont il n'est pas fait mention dans l'article.
Reviewer #1 (Public review):
Meiotic recombination at chromosome ends can be deleterious, and its initiation-the programmed formation of DSBs-has long been known to be suppressed. However, the underlying mechanisms of this suppression remained unclear. A bottleneck has been the repetitive sequences embedded within chromosome ends, which make them challenging to analyze using genomic approaches. The authors addressed this issue by developing a new computational pipeline that reliably maps ChIP-seq reads and other genomic data, enabling exploration of previously inaccessible yet biologically important regions of the genome.
In budding yeast, chromosome ends (~20 kb) show depletion of axis proteins (Red1 and Hop1) important for recruiting DSB-forming proteins. Using their newly developed pipeline, the authors reanalyzed previously published datasets and data generated in this study, revealing heretofore unseen details at chromosome ends. While axis proteins are depleted at chromosome ends, the meiotic cohesin component Rec8 is not. Y' elements play a crucial role in this suppression. The suppression does not depend on the physical chromosome ends but on cis-acting elements. Dot1 suppresses Red1 recruitment at chromosome ends but promotes it in interior regions. Sir complex renders subtelomeric chromatin inaccessible to the DSB-forming machinery.
The high-quality data and extensive analyses provide important insights into the mechanisms that suppress meiotic DSB formation at chromosome ends. To fully realise this value, several aspects of data presentation and interpretation should be clarified to ensure that the conclusions are stated with appropriate precision and that remaining future issues are clearly articulated.
(1) To assess the chromosome fusion effects on overall subtelomeric suppression, authors should guide how to look at the data presented in Figure 2b-c. Based on the authors' definition of the terminal 20 kb as the suppressed region, SK1 chrIV-R and S288c chrI-L would be affected by the chromosome fusion, if any. In addition, I find it somewhat challenging to draw clear conclusions from inspecting profiles to compare subtelomeric and internal regions. Perhaps, applying a quantitative approach - such as a bootstrap-based analysis similar to those presented earlier-would be easier to interpret.
(2) The relationship between coding density and Red1 signal needs clarification. An important conclusion from Figure 3 is that the subtelomeric depletion of Red1 primarily reflects suppression of the Rec8-dependent recruitment pathway, whereas Rec8-independent recruitment appears similar between ends and internal regions. Based on the authors' previous papers (referencess 13, 16), I thought coding (or nucleosome) density primarily influences the Rec8-independent pathway. However, the correlations presented in Figure 2d-e (also implied in Figure 3a) appear opposite to my expectation. Specifically, differences in axis protein binding between chromosome ends and internal regions (or within chromosome ends), where the Rec8-dependent pathway dominates, correlate with coding density. In contrast, no such correlation is evident in rec8Δ cells, where only the Rec8-independent pathway is active and end-specific depletion is absent. One possibility is that masking coding regions within Y' elements influences the correlation analysis. Additional analysis and a clearer explanation would be highly appreciated.
(3) The Dot1-Sir3 section staring from L266 should be clarified. I found this section particularly difficult to follow. It begins by stating that dot1∆ leads to Sir complex spreading, but then moves directly to an analysis of Red1 ChIP in sir3∆ without clearly articulating the underlying hypothesis. I wonder if this analysis is intended to explain the differences observed between dot1∆ and H3K79R mutants in the previous section. I also did not get the concluding statement - Dot1 counteracts Sir3 activity. As sir3Δ alone does not affect subtelomeric suppression, it is unclear what Dot1 counteracts. Perhaps, explicitly stating the authors' working model at the outset of this section would greatly clarify the rationale, results, and conclusions.
Intellectual adjustment. Experiencing an intellectual “a-ha!” moment is one of the most rewarding parts of college, right up there with moving across the graduation stage with a degree in hand. Prepare to be surprised when you stumble across a fascinating subject or find that a class discussion changes your life. At the very least, through your academic work, you will learn to think differently about the world around you and your place in it.
This is one of my favorite parts of learning, having that "a-ha!" moment. Having a positive life & mind-changing experience and being able to share that with others is a blessing.
Unlike TCP speed, which can be set via the maxTcpSpeed parameter in safety.conf files
ça donne l'impression qu'on peut éditer ces fichiers. Mais ils sont protégé par un checksum et il faut modifier les Safety settings dans le UI.
ia EIP-214)
EIP - 214, brought about static calls, static call allows call the blockchain without a change of state aka ( read only mode)
få ösa ur sig alltsammans
pout it all out
på benen
on the legs
Pillar 2: The Hidden Job Market
Right now I focus this topic around job seekers of all levels, not just leaders. Probably specialize this to just leaders looking to land their next role, ya?
Optimiser la Mémorisation et l'Apprentissage en Milieu Scolaire : Stratégies et Leviers Neurocognitifs
Ce document synthétise les stratégies pédagogiques visant à contrer le phénomène de l'oubli chez les élèves et à renforcer l'ancrage des connaissances sur le long terme.
Le constat de départ souligne que l'oubli n'est pas une défaillance de l'élève, mais un processus biologique naturel illustré par la "courbe de l'oubli" d'Ebbinghaus.
L'enjeu majeur réside dans la lutte contre l'illusion du savoir — cette fausse impression de maîtrise issue d'une relecture passive du cours.
Les points clés pour transformer les pratiques d'apprentissage sont :
• La Métacognition : Enseigner explicitement aux élèves le fonctionnement de leur cerveau pour les rendre acteurs de leurs progrès.
• L'Enseignement Explicite : Baliser clairement les notions essentielles pour éviter la confusion entre la trace écrite et les exemples.
• L'Apprentissage Actif : Privilégier la fragmentation des informations et la réactivation régulière via des rituels (boîte à questions, mots de passe).
• La Récupération en Classe : Intégrer des temps de révision et d'analyse réflexive après les évaluations pour consolider les acquis.
--------------------------------------------------------------------------------
L'oubli est la réaction normale du cerveau en l'absence de réactivation régulière des connaissances.
Selon les sources, il ne s'agit pas d'un manque de travail ou de talent, mais d'une caractéristique neurologique. L'apprentissage est décrit comme un acte physique demandant de l'investissement, des efforts et générant des émotions (joie de comprendre ou frustration de l'échec).
De nombreux élèves confondent « relire » et « apprendre ». Des techniques passives, telles que la relecture multiple (jusqu'à 5 ou 7 fois) ou le surlignage de mots en couleurs, créent une illusion de maîtrise sans garantir la mémorisation à long terme. Cette approche est jugée inefficace par rapport aux méthodes de récupération active.
--------------------------------------------------------------------------------
Pour que les élèves réussissent, il est impératif de leur apprendre comment apprendre.
• Cours de méthodologie : La mise en place d'une heure hebdomadaire (ou des séances intégrées à la vie de classe) permet d'aborder des questions fondamentales : Pourquoi j'oublie ? Comment fonctionne ma mémoire ? Quelles stratégies adopter ?
• La Pensée Positive : Développer l'idée que le progrès est accessible à tous, quel que soit le niveau initial, renforce l'état d'esprit nécessaire à l'apprentissage.
--------------------------------------------------------------------------------
Le contenu d'un cahier peut être confus pour un élève (mélange d'exercices, d'exemples et de leçons). Les enseignants doivent :
• Identifier clairement ce qui doit être retenu (encadrés, soulignage en rouge).
• Prendre 5 minutes en fin d'heure pour résumer l'essentiel de la séance.
Le cerveau traite mieux les informations courtes et structurées :
• Règle de concision : Formuler les points importants en phrases d'environ une douzaine de mots maximum.
• Alternance attentionnelle : Découper le cours en séquences (explications courtes, activités, retours au calme) pour maintenir la concentration.
• Apprentissage actif : Un élève actif retient mieux qu'un élève passif. Les mini-tâches, l'échange et la coopération sont à privilégier.
--------------------------------------------------------------------------------
La répétition est la clé de l'ancrage mémoriel. Plusieurs rituels simples peuvent être instaurés :
| Rituel | Description | Objectif | | --- | --- | --- | | La boîte à questions | Un élève responsable crée des cartes flash sur le cours. En début d'heure, il interroge ses camarades en piochant 4 ou 5 questions. | Autonomie et révision continue des notions de l'année. | | Le mot de passe | Pour entrer en classe, l'élève doit donner la définition d'un mot complexe vu la veille. | Réactivation immédiate et interaction ludique. | | QCM Numériques | Utilisation d'outils (ex: Quiz Wizard) pour générer des tests rapides sur Pronote. | Entraînement régulier sans surcharge de correction pour le professeur. |
--------------------------------------------------------------------------------
Les révisions ne doivent pas être cantonnées au domicile ; elles doivent s'intégrer au temps scolaire.
• Technique de la feuille blanche : À la fin d'un chapitre, les élèves notent de mémoire tout ce qu'ils ont retenu sur une feuille vierge pour identifier leurs lacunes.
• Méthode Feynman : Apprendre en enseignant aux autres. Les élèves s'expliquent mutuellement des notions avec des mots simples.
• Ateliers de révision : Rotation toutes les 15 minutes sur différents supports (cartes de géographie effaçables, création de flashcards, jeux pédagogiques comme le Timeline ou les dominos).
--------------------------------------------------------------------------------
Le processus d'apprentissage ne s'arrête pas à la note. Pour progresser, l'élève doit analyser ses erreurs :
• Écrits réflexifs : Après une évaluation importante (ex: brevet blanc), les élèves remplissent une fiche d'analyse sur leur préparation, le temps passé et les méthodes utilisées.
• Auto-conseil : L'élève définit lui-même ses axes d'amélioration pour la prochaine évaluation.
En conclusion, la réussite des élèves repose sur la compréhension du fonctionnement cérébral, la structuration explicite des savoirs, la réactivation constante et l'entraînement actif.
CAT-UC-03-06CAT-CAP-06Publicar Cambios del CatálogoSistemaNotificar a otros dominios del ecosistema sobre cambios relevantes en el catálogo técnico, como la publicación o retiro de Service Profiles.
EN CU 01
État des lieux de l'enseignement privé en France : Enjeux de mixité, de performance et de financement
L'enseignement privé en France traverse une période de mutations structurelles et de débats politiques intenses.
Bien que la part des élèves scolarisés dans le privé sous contrat demeure globalement stable à l'échelle nationale (environ 17 à 18 %), l'attractivité de ce secteur s'intensifie, particulièrement dans les grandes métropoles comme Paris.
Cette dynamique est alimentée par une recherche d'excellence académique, une offre pédagogique spécifique (bilinguisme, encadrement) et une déception croissante vis-à-vis du système public, marqué par des problématiques de non-remplacement des enseignants.
Toutefois, cette attractivité s'accompagne d'une homogénéisation sociale accrue au sein des établissements privés, comme le révèle la publication récente de l'Indice de Position Sociale (IPS).
Le débat public se cristallise désormais sur la question de la mixité sociale, le financement public (qui assure environ 75 % du budget du privé sous contrat) et la nécessité de renforcer les contrôles étatiques sur ces établissements, tout en préservant leur « caractère propre » garanti par la loi.
--------------------------------------------------------------------------------
Le paysage de l'enseignement privé se divise principalement en deux catégories, régies par des cadres légaux et des niveaux d'implication de l'État distincts.
• Privé sous contrat d'association : Il représente l'immense majorité du secteur (environ 17 % des élèves).
Ces établissements participent au service public d'éducation, suivent les programmes nationaux et voient leurs enseignants rémunérés par l'État.
• Privé hors contrat : Bien que minoritaire (un peu plus de 2 % des élèves aujourd'hui contre 1 % en 2015), ce secteur connaît une croissance notable.
Il concerne environ 1 800 établissements sur les 57 000 que compte la France.
La situation de l'enseignement privé varie considérablement selon les zones :
• Paris et grandes métropoles : Une forte pression démographique inversée.
Alors que le public perd des classes, le privé affiche des listes d'attente importantes.
Au collège Sévigné (Paris 5e), on compte 1 000 demandes pour seulement 150 places.
• Zones rurales et Bretagne : Dans certains territoires (Bretagne, Pays Basque), l'école privée est parfois la seule disponible dans la commune, accueillant ainsi tous les enfants du village et maintenant une mixité sociale de fait.
--------------------------------------------------------------------------------
Le choix du privé par les familles repose sur une combinaison de facteurs pédagogiques, institutionnels et sociaux.
Selon un sondage IPSOS de septembre 2023, les motivations principales sont :
• Recherche d'excellence : 23 %
• Enseignement religieux et tradition : 20 %
• Continuité familiale : 20 %
• Déception vis-à-vis du public : 10 %
Les établissements de prestige, tels que le collège Sévigné, affichent des résultats exceptionnels (97 % de mentions « Très Bien » au brevet), s'appuyant sur une sélection sur dossier et une atmosphère d'exigence.
Le non-remplacement des enseignants est un levier majeur de transfert vers le privé.
En 2023, le Sénat rapporte une moyenne de 12 jours d'absence non remplacés dans le public contre 10 dans le privé.
« Un élève qui fait l'ensemble de sa scolarité dans le public dans le 93 aura perdu un an de scolarité au total. »
Cette baisse d'attractivité du métier d'enseignant dans le public, illustrée par des concours dont le nombre de candidats est inférieur au nombre de postes (notamment dans les académies de Créteil et Versailles), pousse les parents vers le privé pour garantir la continuité des cours.
--------------------------------------------------------------------------------
La publication de l'IPS en 2022, sous la contrainte d'une décision de justice, a mis en lumière une fracture sociale croissante.
L'IPS mesure les conditions socio-culturelles des familles (allant de 45 à 185).
Plus il est élevé, plus le milieu est favorisé.
| Niveau scolaire | IPS Moyen - Public | IPS Moyen - Privé sous contrat | | --- | --- | --- | | École primaire | 105,8 | 121,5 | | Collège | 100,9 | 125,0 | | Lycée | 105,0 | 125,0 |
On observe une hausse significative de la part des élèves très favorisés dans le privé : ils représentaient 30 % des effectifs en 2003, contre 42 % aujourd'hui.
Cette ségrégation sociale est particulièrement marquée en milieu urbain, où des collèges publics défavorisés et des collèges privés favorisés coexistent à moins de 15 minutes de marche l'un de l'autre.
--------------------------------------------------------------------------------
Le système repose sur un équilibre historique souvent qualifié de « paix scolaire », mais aujourd'hui remis en question.
La loi Debré a instauré le système de contrat entre l'État et le privé.
En 1984, le projet de loi Savary, visant à créer un grand service public unifié, avait provoqué des manifestations massives (plus d'un million de personnes) pour la défense de « l'école libre », entraînant le retrait du texte.
L'État et les collectivités territoriales financent environ 75 % du budget des écoles privées sous contrat (soit un montant estimé entre 10 et 13 milliards d'euros).
Pourtant, un élève du privé coûte globalement moins cher à l'État qu'un élève du public (un écart total d'environ 1,5 milliard d'euros), car certaines charges et structures diffèrent.
Historiquement faibles (seulement 5 établissements contrôlés en 2023 sur 7 500), les contrôles s'intensifient sous l'impulsion des récents rapports de la Cour des comptes et de scandales médiatisés (affaire Stanislas, Notre-Dame de Bétharram).
• Objectif : 40 % des établissements contrôlés d'ici 2027.
• Nature des contrôles : Utilisation des fonds publics, respect des programmes, vie scolaire et respect du « caractère propre ».
--------------------------------------------------------------------------------
Le débat actuel se concentre sur la possibilité de conditionner le financement public à des objectifs de mixité sociale.
• Positions législatives : Des propositions de loi (notamment portées par les groupes socialistes et communistes au Sénat) ont visé à moduler les subventions en fonction de l'IPS des établissements.
Ces textes ont été rejetés par la majorité sénatoriale de droite, qui privilégie la liberté de choix des parents et la spécificité du projet pédagogique privé.
• Le concept de « caractère propre » : Bien que non défini précisément par la loi, il garantit la liberté religieuse ou pédagogique (langues régionales, méthodes spécifiques) de l'établissement.
Pour certains, c'est l'essence même du pluralisme ; pour d'autres, c'est un outil permettant l'évitement scolaire et la sélection des élèves.
• Recrutement et sélection : Contrairement au public, les directeurs du privé peuvent recruter leurs enseignants et sélectionner leurs élèves sur dossier, ce qui pose la question de l'égalité des armes entre les deux systèmes.
En conclusion, si l'enseignement privé assure une mission de service public, son autonomie de gestion et sa capacité de sélection, couplées à un financement public massif, restent au cœur d'une tension politique majeure entre liberté d'enseignement et exigence d'égalité républicaine.
Casos de Uso Código UCCapacidadCaso de UsoActorDescripciónFaseCAT-UC-01-01CAT-CAP-01Definir Capability TécnicaAdmin MVNARegistrar una capability técnica global en el diccionario maestro del catálogo para ser utilizada en la construcción de Service Profiles.MVP Flujos Administrativos Normalizados FAN-CAT-01 — Registrar Capability Técnica Usado por: CAT-UC-01-01 Precondiciones El code de la capability no debe existir previamente en la CapabilityLibrary (Unicidad). Pasos canónicos Se ingresa ingresa el código normalizado, descripción y categoría. El sistema debe canonizar el code (trim, uppercase) para evitar duplicados por formato. El sistema valida que la categoría pertenezca al Enum definido: NETWORK, FEATURE o RESTRICTION. Se registra la entidad Capability en estado active: true por defecto. El sistema emite el evento de dominio CapabilityDefined. Resultado Capability disponible en la CapabilityLibrary para ser referenciada en cualquier ProfileSpec. FAN-CAT-02 — Modificar Capability Técnica Precondiciones La Capability existe en la CapabilityLibrary. Pasos Canónicos El sistema bloquea la edición del campo code. El código es inmutable una vez creado para no romper las referencias en los ProfileSpec. Se modifica la description o la category. Se guardan los cambios. Esta acción no afecta a los Service Profiles activos, ya que estos referencian al code, que no ha cambiado. El sistema emite el evento de dominio CapabilityUpdated. FAN-CAT-03 — Desactivar Capability Técnica Precondiciones La Capability existe y está en estado active: true. Pasos Canónicos El sistema marca la Capability como active: false. A partir de este momento, la capacidad deja de ser visible/seleccionable en el flujo de CAT-UC-06 "Configurar Definición Técnica de una Versión". El sistema no elimina la capacidad de la base de datos ni de las versiones de Service Profile (activas o inactivas) que ya la contienen. Esto garantiza que el histórico y la provisión técnica sigan funcionando para las SIMs activas. El sistema emite el evento de dominio CapabilityDeactivated.
SACAR TODA LA CAPACIDAD, Ya que esto las capabilitys deberan estar precargadas en una entidad, con los atributos que necesite serviceprofile-
Crear y mantener la identidad lógica de un Service Profile que agrupa versiones técnicas.
mejorar explicacion
d’un suivi post-publication comme évoqué par Margot Melle
Je suggère d'expliquer un peu plus parce que juste comme ça, on ne comprend pas de quoi il s'agit.
Les revues ne sont plus sollicitées
Je ne comprends pas cette partie de la phrase
La date de diffusion est aussi un enjeu : idéalement, il faudrait éviter de le faire avant une période de congés.
Je pense que ceci est une autre idée, autour de la temporalité, peut-être développer dans son propre petit paragraphe?
Selon elles, c’est unanime, cela ne devrait pas faire partie de leur charge mentale. Elles ne se considèrent pas comme community manager et ne pensent pas avoir les compétences appropriées.
Est-ce vraiment comme ça que ça a été formulé? J'irais plus dans le détails, plus collé sur ce qui a été dit, pour éviter le risque de tordre certains propos.
En effet, ce qui ressort particulièrement des échanges est que le statut de lecteur·ice se brouille sensiblement, pour les revues universitaires, avec celui d’auteur·ice
Je pense que ceci mériterait sa propre sous-section, et d'être un peu plus développé peut-être (par exemple en reprenant les différentes façons dont ça a été formulé par les revues).
On note au passage que ces propos laissent paraître plusieurs présupposés qui mériteraient d’être déconstruits
Effectivement, mais à la lumière de mon commentaire précédent, ça me semble être un argument de type "homme de paille" : il me semble qu'il y a eu juste une personne qui a évoqué cette thématique des "jeunes" (Andrea avec sa stagiaire que s'occupe des réseaux sociaux). Ou vous le voyez ailleurs aussi? Peut-être que c'est moi qui rate quelque chose?
elles évoquent le besoin d’avoir des personnes qui savent faire de la production de contenu sur les réseaux sociaux, des jeunes qui maîtrisent les codes et seraient en mesure de prendre le relais de l’équipe d’édition, souvent épuisée à la sortie d’un numéro.
Même commentaire que le précédent, l'affirmation ici a une portée très générale et je ne pense pas que cet enjeu de pouvoir compter sur des "jeunes" a émergé de manière si importante, pour toustes (ce que la formulation suggère). Je pense que ce serait mieux d'en parler en termes spécifiques. Par exemple : Une revue [en la nommant ou pas] évoque avoir pu compter sur la contribution d'une stagiaire qui a pris en charge la communication sur les réseaux sociaux, et souhaiterait reproduire cette expérience [formulation exacte à revoir, mais vous voyez l'idée].
Quel que soit le mode principal de présence sur le Web, il semble bien que les revues soient noyées dans le Big Data: du fait d’une surcharge informationnelle propre au medium, le mode de représentation et de consultation sur internet favorise le contenu court, l’échange rapide… autant d’éléments qui vont à l’encontre des principes de diffusion et de consultation d’une revue savante plus traditionnelle. En effet, la revue, qu’elle publie au fil de l’eau ou à intervalle fixe, s’inscrit dans un temps long. Surtout, la revue possède une cohérence, voire elle fait une cohérence de par les choix éditoriaux et scientifiques qu’elle incarne. Cette cohérence se met aussi en contrepoint de la tendance à la fragmentation : les moteurs de recherche (et surtout l’hégémonique Google Scholar) reflètent la vision de la science mesurée par le nombre de publications uniques, où le nombre absolu d’articles devient l’indicateur de carrière premier en dépit des pratiques bien connues de saucissonnage et de recyclage des connaissances
Ici je trouve qu'on s'éloigne de ce qui a été dit durant l'entretien. De plus, le propos me semble manquer de direction : le paragraphe parle à la fois de Big Data, de cohérence/fragmentation, de l'hégémonie de Google Scholar, de la vision productiviste de la science, des revues qui publient au fil de l'eau ou à intervalle fixe [pourquoi le préciser ici?]. Tous ces éléments participent au même univers, mais l'argument n'est pas limpide. Je suggèrerais de supprimer, ou de mieux identifier et mettre en valeur le propos central.
Quand nous interrogeons les éditeurices des revues sur leurs pratiques de diffusion, ce terme de diffusion est entendu comme présence sur les réseaux sociaux
Vraiment? Je viens de reparcourir la transcription, et il ne me semble pas que les réseaux sociaux émergent comme compréhension restreinte des enjeux de diffusion. Je suggère de reformuler plus modestement, ou plus spécifiquement.
de donner quelques réflexions plus personnelles
Pourquoi pas, mais dans le texte tel qu'il est actuellement il me semble que le côté "réflexions personnelles" prend un peu l'ascendant sur le compte-rendu de la discussion. Je suggèrerais de revoir l'équilibre, ou de mieux identifier ce qui est du commentaire/réflexion, et ce qui provient de ce que les personnes représentant les revues ont dit (sinon, le risque serait que les revues lisent tout ceci et aient l'impression que le billet ne représente pas bien ce qui a été dit?)
le site Cornemuses d’Europe et de Méditerranée
La typographie des titres d'oeuvres, de documents et de publication a été uniformisée en italique.
Toutes les citations sont faites à partir de la transcription de la journée d’étude
Il serait alors préférable d'inclure les informations de cette transcription en bibliographie afin de la sémantiser dans le texte, plutôt que d'avoir recours au « ibid ».
WARC (Web ARChive)
Ici, j'ai ajouté la précision comme c'est la première occurence, et je l'ai supprimée sur les suivantes comme elle n'était pas systématiquement énoncée après « WARC ».
Les actes de la conférence ont été publiés. Voir Gebeil et Peyssard (2024).↩︎
Pourquoi cette précision en note de bas de page au sujet des actes, alors qu'il sont cités plus haut ?
Reviewer #2 (Public review):
Summary:
Stanojcic et al. investigate the origins of DNA replication in the unicellular parasite Trypanosoma brucei. They perform two experiments, stranded SNS-seq and DNA molecular combing. Further, they integrate various publicly available datasets, such as G4-seq and DRIP-seq, into their extensive analysis. Using this data, they elucidate the structure of the origins of replication. In particular, they find various properties located at or around origins, such as polynucleotide stretches, G-quadruplex structures, regions of low and high nucleosome occupancy, R-loops, and that origins are mostly present in intergenic regions. Combining their population-level SNS-seq and their single-molecule DNA molecular combing data, they elucidate the total number of origins as well as the number of origins active in a single cell.
Strengths:
(1) A very strong part of this manuscript is that the authors integrate several other datasets and investigate a large number of properties around origins of replication. Data analysis clearly shows the enrichment of various properties at the origins, and the manuscript concludes with a very well-presented model that clearly explains the authors' understanding and interpretation of the data.
(2) The DNA combing experiment is an excellent orthogonal approach to the SNS-seq data. The authors used the different properties of the two experiments (one giving location information, one giving single-molecule information) well to extract information and contrast the experiments.
(3) The discussion is exemplary, as the authors openly discuss the strengths and weaknesses of the approaches used. Further, the discussion serves its purpose of putting the results in both an evolutionary and a trypanosome-focused context.
Weaknesses:
I have major concerns about the origin of replication sites determined from the SNS-seq data. As a caveat, I want to state that, before reading this manuscript, SNS-seq was unknown to me; hence, some of my concerns might be misplaced.
(1) I do not understand why SNS-seq would create peaks. Replication should originate in one locus, then move outward in both directions until the replication fork moving outward from another origin is encountered. Hence, in an asynchronous population average measurement, I would expect SNS data to be broad regions of + and -, which, taken together, cover the whole genome. Why are there so many regions not covered at all by reads, and why are there such narrow peaks?
(2) I am concerned that up to 96% percent of all peaks are filtered away. If there is so much noise in the data, how can one be sure that the peaks that remain are real? Specifically, if the authors placed the same number of peaks as was measured randomly in intergenic regions, would 4% of these peaks pass the filtering process by chance?
(3) There are 3 previous studies that map origins of replication in T. brucei. Devlin et al. 2016, Tiengwe et al. 2012, and Krasiļņikova et al. 2025 (https://doi.org/10.1038/s41467-025-56087-3), all with a different technique: MFA-seq. All three previous studies mostly agree on the locations and number of origins. The authors compared their results to the first two, but not the last study; they found that their results are vastly different from the previous studies (see Supplementary Figure 8A). In their discussion, the authors defend this discrepancy mostly by stating that the discrepancy between these methods has been observed in other organisms. I believe that, given the situation that the other studies precede this manuscript, it is the authors' duty to investigate the differences more than by merely pointing to other organisms. A conclusion should be reached on why the results are different, e.g., by orthogonally validating origins absent in the previous studies.
(4) Some patterns that were identified to be associated with origins of replication, such as G-quadruplexes and nucleosomes phasing, are known to be biases of SNS-seq (see Foulk et al. Characterizing and controlling intrinsic biases of lambda exonuclease in nascent strand sequencing reveals phasing between nucleosomes and G-quadruplex motifs around a subset of human replication origins. Genome Res. 2015;25(5):725-735. doi:10.1101/gr.183848.114).
Are the claims well substantiated?:
My opinion on whether the authors' results support their conclusions depends on whether my concerns about the sites determined from the SNS-seq data can be dismissed. In the case that these concerns can be dismissed, I do think that the claims are compelling.
Impact:
If the origins of replication prove to be distributed as claimed, this study has the potential to be important for two fields. Firstly, in research focused on T. brucei as a disease agent, where essential processes that function differently than in mammals are excellent drug targets. Secondly, this study would impact basic research analyzing DNA replication over the evolutionary tree, where T. brucei can be used as an early-divergent eukaryotic model organism.
Author response:
eLife Assessment
The authors use sequencing of nascent DNA (DNA linked to an RNA primer, "SNS-Seq") to localise DNA replication origins in Trypanosoma brucei, so this work will be of interest to those studying either Kinetoplastids or DNA replication. The paper presents the SNS-seq results for only part of the genome, and there are significant discrepancies between the SNS-Seq results and those from other, previously-published results obtained using other origin mapping methods. The reasons for the differences are unknown and from the data available, it is not possible to assess which origin-mapping method is most suitable for origin mapping in T. brucei. Thus at present, the evidence that origins are distributed as the authors claim - and not where previously mapped - is inadequate.
We would like to clarify a few points regarding our study. Our primary objective was to characterise the topology and genome-wide distribution of short nascent-strand (SNS) enrichments. The stranded SNS-seq approach provides the high strand-specific resolution required to analyse origins. The observation that SNS-seq peaks (potential origins) are most frequently found in intergenic regions is not an artefact of analysing only part of the genome; rather, it is a result of analysing the entire genome.
We agree that orthogonal validation is necessary. However, neither MFA-seq nor TbORC1/CDC6 ChIP-on-chip has yet been experimentally validated as definitive markers of origin activity in T. brucei, nor do they validate each other.
Public Reviews:
Reviewer #1 (Public review):
In this paper, Stanojcic and colleagues attempt to map sites of DNA replication initiation in the genome of the African trypanosome, Trypanosoma brucei. Their approach to this mapping is to isolate 'short-nascent strands' (SNSs), a strategy adopted previously in other eukaryotes (including in the related parasite Leishmania major), which involves isolation of DNA molecules whose termini contain replication-priming RNA. By mapping the isolated and sequenced SNSs to the genome (SNS-seq), the authors suggest that they have identified origins, which they localise to intergenic (strictly, inter-CDS) regions within polycistronic transcription units and suggest display very extensive overlap with previously mapped R-loops in the same loci. Finally, having defined locations of SNS-seq mapping, they suggest they have identified G4 and nucleosome features of origins, again using previously generated data.
Though there is merit in applying a new approach to understand DNA replication initiation in T. brucei, where previous work has used MFA-seq and ChIP of a subunit of the Origin Replication Complex (ORC), there are two significant deficiencies in the study that must be addressed to ensure rigour and accuracy.
(1) The suggestion that the SNS-seq data is mapping DNA replication origins that are present in inter-CDS regions of the polycistronic transcription units of T. brucei is novel and does not agree with existing data on the localisation of ORC1/CDC6, and it is very unclear if it agrees with previous mapping of DNA replication by MFA-seq due to the way the authors have presented this correlation. For these reasons, the findings essentially rely on a single experimental approach, which must be further tested to ensure SNS-seq is truly detecting origins. Indeed, in this regard, the very extensive overlap of SNS-seq signal with RNA-DNA hybrids should be tested further to rule out the possibility that the approach is mapping these structures and not origins.
(2) The authors' presentation of their SNS-seq data is too limited and therefore potentially provides a misleading view of DNA replication in the genome of T. brucei. The work is presented through a narrow focus on SNS-seq signal in the inter-CDS regions within polycistronic transcription units, which constitute only part of the genome, ignoring both the transcription start and stop sites at the ends of the units and the large subtelomeres, which are mainly transcriptionally silent. The authors must present a fuller and more balanced view of SNS-seq mapping across the whole genome to ensure full understanding and clarity.
Regarding comparisons with previous work:
Two other attempts to identify origins in T. brucei —ORC1/CDC6 binding sites (ChIP-on-chip, PMID: 22840408) and MFA-seq (PMID: 22840408, 27228154)—were both produced by the McCulloch group. These methods do not validate each other; in fact, MFA-seq origins overlap with only 4.4% of the 953 ORC1/CDC6 sites (PMID: 29491738). Therefore, low overlap between SNS-seq peaks and ORC1/CDC6 sites cannot disqualify our findings. Similar low overlaps are observed in other parasites (PMID: 38441981, PMID: 38038269, PMID: 36808528) and in human cells (PMID: 38567819).
We also would like to emphasize that the ORC1/CDC6 dataset originally published (PMID: 22840408) is no longer available; only a re-analysis by TritrypDB exists, which differs significantly from the published version (personal communication from Richard McCulloch). While the McCulloch group reported a predominant localization of ORC1/CDC6 sites within SSRs at transcription start and termination regions, our re-analysis indicates that only 10.3% of TbORC1/CDC6-12Myc sites overlapped with 41.8% of SSRs.
MFA-seq does not map individual origins, it rather detects replicated genomic regions by comparing DNA copy number between S- and G1-phases of the cell cycle (PMID: 36640769; PMID: 37469113; PMID: 36455525). The broad replicated regions (0.1–0.5 Mbp) identified by MFA-seq in T. brucei are likely to contain multiple origins, rather than just one. In that sense we disagree with the McCulloch's group who claimed that there is a single origin per broad peak. Our analysis shows that up to 50% of the origins detected by stranded SNS-seq locate within broad MFA-seq regions. The methodology used by McCulloch’s group to infer single origins from MFA-seq regions has not been published or made available, as well as the precise position of these regions, making direct comparison difficult.
Finally, the genomic features we describe—poly(dA/dT) stretches, G4 structures and nucleosome occupancy patterns—are consistent with origin topology described in other organisms.
On the concern that SNS-seq may map RNA-DNA hybrids rather than replication origins: Isolation and sequencing of short nascent strands (SNS) is a well-established and widely used technique for high-resolution origin mapping. This technique has been employed for decades in various laboratories, with numerous publications documenting its use. We followed the published protocol for SNS isolation (Cayrou et al., Methods, 2012, PMID: 22796403). RNA-DNA hybrids cannot persist through the multiple denaturation steps in our workflow, as they melt at 95°C (Roberts and Crothers, Science, 1992; PMID: 1279808). Even in the unlikely event that some hybrids remained, they would not be incorporated into libraries prepared using a single-stranded DNA protocol and therefore would not be sequenced (see Figure 1B and Methods).
Furthermore, our analysis shows that only a small proportion (1.7%) of previously reported RNA-DNA hybrids overlap with SNS-seq origins. It is important to note that RNA-primed nascent strands naturally form RNA-DNA hybrids during replication initiation, meaning the enrichment of RNA-DNA hybrids near origins is both expected and biologically relevant.
On the claim that our analysis focuses narrowly on inter-CDS regions and ignores other genomic compartments: this is incorrect. We mapped and analyzed stranded SNS-seq data across the entire genome of T. brucei 427 wild-type strain (Müller et al., Nature, 2018; PMID: 30333624), including both core and subtelomeric regions. Our findings indicate that most origins are located in intergenic regions, but all analyses were performed using the full set of detected origins, regardless of location.
We did not ignore transcription start and stop sites (TSS/TTS). The manuscript already includes origin distribution across genomic compartments as defined by TriTrypDB (Fig. 2C) and addresses overlap with TSS, TTS and HT in the section “Spatial coordination between the activity of the origin and transcription”. While this overlap is minimal, we have included metaplots in the revised manuscript for clarity.
Reviewer #2 (Public review):
Summary:
Stanojcic et al. investigate the origins of DNA replication in the unicellular parasite Trypanosoma brucei. They perform two experiments, stranded SNS-seq and DNA molecular combing. Further, they integrate various publicly available datasets, such as G4-seq and DRIP-seq, into their extensive analysis. Using this data, they elucidate the structure of the origins of replication. In particular, they find various properties located at or around origins, such as polynucleotide stretches, G-quadruplex structures, regions of low and high nucleosome occupancy, R-loops, and that origins are mostly present in intergenic regions. Combining their population-level SNS-seq and their single-molecule DNA molecular combing data, they elucidate the total number of origins as well as the number of origins active in a single cell.
Strengths:
(1) A very strong part of this manuscript is that the authors integrate several other datasets and investigate a large number of properties around origins of replication. Data analysis clearly shows the enrichment of various properties at the origins, and the manuscript concludes with a very well-presented model that clearly explains the authors' understanding and interpretation of the data.
We sincerely thank you for this positive feedback.
(2) The DNA combing experiment is an excellent orthogonal approach to the SNS-seq data. The authors used the different properties of the two experiments (one giving location information, one giving single-molecule information) well to extract information and contrast the experiments.
Thank you very much for this remark.
(3) The discussion is exemplary, as the authors openly discuss the strengths and weaknesses of the approaches used. Further, the discussion serves its purpose of putting the results in both an evolutionary and a trypanosome-focused context.
Thank you for appreciating our discussion.
Weaknesses:
I have major concerns about the origin of replication sites determined from the SNS-seq data. As a caveat, I want to state that, before reading this manuscript, SNS-seq was unknown to me; hence, some of my concerns might be misplaced.
(1) I do not understand why SNS-seq would create peaks. Replication should originate in one locus, then move outward in both directions until the replication fork moving outward from another origin is encountered. Hence, in an asynchronous population average measurement, I would expect SNS data to be broad regions of + and -, which, taken together, cover the whole genome. Why are there so many regions not covered at all by reads, and why are there such narrow peaks?
Thank you for asking these questions. As you correctly point out, replication forks progress in both directions from their origins and ultimately converge at termination sites. However, the SNS-seq method specifically isolates short nascent strands (SNSs) of 0.5–2.5 kb using a sucrose gradient. These short fragments are generated immediately after origin firing and mark the sites of replication initiation, rather than the entire replicated regions. Consequently: (i) SNS-seq does not capture long replication forks or termination regions, only the immediate vicinity of origins. (ii) The narrow peaks indicate the size of selected SNSs (0.5–2.5 kb) and the fact that many cells initiate replication at the same genomic sites, leading to localized enrichment. (iii) Regions without coverage refer to genomic areas that do not serve as efficient origins in the analyzed cell population. Thus, SNS-seq is designed to map origin positions, but not the entire replicated regions.
(2) I am concerned that up to 96% percent of all peaks are filtered away. If there is so much noise in the data, how can one be sure that the peaks that remain are real? Specifically, if the authors placed the same number of peaks as was measured randomly in intergenic regions, would 4% of these peaks pass the filtering process by chance?
Maintaining the strandness of the sequenced DNA fibres enabled us to filter the peaks, thereby increasing the probability that the filtered peak pairs corresponded to origins. Two SNS peaks must be oriented in a way that reflects the topology of the SNS strands within an active origin: the upstream peak must be on the minus strand and followed by the downstream peak on the plus strand.
As suggested by the reviewer, we tested whether randomly placed plus and minus peaks could reproduce the number of filter-passing peaks using the same bioinformatics workflow. Only 1–6% of random peaks passed the filters, compared with 4–12% in our experimental data, resulting in about 50% fewer selected regions (origins). Moreover, the “origins” from random peaks showed 0% reproducibility across replicates, whereas the experimental data showed 7–64% reproducibility. These results indicate that the retainee peaks are highly unlikely to arise by chance and support the specificity of our approach. Thank you for this suggestion.
(3) There are 3 previous studies that map origins of replication in T. brucei. Devlin et al. 2016, Tiengwe et al. 2012, and Krasiļņikova et al. 2025 (https://doi.org/10.1038/s41467-025-56087-3), all with a different technique: MFA-seq. All three previous studies mostly agree on the locations and number of origins. The authors compared their results to the first two, but not the last study; they found that their results are vastly different from the previous studies (see Supplementary Figure 8A). In their discussion, the authors defend this discrepancy mostly by stating that the discrepancy between these methods has been observed in other organisms. I believe that, given the situation that the other studies precede this manuscript, it is the authors' duty to investigate the differences more than by merely pointing to other organisms. A conclusion should be reached on why the results are different, e.g., by orthogonally validating origins absent in the previous studies.
The MFA-seq data for T. brucei were published in two studies by McCulloch’s group: Tiengwe et al. (2012) using TREU927 PCF cells, and Devlin et al. (2016) using PCF and BSF Lister427 cells. In Krasilnikova et al. (2025), previously published MFA-seq data from Devlin et al. were remapped to a new genome assembly without generating new MFA-seq data, which explains why we did not include that comparison.
Clarifying the differences between MFA-seq and our stranded SNS-seq data is essential. MFA-seq and SNS-seq interrogate different aspects of replication. SNS-seq is a widely used, high-resolution method for mapping individual replication origins, whereas MFA-seq detects replicated regions by comparing DNA copy number between S and G1 phases. MFA-seq identified broad replicated regions (0.1–0.5 Mb) that were interpreted by McCulloch’s group as containing a single origin. We disagree with this interpretation and consider that there are multiple origins in each broad peaks; theoretical considerations of replication timing indicate that far more origins are required for complete genome duplication during the short S-phase. Once this assumption is reconsidered, MFA-seq and SNS-seq results become complementary: MFA-seq identifies replicated regions, while SNS-seq pinpoints individual origins within those regions. Our analysis revealed that up to 50% of the origins detected by stranded SNS-seq were located within the broad MFA peaks. This pattern—broad MFA-seq regions containing multiple initiation sites—has also recently been found in Leishmania by McCulloch’s team using nanopore sequencing (PMID: 26481451). Nanopore sequencing showed numerous initiation sites within MFA-seq regions and additional numerous sites outside these regions in asynchronous cells, consistent with what we observed using stranded SNS-seq in T. brucei. We will expand our discussion and conclude that the discrepancy arises from methodological differences and interpretation. The two approaches provide complementary insights into replication dynamics, rather than ‘vastly different’ results.
We recognize the importance of validating our results in future using an alternative mapping method and functional assays. However, it is important to emphasize that stranded SNS-seq is an origin mapping technique with a very high level of resolution. This technique can detect regions between two divergent SNS peaks, which should represent regions of DNA replication initiation. At present, no alternative technique has been developed that can match this level of resolution.
(4) Some patterns that were identified to be associated with origins of replication, such as G-quadruplexes and nucleosomes phasing, are known to be biases of SNS-seq (see Foulk et al. Characterizing and controlling intrinsic biases of lambda exonuclease in nascent strand sequencing reveals phasing between nucleosomes and G-quadruplex motifs around a subset of human replication origins. Genome Res. 2015;25(5):725-735. doi:10.1101/gr.183848.114).
It is important to note that the conditions used in our study differ significantly from those applied in the Foulk et al. Genome Res. 2015. We used SNS isolation and enzymatic treatments as described in previous reports (Cayrou, C. et al. Genome Res, 2015 and Cayrou, C et al. Methods, 2012). Here, we enriched the SNS by size on a sucrose gradient and then treated this SNS-enriched fraction with high amounts of repeated λ-exonuclease treatments (100u for 16h at 37oC - see Methods). In contrast, Foulk et al. used sonicated total genomic DNA for origin mapping, without enrichment of SNS on a sucrose gradient as we did, and then they performed a λ-exonuclease treatment. A previous study (Cayrou, C. et al. Genome Res, 2015, Figure S2, which can be found at https://genome.cshlp.org/content/25/12/1873/suppl/DC1) has shown that complete digestion of G4-rich DNA sequences is achieved under the conditions we used.
Furthermore, the SNS depleted control (without RNA) was included in our experimental approach. This control represents all molecules that are difficult to digest with lambda exonuclease, including G4 structures. Peak calling was performed against this background control, with the aim of removing false positive peaks resulting from undigested DNA structures. We explained better this step in the revised manuscript.
The key benefit of our study is that the orientation of the enrichments (peaks) remains consistent throughout the sequencing process. We identified an enrichment of two divergent strands synthesised on complementary strands containing G4s. These two divergent strands themselves do not, however, contain G4s (see Fig. 8 for the model). Therefore, the enriched molecules detected in our study do not contain G4s. They are complementary to the strands enriched with G4s. This means that the observed enrichment of
G4s cannot be an artefact of the enzymatic treatments used in this study. We added this part in the discussion of the revised manuscript.
We also performed an additional control which is not mentioned in the manuscript. In parallel with replicating cells, we isolated the DNA from the stationary phase of growth, which primarily contains non-replicating cells. Following the three λ-exonuclease treatments, there was insufficient DNA remaining from the stationary phase cells to prepare the libraries for sequencing. This control strongly indicated that there was little to no contaminating DNA present with the SNS molecules after λ-exonuclease enrichment.
Séjour patrimoine près de Nantes : Le château de Goulaine, premier château de la Loire en Aval©Séjour patrimoine près de Nantes : Le château de Goulaine, premier château de la Loire en AvalUne idée de Séjour patrimoine près de NantesEnvie d’évasion, d’histoire et de charme authentique ? Le Vignoble Nantais est l’endroit rêvé pour un séjour patrimoine près de Nantes.Séjour patrimoine<img class="imageObject-img img-responsive a42-ac-replace-img" src="https://woody.cloudly.space/app/uploads/clisson/2025/11/thumbs/ALAMOUREUX-19901-SAINT-FIACRE-SUR-MAINE-640x214-crop-1762166765.webp" alt="Une idée de week-end sportif à vélo et canoë dans le Vignoble Nantais" itemprop="thumbnail"/>Une idée de week-end sportif à vélo et canoë dans le Vignoble Nantais©Une idée de week-end sportif à vélo et canoë dans le Vignoble Nantais|alexandre lamoureuxUne idée de Week-end sportif
Na een eerdere verkenning bleken bestaande applicaties niet (goed) geschikt voor het bijhouden van gedetailleerde materiaalgegevens.
deze verkenning is al weer meerdere jaren geleden, applicaties hebben zich inmiddels ook ontwikkeld, huidige datamodel lijkt mij prima te passen in huidige BMS
Note: This response was posted by the corresponding author to Review Commons. The content has not been altered except for formatting.
Learn more at Review Commons
In our manuscript, we describe a role for the nuclear mRNA export factor UAP56 (a helicase) during metamorphic dendrite and presynapse pruning in flies. We characterize a UAP56 ATPase mutant and find that it rescues the pruning defects of a uap56 mutant. We identify the actin severing enzyme Mical as a potentially crucial UAP56 mRNA target during dendrite pruning and show alterations at both the mRNA and protein level. Finally, loss of UAP56 also causes presynapse pruning defects with actin abnormalities. Indeed, the actin disassembly factor cofilin is required for pruning specifically at the presynapse.
We thank the reviewers for their constructive comments, which we tried to address experimentally as much as possible. To summarize briefly, while all reviewers saw the results as interesting (e. g., Reviewer 3's significance assessment: "Understanding how post-transcriptional events are linked to key functions in neurons is important and would be of interest to a broad audience") and generally methodologically strong, they thought that our conclusions regarding the potential specificity of UAP56 for Mical mRNA was not fully covered by the data. To address this criticism, we added more RNAi analyses of other mRNA export factors and rephrased our conclusions towards a more careful interpretation, i. e., we now state that the pruning process is particularly sensitive to loss of UAP56. In addition, reviewer 1 had technical comments regarding some of our protein and mRNA analyses. We added more explanations and an additional control for the MS2/MCP system. Reviewers 2 and 3 wanted to see a deeper characterization of the ATPase mutant provided. We generated an additional UAP56 mutant transgene, improved our analyses of UAP56 localization, and added a biochemical control experiment. We hope that our revisions make our manuscript suitable for publication.
This section is mandatory. *Please insert a point-by-point reply describing the revisions that were already carried out and included in the transferred manuscript. *
Comments by reviewer 1.
Major comments
1.
For Figure 4, the MS2/MCP system is not quantitative. Using this technique, it is impossible to determine how many RNAs are located in each "dot". Each of these dots looks quite large and likely corresponds to some phase-separated RNP complex where multiple RNAs are stored and/or transported. Thus, these data do not support the conclusion that Mical mRNA levels are reduced upon UAP56 knockdown. A good quantitative microscopic assay would be something like smFISH. Additinally, the localization of Mical mRNA dots to dendrites is not convincing as it looks like regions where there are dendritic swellings, the background is generally brighter.
Our response
We indeed found evidence in the literature that mRNPs labeled with the MS2/MCP or similar systems form condensates (Smith et al., JCB 2015). Unfortunately, smFISH is not established for this developmental stage and would likely be difficult due to the presence of the pupal case. To address whether the Mical mRNPs in control and UAP56 KD neurons are comparable, we characterized the MCP dots in the respective neurons in more detail and found that their sizes did not differ significantly between control and UAP56 KD neurons. To facilitate interpretability, we also increased the individual panel sizes and include larger panels that only show the red (MCP::RFP) channel. We think these changes improved the figure. Thanks for the insight.
Changes introduced: Figure 5 (former Fig. 4): Increased panel size for MCP::RFP images, left out GFP marker for better visibility. Added new analysis of MCP::RFP dot size (new Fig. 5 I).
1.
Alternatively, levels of Mical mRNA could be verified by qPCR in the laval brain following pan-neuronal UAP56 knockdown or in FACS-sorted fluorescently labeled da sensory neurons. Protein levels could be analyzed using a similar approach.
Our response
We thank the reviewer for this comment. Unfortunately, these experiments are not doable as neuron-wide UAP56 KD is lethal (see Flybase entry for UAP56). From our own experience, FACS-sorting of c4da neurons would be extremely difficult as the GFP marker fluorescence intensity of UAP56 KD neurons is weak - this would likely result in preferential sorting of subsets of neurons with weaker RNAi effects. In addition, FACS-sorting whole neurons would not discriminate between nuclear and cytoplasmic mRNA.
The established way of measuring protein content in the Drosophila PNS system is immunofluorescence with strong internal controls. In our case, we also measured Mical fluorescence intensity of neighboring c1da neurons that do not express the RNAi and show expression levels as relative intensities compared to these internal controls. This procedure rules out the influence of staining variation between samples and is used by other labs as well.
1.
In Figure 5, the authors state that Mical expression could not be detected at 0 h APF. The data presented in Fig. 5C, D suggest the opposite as there clearly is some expression. Moreover, the data shown in Fig. 5D looks significantly brighter than the Orco dsRNA control and appears to localize to some type of cytoplasmic granule. So the expression of Mical does not look normal.
Our response
We thank the reviewer for this comment. In the original image in Fig. 5 C, the c4da neuron overlaps with the dendrite from a neighboring PNS neuron (likely c2da or c3da). The latter neuron shows strong Mical staining. We agree that this image is confusing and exchanged this image for another one from the same genotype.
Changes introduced: Figure 5 L (former Fig. 5 C): Exchanged panel for image without overlap from other neuron.
1.
Sufficient data are not presented to conclude any specificity in mRNA export pathways. Data is presented for one export protein (UAP56) and one putative target (Mical). To adequately assess this, the authors would need to do RNA-seq in UAP56 mutants.
Our response
We thank the reviewer for this comment. To address this, we tested whether knockdown of three other mRNA export factors (NXF1, THO2, THOC5) causes dendrite pruning defects, which was not the case (new Fig. S1). While these data are consistent with specific mRNA export pathways, we agree that they are not proof. We therefore toned down our interpretation and removed the conclusion about specificity. Instead, we now use the more neutral term "increased sensibility (to loss of UAP56)".
Changes introduced: Added new Figure S1: RNAi analyses of NXF1, THO2 and THOC5 in dendrite pruning. Introduced concluding sentence at the end of first Results paragraph: We conclude that c4da neuron dendrite pruning is particularly sensitive to loss of UAP56. (p. 6)
1.
In summary, better quantitative assays should be used in Figures 4 and 5 in order to conclude the expression levels of either mRNA or protein. In its current form, this study demonstrates the novel finding that UAP56 regulates dendrite and presynaptic pruning, potentially via regulation of the actin cytoskeleton. However, these data do not convincingly demonstrate that UAP56 controls these processes by regulating of Mical expression and defintately not by controlling export from the nucleus.
Our response
We hope that the changes we introduced above help clarify this.
1.
While there are clearly dendrites shown in Fig. 1C', the cell body is not readily identifiable. This makes it difficult to assess attachment and suggests that the neuron may be dying. This should be replaced with an image that shows the soma.
Our response
We thank the reviewer for this comment. Changes introduced: we replaced the picture in the panel with one where the cell body is more clearly visible.
1.
The level of knockdown in the UAS56 RNAi and P element insertion lines should be determined. It would be useful to mention the nature of the RNAi lines (long/short hairpin). Some must be long since Dcr has been co-expressed. Another issue raised by this is the potential for off-target effects. shRNAi lines would be preferable because these effects are minimized.
Our response
We thank the reviewer for this comment. Assessment of knockdown efficiency is a control to make sure the manipulations work the way they are intended to. As mRNA isolation from Drosophila PNS neurons is extremely difficult, RNAi or mutant phenotypes in this system are controlled by performing several independent manipulations of the same gene. In our case, we used two independent RNAi lines (both long hairpins from VDRC/Bloomington and an additional insertion of the VDRC line, see Table S1) as well as a mutant P element in a MARCM experiment, i. e., a total of three independent manipulations that all cause pruning defects, and the VDRC RNAi lines do not have any predicted OFF targets (not known for the Bloomington line). If any of these manipulations would not have matched, we would have generated sgRNA lines for CRISPR to confirm.
Minor comments:
1.
The authors should explain what EB1:GFP is marking when introduced in the text.
Our response
We thank the reviewer for this comment. Changes introduced: we explain the EB1::GFP assay in the panel with one where the cell body is more clearly visible.
1.
The da neuron images throughout the figures could be a bit larger.
Our response
We thank the reviewer for this comment. Changes introduced: we changed the figure organization to be able to use larger panels:
the pruning analysis of the ATPase mutations (formerly Fig. 2) is now its own figure (Figure 3).
we increased the panel sizes of the MCP::RFP images (Figure 5 A - I, formerly Fig. 4).
Reviewer #1 (Significance (Required)):
Strengths:
The methodology used to assess dendrite and presynaptic prunings are strong and the phenotypic analysis is conclusive.
Our response
We thank the reviewer for this comment.
Weakness:
The evidence demonstrating that UAP56 regulates the expression of Mical is unconvincing. Similarly, no data is presented to show that there is any specificity in mRNA export pathways. Thus, these major conclusions are not adequately supported by the data.
Our response
We hope the introduced changes address this comment.
__Reviewer #2 (Evidence, reproducibility and clarity (Required)): __
In this paper, the authors describe dendrite pruning defects in c4da neurons in the DEXD box ATPase UAP56 mutant or in neuronal RNAi knockdown. Overexpression UAP56::GFP or UAP56::GFPE194Q without ATPase activity can rescue dendrite pruning defects in UAP56 mutant. They further characterized the mis-localization of UAP56::GFPE194Q and its binding to nuclear export complexes. Both microtubules and the Ubiquitin-proteasome system are intact in UAP56RNAi neurons. However, they suggest a specific effect on MICAL mRNA nuclear export shown by using the MS2-MCP system., resulting in delay of MICAL protein expression in pruned neurons. Furthermore, the authors show that UAP56 is also involved in presynaptic pruning of c4da neuros in VNC and Mica and actin are also required for actin disassembly in presynapses. They propose that UAP56 is required for dendrite and synapse pruning through actin regulation in Drosophila. Following are my comments.
Major comments
1.
The result that UAP56::GFPE194Q rescues the mutant phenotype while the protein is largely mis-localized suggests a novel mechanism or as the authors suggested rescue from combination of residual activities. The latter possibility requires further support, which is important to support the role mRNA export in dendrite and pre-synapse pruning. One approach would be to examine whether other export components like REF1, and NXF1 show similar mutant phenotypes. Alternatively, depleting residual activity like using null mutant alleles or combining more copies of RNAi transgenes could help.
Our response
We thank the reviewer for this comment. We agree that the mislocalization phenotype is interesting and could inform further studies on the mechanism of UAP56. To further investigate this and to exclude that this could represent a gain-of-function due to the introduced mutation, we made and characterized a new additional transgene, UAP56::GFP E194A. This mutant shows largely the same phenotypes as E194Q, with enhanced interactions with Ref1 and partial mislocalization to the cytoplasm. In addition, we tested whether knockdown of THO2, THOC5 or NXF1 causes pruning defects (no).
Changes introduced:
added new Figure S1: RNAi analyses of NXF1, THO2 and THOC5 in dendrite pruning.
made and characterized a new transgene UAP56 E194A (new Fig. 2 B, E, E', 3 C, C', E, F).
1.
The localization of UAP56::GFP (and E194Q) should be analyzed in more details. It is not clear whether the images in Fig. 2A and 2B are from confocal single sections or merged multiple sections. The localization to the nuclear periphery of UAP56::GFP is not clear, and the existence of the E194Q derivative in both nucleus and cytosol (or whether there is still some peripheral enrichment) is not clear if the images are stacked.
Our response
We thank the reviewer for this comment. It is correct that the profiles in the old Figure 2 were from single confocal sections from the displayed images. As it was difficult to create good average profiles with data from multiple neurons, we now introduce an alternative quantification based on categories (nuclear versus dispersed) which includes data from several neurons for each genotype, including the new E194A transgene (new Fig 3 G). Upon further inspection, the increase at the nuclear periphery was not always visible and may have been a misinterpretation. We therefore removed this statement.
Changes introduced:
1.
The Ub-VV-GFP is a new reagent, and its use to detect active proteasomal degradation is by the lack of GFP signals, which could be also due to the lack of expression. The use of Ub-QQ-GFP cannot confirm the expression of Ub-VV-GFP. The proteasomal subunit RPN7 has been shown to be a prominent component in the dendrite pruning pathway (Development 149, dev200536). Immunostaining using RPN7 antibodies to measure the RPN expression level could be a direct way to address the issue whether the proteasomal pathway is affected or not.
Our response
We thank the reviewer for this comment. We agree that it is wise to not only introduce a positive control for the Ub-VV-GFP sensor (the VCP dominant-negative VCP QQ), but also an independent control. As mutants with defects in proteasomal degradation accumulate ubiquitinated proteins (see, e. g., Rumpf et al., Development 2011), we stained controls and UAP56 KD neurons with antibodies against ubiquitin and found that they had similar levels (new Fig. S3).
Changes introduced:
1.
Using the MS2/MCP system to detect the export of MICAL mRNA is a nice approach to confirm the UAP56 activity; lack of UAP56 by RNAi knockdown delays the nuclear export of MS2-MICAL mRNA. The rescue experiment by UAS transgenes could not be performed due to the UAS gene dosage, as suggested by the authors. However, this MS2-MICAL system is also a good assay for the requirement of UAP56 ATPase activity (absence in the E194Q mutant) in this process. Could authors use the MARCM (thus reduce the use of UAS-RNAi transgene) for the rescue experiment? Also, the c4da neuronal marker UAS-CD8-GFP used in Fig4 could be replaced by marker gene directly fused to ppk promoter, which can save a copy of UAS transgene. The results from the rescue experiment would test the dependence of ATPase activity in nuclear export of MICAL mRNA.
Our response
We thank the reviewer for this comment. This is a great idea but unfortunately, this experiment was not feasible due to the (rare) constraints of Drosophila genetics. The MARCM system with rescue already occupies all available chromosomes (X: FLPase, 2nd: FRT, GAL80 + mutant, 3rd: GAL4 + rescue construct), and we would have needed to introduce three additional ones (MCP::RFP and two copies of unmarked genomic MICAL-MS2, all on the third chromosome) that would have needed to be introduced by recombination. Any Drosophilist will see that this is an extreme, likely undoable project :-(
1.
The UAP56 is also involved in presynaptic pruning through regulating actin assembly, and the authors suggest that Mical and cofilin are involved in the process. However, direct observation of lifeact::GFP in Mical or cofilin RNAi knockdown is important to support this conclusion.
Our response
We thank the reviewer for this comment. In response, we analyzed the lifeact::GFP patterns of control and cofilin knockdown neurons and found that loss of cofilin also leads to actin accumulation (new Fig. 7 I, J).
Changes introduced:
Minor comments:
1.
RNA localization is important for dendrite development in larval stages (Brechbiel JL, Gavis ER. Curr Biol. 20;18(10):745-750). Yet, the role of UAP56 is relatively specific and shown only in later-stage pruning. It would need thorough discussion.
Our response
We thank reviewer 2 for this comment. We added the following paragraph to the discussion: "UAP56 has also been shown to affect cytoplasmic mRNA localization in Drosophila oocytes (Meignin and Davis, 2008), opening up the possibility that nuclear mRNA export and cytoplasmic transport are linked. It remains to be seen whether this also applies to dendritic mRNA transport (Brechbiel and Gavis, 2008)." (p.13)
1.
Could authors elaborate on the possible upstream regulators that might be involved, as described in "alternatively, several cofilin upstream regulators have been described (Rust, 2015) which might also be involved in presynapse pruning and subject to UAP56 regulation" in Discussion?
Our response
We thank reviewer 2 for this comment. In the corresponding paragraph, we cite as example now that cofilin is regulated by Slingshot phosphatases and LIM kinase (p.14).
1.
In Discussion, the role of cofilin in pre- and post-synaptic processes was described. The role of Tsr/Cofilin regulating actin behaviors in dendrite branching has been described in c3da and c4da neurons (Nithianandam and Chien, 2018 and other references) should be included in Discussion.
Our response
We thank reviewer 2 for this comment. In response we tested whether cofilin is required for dendrite pruning and found that this, in contrast to Mical, is not the case (new Fig. S6). We cite the above paper in the corresponding results section (p.12).
Changes introduced:
new cofilin dendrite pruning analysis (new Fig. S6).
added cofilin reference in Results.
1.
The authors speculate distinct actin structures have to be disassembled in dendrite and presynapse pruning in Discussion. What are the possible actin structures in both sites could be elaborated.
Our response
We thank reviewer 2 for this comment. In response, we specify in the Discussion: "As Mical is more effective in disassembling bundled F-actin than cofilin (Rajan et al., 2023), it is interesting to speculate that such bundles are more prevalent in dendrites than at presynapses." (p14)
Reviewer #2 (Significance (Required)):
The study initiated a genetic screen for factors involved in a dendrite pruning system and reveals the involvement of nuclear mRNA export is an important event in this process. They further identified the mRNA of the actin disassembly factor MICAL is a candidate substrate in the exporting process. This is consistent with previous finding that MICAL has to be transcribed and translated when pruning is initiated. As the presynapses of the model c4da neuron in this study is also pruned, the dependence on nuclear export and local actin remodeling were also shown. Thus, this study has added another layer of regulation (the nuclear mRNA export) in c4da neuronal pruning, which would be important for the audience interested in neuronal pruning. The study is limited for the confusing result whether ATPase activity of the exporting factor is required.
Reviewer #3 (Evidence, reproducibility and clarity (Required)):
Summary: In the manuscript by Frommeyer, Gigengack et al. entitled "The UAP56 mRNA Export Factor is Required for Dendrite and Synapse Pruning via Actin Regulation in Drosophila" the authors surveyed a number of RNA export/processing factors to identify any required for efficient dendrite and/or synapse pruning. They describe a requirement for a general poly(A) RNA export factor, UAP56, which functions as an RNA helicase. They also study links to aspects of actin regulation.
Overall, while the results are interesting and the impact of loss of UAP56 on the pruning is intriguing, some of the data are overinterpreted as presented. The argument that UAP56 may be specific for the MICAL RNA is not sufficiently supported by the data presented. The two stories about poly(A) RNA export/processing and the actin regulation seem to not quite be connected by the data presented. The events are rather distal within the cell, making connecting the nuclear events with RNA to events at the dendrites/synapse challenging.
Our response
We thank reviewer 3 for this comment. To address this, we tested whether knockdown of three other mRNA export factors (NXF1, THO2, THOC5) causes dendrite pruning defects, which was not the case (new Fig. S1). While these data are consistent with specific mRNA export pathways, we agree that they are not proof. We therefore toned down our interpretation and removed the conclusion about specificity. Instead, we now use the more neutral term "increased sensibility (to loss of UAP56)".
We agree that it is a little hard to tie cofilin to UAP56, as we currently have no evidence that cofilin levels are affected by loss of UAP56, even though both seem to affect lifeact::GFP in a similar way (new Fig. 7 I, J). However, a dysregulation of cofilin can also occur through dysregulation of upstream cofilin regulators such as Slingshot and LIM kinase, making such a relationship possible.
Changes introduced:
added new Figure S1: RNAi analyses of NXF1, THO2 and THOC5 in dendrite pruning.
introduced concluding sentence at the end of first Results paragraph: "We conclude that c4da neuron dendrite pruning is particularly sensitive to loss of UAP56." (p. 6)
add new lifeact::GFP analysis of cofilin KD (new Fig. I, J).
identify potential other targets from the literature in the Discussion (Slingshot phosphatases and LIM kinase, p.14).
There are a number of specific statements that are not supported by references. See, for example, these sentences within the Introduction- "Dysregulation of pruning pathways has been linked to various neurological disorders such as autism spectrum disorders and schizophrenia. The cell biological mechanisms underlying pruning can be studied in Drosophila." The Drosophila sentence is followed by some specific examples that do include references. The authors also provide no reference to support the variant that they create in UAP56 (E194Q) and whether this is a previously characterized fly variant or based on an orthologous protein in a different system. If so, has the surprising mis-localization been reported in another system?
Our response
We thank reviewer 3 for this comment. We added the following references on pruning and disease:
1) Howes, O.D., Onwordi, E.C., 2023. The synaptic hypothesis of schizophrenia version III: a master mechanism. Mol. Psychiatry 28, 1843-1856.
2) Tang, G., et al., 2014. Loss of mTOR-dependent macroautophagy causes autistic-like synaptic pruning deficits. Neuron 83, 1131-43.
To better introduce the E194 mutations, we explain the position of the DECD motif in the Walker B domain, give the corresponding residues in the human and yeast homologues and cite papers demonstrating the importance of this residue for ATPase activity:
3) Saguez, C., et al., 2013. Mutational analysis of the yeast RNA helicase Sub2p reveals conserved domains required for growth, mRNA export, and genomic stability. RNA 19:1363-71.
4) Shen, J., et al., 2007. Biochemical Characterization of the ATPase and Helicase Activity of UAP56, an Essential Pre-mRNA Splicing and mRNA Export Factor. J. Biol. Chem. 282, P22544-22550.
We are not aware of other studies looking at the relationship between the UAP56 ATPase and its localization. Thank you for pointing this out!
Specific Comments:
Specific Comment 1: Figure 1 shows the impact of loss of UAP56 on neuron dendrite pruning. The experiment employs both two distinct dsRNAs and a MARCM clone, providing confidence that there is a defect in pruning upon loss of UAP56. As the authors mention screening against 92 genes that caused splicing defects in S2 cells, inclusion of some examples of these genes that do not show such a defect would enhance the argument for specificity with regard to the role of UAP56. This control would be in addition to the more technical control that is shown, the mCherry dsRNA.
Our response
We thank reviewer 3 for this comment. To address this, we included the full list of screened genes with their phenotypic categorization regarding pruning (103 RNAi lines targeting 64 genes) as Table S1. In addition, we also tested four RNAi lines targeting the nuclear mRNA export factors Nxf1, THO2 and THOC5 which do not cause dendrite pruning defects (Fig. S1).
Changes introduced:
added RNAi screen results as a list in Table S1.
added new Figure S1: RNAi analyses of NXF1, THO2 and THOC5 in dendrite pruning.
Specific Comment 2: Later the authors demonstrate a delay in the accumulation of the Mical protein, so if they assayed these pruning events at later times, would the loss of UAP56 cause a delay in these events as well? Such a correlation would enhance the causality argument the authors make for Mical levels and these pruning events.
Our response
We thank reviewer 3 for this comment. Unfortunately, this is somewhat difficult to assess, as shortly after the 18 h APF timepoint, the epidermal cells that form the attachment substrate for c4da neuron dendrites undergo apoptosis. Where assessed (e. g., Wang et al., 2017, Development) 144: 1851–1862), this process, together with the reduced GAL4 activity of our ppk-GAL4 during the pupal stage (our own observations), eventually leads to pruning, but the causality cannot be easily attributed anymore. We therefore use the 18 h APF timepoint essentially as an endpoint assay.
Specific Comment 3: Figure 2 provides data designed to test the requirement for the ATPase/helicase activity of UAP56 for these trimming events. The first observation, which is surprising, is the mislocalization of the variant (E194Q) that the authors generate. The data shown does not seem to indicate how many cells the results shown represent as a single image and trace is shown the UAP56::GFP wildtype control and the E194Q variant.
Our response
We thank reviewer 3 for this comment. It is correct that the traces shown are from single confocal sections. To better display the phenotypic penetrance, we now added a categorical analysis that shows that the UAP56 E194Q mutant is completely mislocalized in the majority of cells assessed (and the newly added E194A mutant in a subset of cells).
Changes introduced:
__Specific Comment 4: __Given the rather surprising finding that the ATPase activity is not required for the function of UAP56 characterized here, the authors do not provide sufficient references or rationale to support the ATPase mutant that they generate. The E194Q likely lies in the Walker B motif and is equivalent to human E218Q, which can prevent proper ATP hydrolysis in the yeast Sub2 protein. There is no reference to support the nature of the variant created here.
Our response
We thank reviewer 3 for this comment. To better introduce the E194 mutations, we explain the position of the DECD motif in the Walker B domain, give the corresponding residues in the human and yeast homologues (Sub2) and cite papers demonstrating the importance of this residue for ATPase activity:
1) Saguez, C., et al., 2013. Mutational analysis of the yeast RNA helicase Sub2p reveals conserved domains required for growth, mRNA export, and genomic stability. RNA 19:1363-71.
2) Shen, J., et al., 2007. Biochemical Characterization of the ATPase and Helicase Activity of UAP56, an Essential Pre-mRNA Splicing and mRNA Export Factor. J. Biol. Chem. 282, P22544-22550.
__Specific Comment 5: __Given the surprising results, the authors could have included additional variants to ensure the change has the biochemical effect that the authors claim. Previous studies have defined missense mutations in the ATP-binding site- K129A (Lysine to Alanine): This mutation, in both yeast Sub2 and human UAP56, targets a conserved lysine residue that is critical for ATP binding. This prevents proper ATP binding and consequently impairs helicase function. There are also missense mutations in the DEAD-box motif, (Asp-Glu-Ala-Asp) involved in ATP binding and hydrolysis. Mutations in this motif, such as D287A in yeast Sub2 (corresponding to D290A in human UAP56), can severely disrupt ATP hydrolysis, impairing helicase activity. In addition, mutations in the Walker A (GXXXXGKT) and Walker B motifs are can impair ATP binding and hydrolysis in DEAD-box helicases. Missense mutations in these motifs, like G137A (in the Walker A motif), can block ATP binding, while E218Q (in the Walker B motif)- which seems to be the basis for the variant employed here- can prevent proper ATP hydrolysis.
Our response
We thank reviewer 3 for this comment. Our cursory survey of the literature suggested that mutations in the Walker B motif are the most specific as they still preserve ATP binding and their effects have not well been characterized overall. In addition, these mutations can create strong dominant-negatives in related helicases (e. g., Rode et al., 2018 Cell Reports, our lab). To better characterize the role of the Walker B motif in UAP56, we generated and characterized an alternative mutant, UAP56 E194A. While the E194A variant does not show the same penetrance of localization phenotypes as E194Q, it also is partially mislocalized, shows stronger binding to Ref1 and also rescues the uap56 mutant phenotypes without an obvious dominant-negative effect, thus confirming our conclusions regarding E194Q.
Changes introduced:
__Specific Comment 6: __The co-IP results shown in Figure 2C would also seem to have multiple potential interpretations beyond what the authors suggest, an inability to disassemble a complex. The change in protein localization with the E194Q variant could impact the interacting proteins. There is no negative control to show that the UAP56-E194Q variant is not just associated with many, many proteins. Another myc-tagged protein that does not interact would be an ideal control.
Our response
We thank reviewer 3 for this comment. To address this comment, we tried to co-IP UAP56 wt or UAP56 E194Q with a THO complex subunit THOC7 (new Fig. S2). The results show that neither UAP56 variant can co-IP THOC7 under our conditions (likely because the UAP56/THO complex intermediate during mRNA export is disassembled in an ATPase-independent manner (Hohmann et al., Nature 2025)).
Changes introduced:
__Specific Comment 7: __With regard to Figure 3, the authors never define EB1::GFP in the text of the Results, so a reader unfamiliar with this system has no idea what they are seeing. Reading the Materials and Methods does not mitigate this concern as there is only a brief reference to a fly line and how the EB1::GFP is visualized by microscopy. This makes interpretation of the data presented in Figure 3A-C very challenging.
Our response
We thank reviewer 3 for pointing this out. We added a description of the EB1::GFP analysis in the corresponding Results section (p.8).
__Specific Comment 8: __The data shown for MICAL MS2 reporter localization in Figure 4 is nice, but is also fully expected on many former studies analyzing loss of UAP56 or UAP56 hypomorphs in different systems. While creating the reporter is admirable, to make the argument that MICAL localization is in some way preferentially impacted by loss of UAP56, the authors would need to examine several other transcripts. As presented, the authors can merely state that UAP56 seems to be required for the efficient export of an mRNA transcript, which is predicted based on dozens of previous studies dating back to the early 2000s.
Our response
Firstly, thank you for commenting on the validity of the experimental approach! The primary purpose of this experiment was to test whether the mechanism of UAP56 during dendrite pruning conforms with what is known about UAP56's cellular role - which it apparently does. We also noted that our statements regarding the specificity of UAP56 for Mical over other transcripts are difficult. While our experiments would be consistent with such a model, they do not prove it. We therefore toned down the corresponding statements (e. g., the concluding sentence at the end of first Results paragraphis now: "We conclude that c4da neuron dendrite pruning is particularly sensitive to loss of UAP56." (p. 6)).
Minor (and really minor) points:
In the second sentence of the Discussion, the word 'developing' seems to be mis-typed "While a general inhibition of mRNA export might be expected to cause broad defects in cellular processes, our data in develoing c4da neurons indicate that loss of UAP56 mainly affects pruning mechanisms related to actin remodeling."
Sentence in the Results (lack of page numbers makes indicating where exactly a bit tricky)- "We therefore reasoned that Mical expression could be more challenging to c4da neurons." This is a complete sentence as presented, yet, if something is 'more something'- the thing must be 'more than' something else. Presumably, the authors mean that the length of the MICAL transcript could make the processing and export of this transcript more challenging than typical fly transcripts (raising the question of the average length of a mature transcript in flies?).
Our response
Thanks for pointing these out. The typo is fixed, page numbers are added. We changed the sentence to: "Because of the large size of its mRNA, we reasoned that MICAL gene expression could be particularly sensitive to loss of export factors such as UAP56." (p.9) We hope this is more precise language-wise.
Reviewer #3 (Significance (Required)):
Understanding how post-transcriptional events are linked to key functions in neurons is important and would be of interest to a broad audience.
Note: This preprint has been reviewed by subject experts for Review Commons. Content has not been altered except for formatting.
Learn more at Review Commons
Summary:
In the manuscript by Frommeyer, Gigengack et al. entitled "The UAP56 mRNA Export Factor is Required for Dendrite and Synapse Pruning via Actin Regulation in Drosophila" the authors surveyed a number of RNA export/processing factors to identify any required for efficient dendrite and/or synapse pruning. They describe a requirement for a general poly(A) RNA export factor, UAP56, which functions as an RNA helicase. They also study links to aspects of actin regulation.
Overall, while the results are interesting and the impact of loss of UAP56 on the pruning is intriguing, some of the data are overinterpreted as presented. The argument that UAP56 may be specific for the MICAL RNA is not sufficiently supported by the data presented. The two stories about poly(A) RNA export/processing and the actin regulation seem to not quite be connected by the data presented. The events are rather distal within the cell, making connecting the nuclear events with RNA to events at the dendrites/synapse challenging.
There are a number of specific statements that are not supported by references. See, for example, these sentences within the Introduction- "Dysregulation of pruning pathways has been linked to various neurological disorders such as autism spectrum disorders and schizophrenia. The cell biological mechanisms underlying pruning can be studied in Drosophila." The Drosophila sentence is followed by some specific examples that do include references. The authors also provide no reference to support the variant that they create in UAP56 (E194Q) and whether this is a previously characterized fly variant or based on an orthologous protein in a different system. If so, has the surprising mis-localization been reported in another system?
Specific Comments:
Figure 1 shows the impact of loss of UAP56 on neuron dendrite pruning. The experiment employs both two distinct dsRNAs and a MARCM clone, providing confidence that there is a defect in pruning upon loss of UAP56. As the authors mention screening against 92 genes that caused splicing defects in S2 cells, inclusion of some examples of these genes that do not show such a defect would enhance the argument for specificity with regard to the role of UAP56. This control would be in addition to the more technical control that is shown, the mCherry dsRNA. Later the authors demonstrate a delay in the accumulation of the Mical protein, so if they assayed these pruning events at later times, would the loss of UAP56 cause a delay in these events as well? Such a correlation would enhance the causality argument the authors make for Mical levels and these pruning events.
Figure 2 provides data designed to test the requirement for the ATPase/helicase activity of UAP56 for these trimming events. The first observation, which is surprising, is the mislocalization of the variant (E194Q) that the authors generate. The data shown does not seem to indicate how many cells the results shown represent as a single image and trace is shown the UAP56::GFP wildtype control and the E194Q variant.
Given the rather surprising finding that the ATPase activity is not required for the function of UAP56 characterized here, the authors do not provide sufficient references or rationale to support the ATPase mutant that they generate. The E194Q likely lies in the Walker B motif and is equivalent to human E218Q, which can prevent proper ATP hydrolysis in the yeast Sub2 protein. There is no reference to support the nature of the variant created here.
Given the surprising results, the authors could have included additional variants to ensure the change has the biochemical effect that the authors claim. Previous studies have defined missense mutations in the ATP-binding site- K129A (Lysine to Alanine): This mutation, in both yeast Sub2 and human UAP56, targets a conserved lysine residue that is critical for ATP binding. This prevents proper ATP binding and consequently impairs helicase function. There are also missense mutations in the DEAD-box motif, (Asp-Glu-Ala-Asp) involved in ATP binding and hydrolysis. Mutations in this motif, such as D287A in yeast Sub2 (corresponding to D290A in human UAP56), can severely disrupt ATP hydrolysis, impairing helicase activity. In addition, mutations in the Walker A (GXXXXGKT) and Walker B motifs are can impair ATP binding and hydrolysis in DEAD-box helicases. Missense mutations in these motifs, like G137A (in the Walker A motif), can block ATP binding, while E218Q (in the Walker B motif)- which seems to be the basis for the variant employed here- can prevent proper ATP hydrolysis.
The co-IP results shown in Figure 2C would also seem to have multiple potential interpretations beyond what the authors suggest, an inability to disassemble a complex. The change in protein localization with the E194Q variant could impact the interacting proteins. There is no negative control to show that the UAP56-E194Q variant is not just associated with many, many proteins. Another myc-tagged protein that does not interact would be an ideal control.
With regard to Figure 3, the authors never define EB1::GFP in the text of the Results, so a reader unfamiliar with this system has no idea what they are seeing. Reading the Materials and Methods does not mitigate this concern as there is only a brief reference to a fly line and how the EB1::GFP is visualized by microscopy. This makes interpretation of the data presented in Figure 3A-C very challenging. The data shown for MICAL MS2 reporter localization in Figure 4 is nice, but is also fully expected on many former studies analyzing loss of UAP56 or UAP56 hypomorphs in different systems. While creating the reporter is admirable, to make the argument that MICAL localization is in some way preferentially impacted by loss of UAP56, the authors would need to examine several other transcripts. As presented, the authors can merely state that UAP56 seems to be required for the efficient export of an mRNA transcript, which is predicted based on dozens of previous studies dating back to the early 2000s.
Minor (and really minor) points:
In the second sentence of the Discussion, the word 'developing' seems to be mis-typed "While a general inhibition of mRNA export might be expected to cause broad defects in cellular processes, our data in develoing c4da neurons indicate that loss of UAP56 mainly affects pruning mechanisms related to actin remodeling."
Sentence in the Results (lack of page numbers makes indicating where exactly a bit tricky)- "We therefore reasoned that Mical expression could be more challenging to c4da neurons." This is a complete sentence as presented, yet, if something is 'more something'- the thing must be 'more than' something else. Presumably, the authors mean that the length of the MICAL transcript could make the processing and export of this transcript more challenging than typical fly transcripts (raising the question of the average length of a mature transcript in flies?).
Understanding how post-transcriptional events are linked to key functions in neurons is important and would be of interest to a broad audience.
Note: This preprint has been reviewed by subject experts for Review Commons. Content has not been altered except for formatting.
Learn more at Review Commons
In this paper, the authors describe dendrite pruning defects in c4da neurons in the DEXD box ATPase UAP56 mutant or in neuronal RNAi knockdown. Overexpression UAP56::GFP or UAP56::GFPE194Q without ATPase activity can rescue dendrite pruning defects in UAP56 mutant. They further characterized the mis-localization of UAP56::GFPE194Q and its binding to nuclear export complexes. Both microtubules and the Ubiquitin-proteasome system are intact in UAP56RNAi neurons. However, they suggest a specific effect on MICAL mRNA nuclear export shown by using the MS2-MCP system., resulting in delay of MICAL protein expression in pruned neurons. Furthermore, the authors show that UAP56 is also involved in presynaptic pruning of c4da neuros in VNC and Mica and actin are also required for actin disassembly in presynapses. They propose that UAP56 is required for dendrite and synapse pruning through actin regulation in Drosophila. Following are my comments.
Major comments
The result that UAP56::GFPE194Q rescues the mutant phenotype while the protein is largely mis-localized suggests a novel mechanism or as the authors suggested rescue from combination of residual activities. The latter possibility requires further support, which is important to support the role mRNA export in dendrite and pre-synapse pruning. One approach would be to examine whether other export components like REF1, and NXF1 show similar mutant phenotypes. Alternatively, depleting residual activity like using null mutant alleles or combining more copies of RNAi transgenes could help.
The localization of UAP56::GFP (and E194Q) should be analyzed in more details. It is not clear whether the images in Fig. 2A and 2B are from confocal single sections or merged multiple sections. The localization to the nuclear periphery of UAP56::GFP is not clear, and the existence of the E194Q derivative in both nucleus and cytosol (or whether there is still some peripheral enrichment) is not clear if the images are stacked.
The Ub-VV-GFP is a new reagent, and its use to detect active proteasomal degradation is by the lack of GFP signals, which could be also due to the lack of expression. The use of Ub-QQ-GFP cannot confirm the expression of Ub-VV-GFP. The proteasomal subunit RPN7 has been shown to be a prominent component in the dendrite pruning pathway (Development 149, dev200536). Immunostaining using RPN7 antibodies to measure the RPN expression level could be a direct way to address the issue whether the proteasomal pathway is affected or not.
Using the MS2/MCP system to detect the export of MICAL mRNA is a nice approach to confirm the UAP56 activity; lack of UAP56 by RNAi knockdown delays the nuclear export of MS2-MICAL mRNA. The rescue experiment by UAS transgenes could not be performed due to the UAS gene dosage, as suggested by the authors. However, this MS2-MICAL system is also a good assay for the requirement of UAP56 ATPase activity (absence in the E194Q mutant) in this process. Could authors use the MARCM (thus reduce the use of UAS-RNAi transgene) for the rescue experiment? Also, the c4da neuronal marker UAS-CD8-GFP used in Fig4 could be replaced by marker gene directly fused to ppk promoter, which can save a copy of UAS transgene. The results from the rescue experiment would test the dependence of ATPase activity in nuclear export of MICAL mRNA.
The UAP56 is also involved in presynaptic pruning through regulating actin assembly, and the authors suggest that Mical and cofilin are involved in the process. However, direct observation of lifeact::GFP in Mical or cofilin RNAi knockdown is important to support this conclusion.
Minor comments
RNA localization is important for dendrite development in larval stages (Brechbiel JL, Gavis ER. Curr Biol. 20;18(10):745-750). Yet, the role of UAP56 is relatively specific and shown only in later-stage pruning. It would need thorough discussion.
Could authors elaborate on the possible upstream regulators that might be involved, as described in "alternatively, several cofilin upstream regulators have been described (Rust, 2015) which might also be involved in presynapse pruning and subject to UAP56 regulation" in Discussion?
In Discussion, the role of cofilin in pre- and post-synaptic processes was described. The role of Tsr/Cofilin regulating actin behaviors in dendrite branching has been described in c3da and c4da neurons (Nithianandam and Chien, 2018 and other references) should be included in Discussion.
The authors speculate distinct actin structures have to be disassembled in dendrite and presynapse pruning in Discussion. What are the possible actin structures in both sites could be elaborated.
The study initiated a genetic screen for factors involved in a dendrite pruning system and reveals the involvement of nuclear mRNA export is an important event in this process. They further identified the mRNA of the actin disassembly factor MICAL is a candidate substrate in the exporting process. This is consistent with previous finding that MICAL has to be transcribed and translated when pruning is initiated. As the presynapses of the model c4da neuron in this study is also pruned, the dependence on nuclear export and local actin remodeling were also shown. Thus, this study has added another layer of regulation (the nuclear mRNA export) in c4da neuronal pruning, which would be important for the audience interested in neuronal pruning. The study is limited for the confusing result whether ATPase activity of the exporting factor is required.
Note: This preprint has been reviewed by subject experts for Review Commons. Content has not been altered except for formatting.
Learn more at Review Commons
Summary:
This manuscript by Frommeyer et al. explores the role of the helicase and regulator of nuclear export, UAP56, in the control of dendrite and presynaptic pruning in Drosophila larval da sensory neurons. The authors present evidence showing that UAP56 regulates these processes via the actin cytoskeleton and suggest that this is occurs by controlling the expression of the actin severing enzyme, Mical.
Major comments:
The most signficant issue with the manuscript is that some of the major conclusions are not supported by the data. Additional experiment would need to be completed in order support these claims. These (and other) major comments are as follows:
For Figure 4, the ms2/MCP system is not quantitative. Using this technique, it is impossible to determine how many RNAs are located in each "dot". Each of these dots looks quite large and likely corresponds to some phase-separated RNP complex where multiple RNAs are stored and/or transported. Thus, these data do not support the conclusion that Mical mRNA levels are reduced upon UAP56 knockdown. A good quantitative microscopic assay would be something like smFISH. Additinally, the localization of Mical mRNA dots to dendrites is not convincing as it looks like regions where there are dendritic swellings, the background is generally brighter.
Alternatively, levels of Mical mRNA could be verified by qPCR in the laval brain following pan-neuronal UAP56 knockdown or in FACS-sorted fluorescently labeled da sensory neurons. Protein levels could be analyzed using a similar approach.
In Figure 5, the authors state that Mical expression could not be detected at 0 h APF. The data presented in Fig. 5C, D suggest the opposite as there clearly is some expression. Moreover, the data shown in Fig. 5D looks significantly brighter than the Orco dsRNA control and appears to localize to some type of cytoplasmic granule. So the expression of Mical does not look normal.
Sufficient data are not presented to conclude any specificity in mRNA export pathways. Data is presented for one export protein (UAP56) and one putative target (Mical). To adequately assess this, the authors would need to do RNA-seq in UAP56 mutants.
In summary, better quantitative assays should be used in Figures 4 and 5 in order to conclude the expression levels of either mRNA or protein. In its current form, this study demonstrates the novel finding that UAP56 regulates dendrite and presynaptic pruning, potentially via regulation of the actin cytoskeleton. However, these data do not convincingly demonstrate that UAP56 controls these processes by regulating of Mical expression and defintately not by controlling export from the nucleus.
While there are clearly dendrites shown in Fig. 1C', the cell body is not readily identifiable. This makes it difficult to assess attachment and suggests that the neuron may be dying. This should be replaced with an image that shows the soma.
The level of knockdown in the UAS56 RNAi and P element insertion lines should be determined. It would be useful to mention the nature of the RNAi lines (long/short hairpin). Some must be long since Dcr has been co-expressed. Another issue raised by this is the potential for off-target effects. shRNAi lines would be preferable because these effects are minimized.
Minor comments:
The authors should explain what EB1:GFP is marking when introduced in the text.
The da neuron images througout the figures could be a bit larger.
Strengths:
The methodology used to assess dendrite and presynaptic prunings are strong and the phenotypic analysis is conclusive.
Weakness:
The evidence demonstrating that UAP56 regulates the expression of Mical is unconvincing. Similarly, no data is presented to show that there is any specificity in mRNA export pathways. Thus, these major conclusions are not adequately supported by the data.
Advance:
The findings that UAP56 regulate dendrite and synaptic pruning are novel. As is its specific regulation of the actin cytoskeleton. These findings are restricted to a phenotypic analysis and do not show that it is not simply due to the disruption of general mRNA export.
Audience:
In its current form the manuscript whould be of interest to an audience who specializes in the study of RNA binding proteins in the control of neurodevelopment. This would include scientists who work in invertebrate and vertebrate model systems.
My expertise:
My lab uses Drosophila to study the role of RNA binding proteins in neurodevelopment and neurodegeneration. Currently, we use flies as a model to better understand the molecular pathogenesis of neurodevelopmenal disorders such as FXS and ASD.
Author response:
The following is the authors’ response to the original reviews.
Public Reviews:
Reviewer #1 (Public review):
Summary:
This fundamental study identifies a new mechanism that involves a mycobacterial nucleomodulin manipulation of the host histone methyltransferase COMPASS complex to promote infection. Although other intracellular pathogens are known to manipulate histone methylation, this is the first report demonstrating the specific targeting of the COMPASS complex by a pathogen. The rigorous experimental design using state-of-the art bioinformatic analysis, protein modeling, molecular and cellular interaction, and functional approaches, culminating with in vivo infection modeling, provides convincing, unequivocal evidence that supports the authors' claims. This work will be of particular interest to cellular microbiologists working on microbial virulence mechanisms and effectors, specifically nucleomodulins, and cell/cancer biologists that examine COMPASS dysfunction in cancer biology.
Strengths:
(1) The strengths of this study include the rigorous and comprehensive experimental design that involved numerous state-of-the-art approaches to identify potential nucleomodulins, define molecular nucleomodulin-host interactions, cellular nucleomodulin localization, intracellular survival, and inflammatory gene transcriptional responses, and confirmation of the inflammatory and infection phenotype in a small animal model.
(2) The use of bioinformatic, cellular, and in vivo modeling that are consistent and support the overall conclusions is a strength of the study. In addition, the rigorous experimental design and data analysis, including the supplemental data provided, further strengthen the evidence supporting the conclusions.
Weaknesses:
(1) This work could be stronger if the MgdE-COMPASS subunit interactions that negatively impact COMPASS complex function were better defined. Since the COMPASS complex consists of many enzymes, examining the functional impact on each of the components would be interesting.
We thank the reviewer for this insightful comment. A biochemistry assays could be helpful to interpret the functional impact on each of the components by MgdE interaction. However, the purification of the COMPASS complex could be a hard task itself due to the complexity of the full COMPASS complex along with its dynamic structural properties and limited solubility.
(2) Examining the impact of WDR5 inhibitors on histone methylation, gene transcription, and mycobacterial infection could provide additional rigor and provide useful information related to the mechanisms and specific role of WDR5 inhibition on mycobacterial infection.
We thank the reviewer for the comment. A previous study showed that WIN-site inhibitors, such as compound C6, can displace WDR5 from chromatin, leading to a reduction in global H3K4me3 levels and suppression of immune-related gene expression (Hung et al., Nucleic Acids Res, 2018; Bryan et al., Nucleic Acids Res, 2020). These results closely mirror the functional effects we observed for MgdE, suggesting that MgdE may act as a functional mimic of WDR5 inhibition. This supports our proposed model in which MgdE disrupts COMPASS activity by targeting WDR5, thereby dampening host pro-inflammatory responses.
(3) The interaction between MgdE and COMPASS complex subunit ASH2L is relatively undefined, and studies to understand the relationship between WDR5 and ASH2L in COMPASS complex function during infection could provide interesting molecular details that are undefined in this study.
We thank the reviewer for the comment. In this study, we constructed single and multiple point mutants of MgdE at residues S<sup>80</sup>, D<sup>244</sup>, and H<sup>247</sup> to identify key amino acids involved in its interaction with ASH2L (Figure 5A and B; New Figure S4C). However, these mutations did not interrupt the interaction with MgdE, suggesting that more residues are involved in the interaction.
ASH2L and WDR5 function cooperatively within the WRAD module to stabilize the SET domain and promote H3K4 methyltransferase activity with physiological conditions (Couture and Skiniotis, Epigenetics, 2013; Qu et al., Cell, 2018; Rahman et al., Proc Natl Acad Sci U S A, 2022). ASH2L interacts with RbBP5 via its SPRY domain, whereas WDR5 bridges MLL1 and RbBP5 through the WIN and WBM motifs (Chen et al., Cell Res, 2012; Park et al., Nat Commun, 2019). The interaction status between ASH2L and WDR5 during mycobacterial infection could not be determined in our current study.
(4) The AlphaFold prediction results for all the nuclear proteins examined could be useful. Since the interaction predictions with COMPASS subunits range from 0.77 for WDR5 and 0.47 for ASH2L, it is not clear how the focus on COMPASS complex over other nuclear proteins was determined.
We thank the reviewer for the comment. We employed AlphaFold to predict the interactions between MgdE and the major nuclear proteins. This screen identified several subunits of the SET1/COMPASS complex as high-confidence candidates for interaction with MgdE (Figure S4A). This result is consistent with a proteomic study by Penn et al. which reported potential interactions between MgdE and components of the human SET1/COMPASS complex based on affinity purification-mass spectrometry analysis (Penn et al., Mol Cell, 2018).
Reviewer #2 (Public review):
Summary:
The manuscript by Chen et al addresses an important aspect of pathogenesis for mycobacterial pathogens, seeking to understand how bacterial effector proteins disrupt the host immune response. To address this question, the authors sought to identify bacterial effectors from M. tuberculosis (Mtb) that localize to the host nucleus and disrupt host gene expression as a means of impairing host immune function.
Strengths:
The researchers conducted a rigorous bioinformatic analysis to identify secreted effectors containing mammalian nuclear localization signal (NLS) sequences, which formed the basis of quantitative microscopy analysis to identify bacterial proteins that had nuclear targeting within human cells. The study used two complementary methods to detect protein-protein interaction: yeast two-hybrid assays and reciprocal immunoprecipitation (IP). The combined use of these techniques provides strong evidence of interactions between MgdE and SET1 components and suggests that the interactions are, in fact, direct. The authors also carried out a rigorous analysis of changes in gene expression in macrophages infected with the mgdE mutant BCG. They found strong and consistent effects on key cytokines such as IL6 and CSF1/2, suggesting that nuclear-localized MgdE does, in fact, alter gene expression during infection of macrophages.
Weaknesses:
There are some drawbacks in this study that limit the application of the findings to M. tuberculosis (Mtb) pathogenesis. The first concern is that much of the study relies on ectopic overexpression of proteins either in transfected non-immune cells (HEK293T) or in yeast, using 2-hybrid approaches. Some of their data in 293T cells is hard to interpret, and it is unclear if the protein-protein interactions they identify occur during natural infection with mycobacteria. The second major concern is that pathogenesis is studied using the BCG vaccine strain rather than virulent Mtb. However, overall, the key findings of the paper - that MgdE interacts with SET1 and alters gene expression are well-supported.
We thank the reviewer for the comment. We agree that the ectopic overexpression could not completely reflect a natural status, although these approaches were adopted in many similar experiments (Drerup et al., Molecular plant, 2013; Chen et al., Cell host & microbe, 2018; Ge et al., Autophagy, 2021). Further, the MgdE localization experiment using Mtb infected macrophages will be performed to increase the evidence in the natural infection.
We agree with the reviewer that BCG strain could not fully recapitulate the pathogenicity or immunological complexity of M. tuberculosis infection. We employed BCG as a biosafe surrogate model since it was acceptable in many related studies (Wang et al., Nat Immunol, 2025; Wang et al., Nat Commun, 2017; Péan et al., Nat Commun, 2017; Li et al., J Biol Chem, 2020).
Reviewer #3 (Public review):
In this study, Chen L et al. systematically analyzed the mycobacterial nucleomodulins and identified MgdE as a key nucleomodulin in pathogenesis. They found that MgdE enters into host cell nucleus through two nuclear localization signals, KRIR<sup>108-111</sup> and RLRRPR<sup>300-305</sup>, and then interacts with COMPASS complex subunits ASH2L and WDR5 to suppress H3K4 methylation-mediated transcription of pro-inflammatory cytokines, thereby promoting mycobacterial survival. This study is potentially interesting, but there are several critical issues that need to be addressed to support the conclusions of the manuscript.
(1) Figure 2: The study identified MgdE as a nucleomodulin in mycobacteria and demonstrated its nuclear translocation via dual NLS motifs. The authors examined MgdE nuclear translocation through ectopic expression in HEK293T cells, which may not reflect physiological conditions. Nuclear-cytoplasmic fractionation experiments under mycobacterial infection should be performed to determine MgdE localization.
We thank the reviewer for this insightful comment. In the revised manuscript, we addressed this concern by performing nuclear-cytoplasmic fractionation experiments using M. bovis BCG-infected macrophages to assess the subcellular localization of MgdE (New Figure 2F) (Lines 146–155). Nuclear-cytoplasmic fractionation experiments showed that WT MgdE and the NLS single mutants (MgdE<sup>ΔNLS1</sup> and MgdE<sup>ΔNLS2</sup>) could be detected both in the cytoplasm and in the nucleus, while the double mutant MgdE<sup>ΔNLS1-2</sup> was detectable only in the cytoplasm. These findings strongly indicate that MgdE is capable of translocating into the host cell nucleus during BCG infection, and that this nuclear localization relies on the dual NLS motifs.
(2) Figure 2F: The authors detected MgdE-EGFP using an anti-GFP antibody, but EGFP as a control was not detected in its lane. The authors should address this technical issue.
We thank the reviewer for this question. In the revised manuscript, we have included the uncropped immunoblot images, which clearly show the EGFP band in the corresponding lane. These have been provided in the New Figure 2E.
(3) Figure 3C-3H: The data showing that the expression of all detected genes in 24 h is comparable to that in 4 h (but not 0 h) during WT BCG infection is beyond comprehension. The issue is also present in Figure 7C, Figure 7D, and Figure S7. Moreover, since Il6, Il1β (pro-inflammatory), and Il10 (anti-inflammatory) were all upregulated upon MgdE deletion, how do the authors explain the phenomenon that MgdE deletion simultaneously enhanced these gene expressions?
We thank the reviewer for the comment. A relative quantification method was used in our qPCR experiments to normalize the WT expression levels in Figure 3C–3H, Figure 7C, 7D, and New Figure S6.
The concurrent induction of both types of cytokines likely represents a dynamic host strategy to fine-tune immune responses during infection. This interpretation is supported by previous studies (Podleśny-Drabiniok et al., Cell Rep, 2025; Cicchese et al., Immunological Reviews, 2018).
(4) Figure 5: The authors confirmed the interactions between MgdE and WDR5/ASH2L. How does the interaction between MgdE and WDR5 inhibit COMPASS-dependent methyltransferase activity? Additionally, the precise MgdE-ASH2L binding interface and its functional impact on COMPASS assembly or activity require clarification.
We thank the reviewer for this insightful comment. We cautiously speculate that the MgdE interaction inhibits COMPASS-dependent methyltransferase activity by interfering with the integrity and stability of the COMPASS complex. Accordingly, we have incorporated the following discussion into the revised manuscript (Lines 303-315):
“The COMPASS complex facilitates H3K4 methylation through a conserved assembly mechanism involving multiple core subunits. WDR5, a central scaffolding component, interacts with RbBP5 and ASH2L to promote complex assembly and enzymatic activity (Qu et al., 2018; Wysocka et al., 2005). It also recognizes the WIN motif of methyltransferases such as MLL1, thereby anchoring them to the complex and stabilizing the ASH2L-RbBP5 dimer (Hsu et al., Cell, 2018). ASH2L further contributes to COMPASS activation by interacting with both RbBP5 and DPY30 and by stabilizing the SET domain, which is essential for efficient substrate recognition and catalysis (Qu et al., Cell, 2018; Park et al., Nat Commun, 2019). Our work shows that MgdE binds both WDR5 and ASH2L and inhibits the methyltransferase activity of the COMPASS complex. Site-directed mutagenesis revealed that residues D<sup>224</sup> and H<sup>247</sup> of MgdE are critical for WDR5 binding, as the double mutant MgdE-D<sup>224</sup>A/H<sup>247</sup>A fails to interact with WDR5 and shows diminished suppression of H3K4me3 levels (Figure 5D).”
Regarding the precise MgdE-ASH2L binding interface, we attempted to identify the key interaction site by introducing point mutations into ASH2L. However, these mutations did not disrupt the interaction (Figure 5A and B; New Figure S4C), suggesting that more residues are involved in the interaction.
(5) Figure 6: The authors proposed that the MgdE-regulated COMPASS complex-H3K4me3 axis suppresses pro-inflammatory responses, but the presented data do not sufficiently support this claim. H3K4me3 inhibitor should be employed to verify cytokine production during infection.
We thank the reviewer for the comment. We have now revised the description in lines 220-221 and lines 867-868 "MgdE suppresses host inflammatory responses probably by inhibition of COMPASS complex-mediated H3K4 methylation."
(6) There appears to be a discrepancy between the results shown in Figure S7 and its accompanying legend. The data related to inflammatory responses seem to be missing, and the data on bacterial colonization are confusing (bacterial DNA expression or CFU assay?).
We thank the reviewer for the comment. New Figure S6 specifically addresses the effect of MgdE on bacterial colonization in the spleens of infected mice, which was assessed by quantitative PCR rather than by CFU assay.
We have now revised the legend of New Figure S6 as below (Lines 986-991):
“MgdE facilitates bacterial colonization in the spleens of infected mice. Bacterial colonization was assessed in splenic homogenates from infected mice (as described in Figure 7A) by quantifying bacterial DNA using quantitative PCR at 2, 14, 21, 28, and 56 days post-infection.”
(7) Line 112-116: Please provide the original experimental data demonstrating nuclear localization of the 56 proteins harboring putative NLS motifs.
We thank the reviewer for the comment. We will provide this data in the New Table S3.
Recommendations for the authors:
Reviewer #2 (Recommendations for the authors):
There are a few concerns about specific experiments:
Major Comments:
(1) Questions about the exact constructs used in their microscopy studies and the behavior of their controls. GFP is used as a negative control, but in the data they provide, the GFP signal is actually nuclear-localized (for example, Figure 1c, Figure 2a). Later figures do show other constructs with clear cytoplasmic localization, such as the delta-NLS-MgdE-GFP in Figure 2D. This raises significant questions about how the microscopy images were analyzed and clouds the interpretation of these findings. It is also not clear if their microscopy studies use the mature MdgE, lacking the TAT signal peptide after signal peptidase cleavage (the form that would be delivered into the host cell) or if they are transfecting the pro-protein that still has the TAT signal peptide (a form that would present in the bacterial cell but that would not be found in the host cell). This should be clarified, and if their construct still has the TAT peptide, then key findings such as nuclear localization and NLS function should be confirmed with the mature protein lacking the signal peptide.
We thank the reviewer for this question. EGFP protein can passively diffuse through nuclear pores due to its smaller size (Petrovic et al., Science, 2022; Yaseen et al., Nat Commun, 2015; Bhat et al., Nucleic Acids Res, 2015). However, upon transfection with EGFP-tagged wild-type MdgE and its NLS deletion mutants (MdgE<sup>ΔNLS1</sup>, MdgE<sup>ΔNLS2</sup>, and MdgE<sup>ΔNLS1-2</sup>), we observed significantly stronger nuclear fluorescence in cells expressing wild-type MdgE compared to the EGFP protein. Notably, the MdgE<sup>ΔNLS1-2</sup>-EGFP mutant showed almost no detectable nuclear fluorescence (Figure 2C, D, and E). These results indicate that (i) MdgE-EGFP fusion protein could not enter the nucleus by passive diffusion, and (ii) EGFP does not interfere with the nuclear targeting ability of MdgE.
We did not construct a signal peptide-deleted MgdE for transfection assays. Instead, we performed an infection experiment using recombinant M. bovis BCG strains expressing Flag-tagged wild-type MgdE. The mature MgdE protein (signal peptide cleaved) can be detected in the nucleus fractionation (New Figure 2F), suggesting that the signal peptide does not play a role for the nuclear localization of MgdE.
(2) The localization of MdgE is not shown during actual infection. The study would be greatly strengthened by an analysis of the BCG strain expressing their MdgE-FLAG construct.
We thank the reviewer for the comment. In the revised manuscript, we constructed M. bovis BCG strains expressing FLAG-tagged wild-type MdgE as well as NLS deletion mutants (MdgE<sup>ΔNLS1</sup>, MdgE<sup>ΔNLS2</sup>, and MdgE<sup>ΔNLS1-2</sup>). These strains were used to infect THP-1 cells, and nuclear-cytoplasmic fractionation was performed 24 hours post-infection.
Nuclear-cytoplasmic fractionation experiments showed that WT MgdE and the NLS single mutants could be detected both in the cytoplasm and in the nucleus by immunoblotting, while the double mutant MgdE<sup>ΔNLS1-2</sup> was detectable only in the cytoplasm (New Figure 2F) (Lines 146–155). These findings indicate that MdgE is capable of entering the host cell nucleus during BCG infection, and that this nuclear localization depends on the presence of both its N-terminal and C-terminal NLS motifs.
(3) Their pathogenesis studies suggesting a role for MdgE would be greatly strengthened by studying MdgE in virulent Mtb rather than the BCG vaccine strain. If this is not possible because of technical limitations (such as lack of a BSL3 facility), then at least a thorough discussion of studies that examined Rv1075c/MdgE in Mtb is important. This would include a discussion of the phenotype observed in a previously published study examining the Mtb Rv1075c mutant that showed a minimal phenotype in mice (PMID: 31001637) and would also include a discussion of whether Rv1075c was identified in any of the several in vivo Tn-Seq studies done on Mtb.
We thank the reviewer for this insightful comment. In the revised manuscript, we have incorporated a more thorough discussion of prior studies that examined Rv1075c/MgdE in Mtb, including the reported minimal phenotype of an Mtb MgdE mutant in mice (PMID: 31001637) (Lines 288–294).
In the latest TnSeq studies in M. tuberculosis, Rv1075c/MgdE was not classified as essential for in vivo survival or virulence (James et al., NPJ Vaccines, 2025; Zhang et al., Cell, 2013). However, this absence should not be interpreted as evidence of dispensability since these datasets also failed to identify some well characterized virulence factors including Rv2067c (Singh et al., Nat Commun, 2023), PtpA (Qiang et al., Nat Commun, 2023), and PtpB (Chai et al., Science, 2022) which were demonstrated to be required for the virulence of Mtb.
Minor Comments:
(1) Multiple figures with axes with multiple discontinuities used when either using log-scale or multiple graphs is more appropriate, including 3B, 7A.
We sincerely thank the reviewer for pointing this out. In the revised manuscript, we have updated Figure 3B and Figure 7A.
(2) Figure 1C - Analysis of only nuclear MFI can be very misleading because it is affected by the total expression of each construct. Ratios of nuclear to cytoplasmic MFI are a more rigorous analysis.
We thank the reviewer for this comment. We agree that analyzing the ratio of nuclear to cytoplasmic mean fluorescence intensity (MFI) provides a more rigorous quantification of nuclear localization, particularly when comparing constructs with different expression levels. However, the analysis presented in Figure 1C was intended as a preliminary qualitative screen to identify Tat/SPI-associated proteins with potential nuclear localization, rather than a detailed quantitative assessment.
(3) Figure 5C - Controls missing and unclear interpretation of their mutant phenotype. There is no mock or empty-vector control transfection, and their immunoblot shows a massive increase in total cellular H3K4me3 signal in the bulk population, although their prior transfection data show only a small fraction of cells are expressing MdgE. They also see a massive increase in methylation in cells transfected with the inactive mutant, but the reason for this is unclear. Together, these data raise questions about the specificity of the increasing methylation they observe. An empty vector control should be included, and the phenotype of the mutant explained.
We thank the reviewer for this comment. In the revised manuscript, we transfected HEK293T cells with an empty EGFP vector and performed a quantitative analysis of H3K4me3 levels. The results demonstrated that, at the same time point, cells expressing MdgE showed significantly lower levels of H3K4me3 compared to both the EGFP control and the catalytically inactive mutant MdgE (D<sup>244</sup>A/H<sup>247</sup>A) (New Figure 5D) (Lines 213–216). These findings support the conclusion that MdgE specifically suppresses H3K4me3 levels in cells.
(4) Figure S1A - The secretion assay is lacking a critical control of immunoblotting a cytoplasmic bacterial protein to demonstrate that autolysis is not releasing proteins into the culture filtrate non-specifically - a common problem with secretion assays in mycobacteria.
We thank the reviewer for this comment. To address the concerns, we examined FLAG-tagged MgdE and the secreted antigen Ag85B in the culture supernatants by monitoring the cytoplasmic protein GlpX. The absence of GlpX in the supernatant confirmed that there was no autolysis in the experiment. We could detect MgdE-Flag in the culture supernatant (New Figure S2A), indicating that MgdE is a secreted protein.
(5) The volcano plot of their data shows that the proteins with the smallest p-values have the smallest fold-changes. This is unusual for a transcriptomic dataset and should be explained.
We thank the reviewer for this comment. We are not sure whether the p-value is correlated with fold-change in the transcriptomic dataset. This is probably case by case.
Reviewer #3 (Recommendations for the authors):
There are several minor comments:
(1) Line 104-109: The number of proteins harboring NLS motifs and candidate proteins assigned to the four distinct pathways does not match the data presented in Table S2. Please recheck the details. Figure 1A and B, as well as Figure S1A and B, should also be corrected accordingly.
We thank the reviewer for the comment. We have carefully checked the details and the numbers were confirmed and updated.
(2) Please add the scale bar in all image figures, including Figure 1C, Figure 2D, Figure 5C, Figure 7B, and Figure S2.
We thank the reviewer for this suggestion. We have now added scale bars to all relevant image figures in the revised manuscript, including Figure 1C, New Figure 2C, Figure 5C, Figure 7B, and New Figure S2B.
(3) Please add the molecular marker in all immunoblotting figures, including Figure 2C, Figure 2F, Figure 4B, Figure 4C, Figure 5B, Figure 5D, and Figure S5.
We thank the reviewer for this suggestion. We have now added the molecular marker in all immunoblotting figures in the revised manuscript, including New Figure 2E–F, Figure 4B–C, Figure 5B and D, Figure S2A, New Figure S2E and New Figure S4C.
References
Bryan AF, Wang J, Howard GC, Guarnaccia AD, Woodley CM, Aho ER, Rellinger EJ, Matlock BK, Flaherty DK, Lorey SL, Chung DH, Fesik SW, Liu Q, Weissmiller AM, Tansey WP (2020) WDR5 is a conserved regulator of protein synthesis gene expression Nucleic Acids Res 48:2924-2941.
Chai Q, Yu S, Zhong Y, Lu Z, Qiu C, Yu Y, Zhang X, Zhang Y, Lei Z, Qiang L, Li BX, Pang Y, Qiu XB, Wang J, Liu CH (2022) A bacterial phospholipid phosphatase inhibits host pyroptosis by hijacking ubiquitin Science 378(6616):eabq0132.
Chen C, Nguyen BN, Mitchell G, Margolis SR, Ma D, Portnoy DA (2018) The listeriolysin O PEST-like sequence co-opts AP-2-mediated endocytosis to prevent plasma membrane damage during Listeria infection Cell host & microbe 23: 786-795.
Chen Y, Cao F, Wan B, Dou Y, Lei M (2012) Structure of the SPRY domain of human Ash2L and its interactions with RbBP5 and DPY30 Cell Res 22:598–602.
Cicchese JM, Evans S, Hult C, Joslyn LR, Wessler T, Millar JA, Marino S, Cilfone NA, Mattila JT, Linderman JJ, Kirschner DE (2018) Dynamic balance of pro‐ and anti‐inflammatory signals controls disease and limits pathology Immunological Reviews 285: 147–167.
Couture JF, Skiniotis G (2013) Assembling a COMPASS Epigenetics 8:349-54
Drerup MM, Schlücking K, Hashimoto K, Manishankar P, Steinhorst L, Kuchitsu K, Kudla J (2013) The calcineurin B-like calcium sensors CBL1 and CBL9 together with their interacting protein kinase CIPK26 regulate the Arabidopsis NADPH oxidase RBOHF Molecular plant 6: 559-569.
Ge P, Lei Z, Yu Y, Lu Z, Qiang L, Chai Q, Zhang Y, Zhao D, Li B, Pang Y, Liu C, Wang J (2021) M. tuberculosis PknG Manipulates Host Autophagy Flux to Promote Pathogen Intracellular Survival Autophagy 18: 576–94.
Hung KH, Woo YH, Lin IY, Liu CH, Wang LC, Chen HY, Chiang BL, Lin KI (2018) The KDM4A/KDM4C/NF-κB and WDR5 epigenetic cascade regulates the activation of B cells Nucleic Acids Res 46:5547–5560.
James KS, Jain N, Witzl K, Cicchetti N, Fortune SM, Ioerger TR, Martinot AJ, Carey AF (2025) TnSeq identifies genetic requirements of Mycobacterium tuberculosis for survival under vaccine-induced immunity NPJ Vaccines 10:103.
Li X, Chen L, Liao J, Hui J, Li W, He ZG (2020) A novel stress-inducible CmtR-ESX3-Zn²⁺ regulatory pathway essential for survival of Mycobacterium bovis under oxidative stress J Biol Chem 295:17083–17099.
Park SH, Ayoub A, Lee YT, Xu J, Kim H, Zheng W, Zhang B, Sha L, An S, Zhang Y, Cianfrocco MA, Su M, Dou Y, Cho US (2019) Cryo-EM structure of the human MLL1 core complex bound to the nucleosome Nat Commun 10:5540.
Penn BH, Netter Z, Johnson JR, Von Dollen J, Jang GM, Johnson T, Ohol YM, Maher C, Bell SL, Geiger K (2018) An Mtb-human protein-protein interaction map identifies a switch between host antiviral and antibacterial responses Mol Cell 71:637-648.e5.
Petrovic S, Samanta D, Perriches T, Bley CJ, Thierbach K, Brown B, Nie S, Mobbs GW, Stevens TA, Liu X, Tomaleri GP, Schaus L, Hoelz A (2022) Architecture of the linker-scaffold in the nuclear pore Science 376: eabm9798.
Podleśny-Drabiniok A, Romero-Molina C, Patel T, See WY, Liu Y, Marcora E, Goate AM (2025) Cytokine-induced reprogramming of human macrophages toward Alzheimer's disease-relevant molecular and cellular phenotypes in vitro Cell Rep 44:115909.
Qiang L, Zhang Y, Lei Z, Lu Z, Tan S, Ge P, Chai Q, Zhao M, Zhang X, Li B, Pang Y, Zhang L, Liu CH, Wang J (2023) A mycobacterial effector promotes ferroptosis-dependent pathogenicity and dissemination Nat Commun 14:1430.
Qu Q, Takahashi YH, Yang Y, Hu H, Zhang Y, Brunzelle JS, Couture JF, Shilatifard A, Skiniotis G (2018) Structure and Conformational Dynamics of a COMPASS Histone H3K4 Methyltransferase Complex Cell 174:1117-1126.e12.
Rahman S, Hoffmann NA, Worden EJ, Smith ML, Namitz KEW, Knutson BA, Cosgrove MS, Wolberger C (2022) Multistate structures of the MLL1-WRAD complex bound to H2B-ubiquitinated nucleosome Proc Natl Acad Sci U S A 119:e2205691119.
Sharma G, Upadhyay S, Srilalitha M, Nandicoori VK, Khosla S 2015 The interaction of mycobacterial protein Rv2966c with host chromatin is mediated through non-CpG methylation and histone H3/H4 binding Nucleic Acids Res 43:3922-37.
Singh PR, Dadireddy V, Udupa S, Kalladi SM, Shee S, Khosla S, Rajmani RS, Singh A, Ramakumar S, Nagaraja V (2023) The Mycobacterium tuberculosis methyltransferase Rv2067c manipulates host epigenetic programming to promote its own survival Nat Commun 14:8497.
Wang J, Ge P, Qiang L, Tian F, Zhao D, Chai Q, Zhu M, Zhou R, Meng G, Iwakura Y, Gao GF, Liu CH (2017) The mycobacterial phosphatase PtpA regulates the expression of host genes and promotes cell proliferation Nat Commun 8:244.
Wang J, Li BX, Ge PP, Li J, Wang Q, Gao GF, Qiu XB, Liu CH (2015) Mycobacterium tuberculosis suppresses innate immunity by coopting the host ubiquitin system Nat Immunol 16:237–245
Wysocka J, Swigut T, Milne TA, Dou Y, Zhang X, Burlingame AL, Roeder RG, Brivanlou AH, Allis CD (2005) WDR5 associates with histone H3 methylated at K4 and is essential for H3 K4 methylation and vertebrate development Cell 121:859-72.
Yaseen I, Kaur P, Nandicoori VK, Khosla S (2015) Mycobacteria modulate host epigenetic machinery by Rv1988 methylation of a non-tail arginine of histone H3 Nat Commun 6:8922.
Zhang L, Kent JE, Whitaker M, Young DC, Herrmann D, Aleshin AE, Ko YH, Cingolani G, Saad JS, Moody DB, Marassi FM, Ehrt S, Niederweis M (2022) A periplasmic cinched protein is required for siderophore secretion and virulence of Mycobacterium tuberculosis Nat Commun 13:2255.
Zhang YJ, Reddy MC, Ioerger TR, Rothchild AC, Dartois V, Schuster BM, Trauner A, Wallis D, Galaviz S, Huttenhower C, Sacchettini JC, Behar SM, Rubin EJ (2013) Tryptophan biosynthesis protects mycobacteria from CD4 T-cell-mediated killing Cell 155:1296-308.
RRID:SCR_003280
DOI: 10.1371/journal.pbio.3003476
Resource: Xenbase (RRID:SCR_003280)
Curator: @scibot
SciCrunch record: RRID:SCR_003280
RRID:CVCL_0092
DOI: 10.1038/s42003-025-09415-8
Resource: (CLS Cat# 300297/NA, RRID:CVCL_0092)
Curator: @scibot
SciCrunch record: RRID:CVCL_0092
RRID:AB_10015300
DOI: 10.1038/s41531-025-01244-0
Resource: (Vector Laboratories Cat# BA-4001, RRID:AB_10015300)
Curator: @scibot
SciCrunch record: RRID:AB_10015300
RRID:AB_2313606
DOI: 10.1038/s41531-025-01244-0
Resource: (Vector Laboratories Cat# BA-1000, RRID:AB_2313606)
Curator: @scibot
SciCrunch record: RRID:AB_2313606
RRID:AB_2313606
DOI: 10.1016/j.isci.2025.114596
Resource: (Vector Laboratories Cat# BA-1000, RRID:AB_2313606)
Curator: @scibot
SciCrunch record: RRID:AB_2313606
Da capo is an Italian word found in music that is translated as “from the head/beginning”.
"Da Capo" from Italy.
Clinical significance
Suggesting I'm a low A/BNP, high Vasopressin state: hypertension, arterial vasoconstriction, concentrated urine, hypokalemia, high pair bonding, dilated cardio hypertrophy. Low eGFR. Vasopressin associates with stress. Don't sweat. Sympathetic failure. Blurry vision, intraocular control. Na excretion plus sympathetic control is required for sweating.
Vasopressin is reacting to high ECM osmolarity. Activating aquaporin channels for diH2O outflow, attempting to deconcentrate ECM interstitial spaces. Saline provides symptom improvement. Dex, B adrenergic, sympathetic activation improves symptoms. Missing ANP energy metabolic regulation?
It kind of seems vasopressin is a cell flush and rebuild (anabolic, rest and digest program) mechanism allowing high pressure free osmotic flow compensation for permissive active transport. This theoretically would suppress high frequency passive channel signaling (ion signaling, thus especially cognition) due to prevention of high substrate osmotic gradients. If so, perhaps intracellular dysregulated/infected/stress would rapidly cause a UPR/ISR, then perhaps a synucleinopathy or taupathy, which rapidly cause intracellular hyperosmolor trash build up, especially upon exertion, which quickly activate H2O influx and cognition/sympathetic shutdown, the trash and damage activate PRRs activating an amplified and prolonged immune response and high intracellular swelling, and thus prolonged and deep cognition signaling suppression (drowsy, stupor, sleep, coma). Perhaps then excessive deregulation and repair causing excess sympathetic shutdown then causes sympathetic drive failure and is causal explanation for: central sleep apnea, ataxia, reward circuit, PFC impairment, anxiety, disassociation/schizophrenia, BPD, fear, thought disorder, ocular ataxia, inability to sweat, hypothalamic-brainstem homeostatic control, POTS, immune deficiency (huge because this is your repair system)
the prevailing functional character of AfricanAmerican artistic expression renders problematic any move to divorceits production and any criticism thereof from the realm of rhetoricalinquiry
I wonder if the author has any specific artistic expressions in mind in this section.
to better understand: he is discussing how essential these two forms of rhetoric are to AA rhet as a whole "any attempt to remove them is problematic"
Beispiel Claudia: Claudia sammelt z.B. beim beruflichen Fliegen jede Menge Miles-&-More-Punkte und löst sie später für einen privaten Trip nach Lissabon ein. Da die Punkte auf ihrem persönlichen Meilenkonto gutgeschrieben und die Reisen von ihrem Arbeitgeber erstattet wurden, zieht Claudia einen privaten Vorteil aus einer beruflich veranlassten Leistung. Grundsätzlich kann dieser geldwerte Vorteil pauschal durch Dritte (z. B. die Deutsche Lufthansa) versteuert werden.
Delete "Beispiel Claudia:" instead write only "Beispiel" and then add a paragraph
Cornemuses d’Europe et de Méditerranée
La typographie des titres d'oeuvres, de documents et de publication a été uniformisé en italique.
This is evident in a distinct pattern of SST changes over the North Pacific, with intense surface warming extending across the mid- to high-latitude western Pacific surrounded by a ‘horseshoe’ pattern of minimal surface warming or cooling to the east and a weak La Niña-like pattern in the tropical Pacific (Fig. 3b).
2 things about this: (1) To me, this doesn't really look that much like the PDO. They say they get a significant correlation between it and the historical PDO so OK, sure, but I'm guessing there's a few different ways to do the test. (2) Fig 3B looks more like the positive phase of the PDO than the negative phase to me? We can pull up another image. The weird thing is that they do have a La Niña response at the veeeeery bottom margin (which would be associated with PDO-) but it's hard to tell. I think I'd need to talk to someone about what this figure is actually showing.
Reviewer #2 (Public review):
The application of rabies virus (RabV)-mediated transsynaptic tracing has been widely utilized for mapping cell-type-specific neural connectivities and examining potential modifications in response to biological phenomena or pharmacological interventions. Despite the predominant focus of studies on quantifying and analyzing labeling patterns within individual brain regions based on labeling abundance, such an approach may inadvertently overlook systemic alterations. There exists a considerable opportunity to integrate RabV tracing data with the global connectivity patterns and the transcriptomic signatures of labeled brain regions. In the present study, the authors take an important step towards achieving these objectives.
Specifically, the authors conducted an intensive reanalysis of a previously generated large dataset of RabV tracing to the ventral tegmental area (VTA) using dimension reduction methods such as PCA and UMPA. This reaffirmed the authors's earlier conclusion that different cell types in the VTA, namely dopamine neurons (DA) and GABAergic neurons, exhibit quantitatively distinct input patterns, and a single dose of addictive drugs, such as cocaine and morphine, induced altered labeling patterns. Additionally, the authors illustrate that distinct axes of PCA can discriminate experimental variations, such as minor differences in the injection site of viral tracers, from bona fide alterations in labeling patterns caused by drugs of abuse. While the specific mechanisms underlying altered labeling in most brain regions remain unclear, whether involving synaptic strength, synaptic numbers, pre-synaptic activities, or other factors, the present study underscores the efficacy of an informatics approach in extracting more comprehensive information from the RabV-based circuit mapping data.
Moreover, the authors showcased the utility of their previously devised bulk gene expression patterns inferred by the Allen Gene Expression Atlas (AGEA) and "projection portrait" derived from bulk axon mapping data sourced from the Allen Mouse Brain Connectivity Atlas. The utilization of such bulk data rests upon several limitations. For instance, the collection of axon mapping data involves an arbitrary selection of both cell type-specific and non-specific data, which might overlook crucial presynaptic partners, and often includes contamination from neighboring undesired brain regions. Concerns arise regarding the quantitativeness of AGEA, which may also include the potential oversight of key presynaptic partners. Nevertheless, the authors conscientiously acknowledged these potential limitations associated with the dataset.
Notably, building on the observation of a positive correlation between the basal expression levels of Ca2+ channels and the extent of drug-induced changes in RabV labeling patterns, the authors conducted a CRISPRi-based knockdown of a single Ca2+ channel gene. This intervention resulted in a reduction of RabV labeling, supporting that the observed gene expression patterns have causality in RabV labeling efficiency. While a more nuanced discussion is necessary for interpreting this result (see below), overall I commend the authors for their efforts to leverage the existing dataset in a more meaningful way. This endeavor has the potential to contribute significantly to our understanding of the mechanisms underlying alterations in RabV labeling induced by drugs of abuse.
Finally, drawing upon the aforementioned reanalysis of previous data, the authors underscored that a single administration of ketamine/xylazine anesthesia could induce enduring modifications in RabV labeling patterns for VTA DA neurons, specifically those projecting to the nucleus accumbens and amygdala. Given the potential impact of such alterations on motivational behaviors at a broader level, I fully agree that prudent consideration is warranted when employing ketamine/xylazine for the investigation of motivational behaviors in mice.
Comments on revisions:
In the re-revised version, the authors have addressed all of my previous comments. I no longer have any major concerns.
Author response:
The following is the authors’ response to the original reviews.
Public Reviews:
Reviewer #1(Public review):
Summary:
In this study, the authors distinguished afferent inputs to different cell populations in the VTA using dimensionality reduction approaches and found significantly distinct patterns between normal and drug treatment conditions. They also demonstrated negative correlations of the inputs induced by drugs with gene expression of ion channels or proteins involved in synaptic transmission and demonstrated the knockdown of one of the voltage-gated calcium ion channels caused decreased inputs.
Weaknesses:
(1) For quantifications of brain regions in this study, boundaries were based on the Franklin-Paxinos (FP) atlas according to previous studies (Beier KT et al 2015, Beier KT et al 2019). It has been reported significant discrepancies exist between the anatomical labels on the FP atlas and the Allen Brain Atlas (ref: Chon U et al., Nat Commun 2019). Although a summary of conversion is provided as a sheet, the authors need to describe how consistent or different the brain boundaries they defined in the manuscript with Allen Brain Atlas by adding histology images. Also, I wonder how reliable the annotations were for over a hundred of animals with manual quantification. The authors should briefly explain it rather than citing previous studies in the Material and Methods Section.
We thank the reviewer for attention to this point; indeed, neuroanatomical detail is often overlooked in modern neuroscience, occasionally leading to spurious conclusions. We acknowledge that there are significant discrepancies in brain region definitions across atlases, which can make cross-study comparisons difficult. Here, all cells were manually quantified by Dr. Kevin Beier, as in previous studies (Beier et al., Cell 2015; Nature 2017; Cell Reports 2019; Tian et al., Cell Reports 2022; Tian et al., Neuron 2024; Hubbard et al., Neuropsychopharmacology, 2025). As such, these studies are internally consistent as relates to the definition of brain regions, which is critical here since our analysis in this manuscript relates to data quantified only by a single individual. Several brain regions were quite easy to distinguish anatomically, such as the medial habenula and lateral habenula. Others, such as the extended amygdala area, are much more difficult. We have now provided example images in Figure S1 that detail the anatomical boundaries that we used, overlayed on images of Neurotrace blue (fluorescent Nissl stain).
(2) Regarding the ellipsoids in the PC, although it's written in the manuscript that "Ellipsoids were centered at the average coordinate of a condition and stretched one standard deviation along the primary and secondary axes", it's intuitively hard to understand in some figures such as Figure 2O, P and Figure S1. The authors need to make their data analysis methods more accessible by providing source code to the public.
The source code is now available to the public at https://github.com/ktbartas/Bartas_et_al_eLife_2024, which is noted in the Code Availability statement. The code for generating ellipsoids is in the first notebook, `0-dataexploration-master-euclidean.ipynb`, in the function `confidence_ellipse`, which is called from `make_pca_plots` and `umap_and_heatmap`. Example plots are all live in the notebooks as can be viewed directly from GitHub.
(3) In histology images (Figure 1B and 3K), the authors need to add dashed lines or arrows to guide the reader's attention.
Dashed lines have been added to these figure panels as requested.
(4) In Figure 2A and G, apparently there are significant differences in other brain regions such as NAcMed or PBN. If they are also statistically significant, the authors should note them as well and draw asterisks(*).
We appreciate the care in ensuring that statistics are being applied and shown appropriately. In panel A (now Figure 3A), the Two-way ANOVA interaction term was not significant (p = 0.9365), we did not find it justified to do further comparisons. However, for Figure 3G, the interaction term was significant (p = 0.0001), and thus further pairwise comparisons were performed with Sidak's correction for multiple comparisons. When done, the only two brain regions that were significantly different were the DStr (p = 0.0051) and GPe (p = 0.0036). While the NAcMed and PBN visually look different, according to the corrected statistics, they were not significantly different (NAcMed p = 0.5037, PBN p = 0.8123). The notations in our original figure thus accurately reflected these statistics.
(5) In Figure 2N about the spatial distribution of starter cells, the authors need to add histology images for each experimental condition (i.e. saline, fluoxetine, cocaine, methamphetamine, amphetamine, nicotine, and morphine) as supplement figures
We have now provided these as Figure S2.
(6) In the manuscript, it is necessary to explain why Cacna1e was selected among other calcium ion channels.
We have added a sentence to the "Functional validation of link between gene expression and RABV labeling" section (lines 722-724).
Reviewer #2 (Public review):
The application of rabies virus (RabV)-mediated transsynaptic tracing has been widely utilized for mapping celltype-specific neural connectivities and examining potential modifications in response to biological phenomena or pharmacological interventions. Despite the predominant focus of studies on quantifying and analyzing labeling patterns within individual brain regions based on labeling abundance, such an approach may inadvertently overlook systemic alterations. There exists a considerable opportunity to integrate RabV tracing data with the global connectivity patterns and the transcriptomic signatures of labeled brain regions. In the present study, the authors take an important step towards achieving these objectives. Specifically, the authors conducted an intensive reanalysis of a previously generated large dataset of RabV tracing to the ventral tegmental area (VTA) using dimension reduction methods such as PCA and UMPA. This reaffirmed the authors' earlier conclusion that different cell types in the VTA, namely dopamine neurons (DA) and GABAergic neurons, exhibit quantitatively distinct input patterns, and a single dose of addictive drugs, such as cocaine and morphine, induced altered labeling patterns. Additionally, the authors illustrate that distinct axes of PCA can discriminate experimental variations, such as minor differences in the injection site of viral tracers, from bona fide alternations in labeling patterns caused by drugs of abuse. While the specific mechanisms underlying altered labeling in most brain regions remain unclear, whether involving synaptic strength, synaptic numbers, pre-synaptic activities, or other factors, the present study underscores the efficacy of an informatics approach in extracting more comprehensive information from the RabV-based circuit mapping data. Moreover, the authors showcased the utility of their previously devised bulk gene expression patterns inferred by the Allen Gene Expression Atlas (AGEA) and "projection portrait" derived from bulk axon mapping data sourced from the Allen Mouse Brain Connectivity Atlas. The utilization of such bulk data rests upon several limitations. For instance, the collection of axon mapping data involves an arbitrary selection of both cell type-specific and non-specific data, which might overlook crucial presynaptic partners, and often includes contamination from neighboring undesired brain regions. Concerns arise regarding the quantitativeness of AGEA, which may also include the potential oversight of key presynaptic partners. Nevertheless, the authors conscientiously acknowledged these potential limitations associated with the dataset. Notably, building on the observation of a positive correlation between the basal expression levels of Ca2+ channels and the extent of drug-induced changes in RabV labeling patterns, the authors conducted a CRISPRi-based knockdown of a single Ca2+ channel gene. This intervention resulted in a reduction of RabV labeling, supporting that the observed gene expression patterns have causality in RabV labeling efficiency. While a more nuanced discussion is necessary for interpreting this result (see below), overall I commend the authors for their efforts to leverage the existing dataset in a more meaningful way. This endeavor has the potential to contribute significantly to our understanding of the mechanisms underlying alterations in RabV labeling induced by drugs of abuse. Finally, drawing upon the aforementioned reanalysis of previous data, the authors underscored that a single administration of ketamine/xylazine anesthesia could induce enduring modifications in RabV labeling patterns for VTA DA neurons, specifically those projecting to the nucleus accumbens and amygdala. Given the potential impact of such alterations on motivational behaviors at a broader level, I fully agree that prudent consideration is warranted when employing ketamine/xylazine for the investigation of motivational behaviors in mice.
Specific Points:
(1) Beyond advancements in bioinformatics, readers may find it insightful to explore whether the PCA/UMPAbased approach yields novel biological insights. For example, the authors are encouraged to discuss more functional implications of PBN and LH in the context of drugs of abuse, as their labeling abundance could elucidate the PC2 axis in Fig. 2M.
Thank you for this suggestion: we added text (Lines 787-795) discussing the LH and PBN (and GPe) specifically, but also highlighted the importance of our approach in hypothesis-generating science.
(2) While I appreciate the experimental data on Cacna1e knockdown, I am unclear about the rationale behind specifically focusing on Cacna1e. The logic behind the statement, "This means that expression of this gene is not inhibitory towards RABV transmission," is also unclear. Loss-of-function experiments only signify the necessity or permissive functions of a gene. In this context, Cacna1e expression levels are required for efficient RabV labeling, but this neither supports nor excludes the possibility that this gene expression instructively suppresses RabV labeling/transmission, which could be assessed through gain-of-function experiments.
We thank the reviewer for their suggestions regarding this result, and agree that a gain-of-function would be required to provide clearer evidence on this point. We therefore understand that our original phrasing may be misleading. Thus, we have edited this section to the more conservative statement: “These results indicate that reduced levels of Cacna1e likely lower the number of RABV-labeled inputs from the NAcLat, and directly link the levels of Cacna1e and RABV input labeling” (lines 742-744) - we refrain from over-interpreting the results. As mentioned above in response to R1, we added a sentence to explain the rationale behind focusing on Cacna1e (lines 722-724).
Reviewer #3 (Public Review):
Summary:
Authors mapped monosynaptic inputs to dopamine, GABA, and glutamate neurons in VTA under different anesthesia methods, and under drugs (cocaine, morphine, methamphetamine, amphetamine, nicotine, fluoxetine). They found that input patterns under different conditions are separated, and identified some key brain areas to contribute to such separation. They also searched a database for gene expression patterns that are common across input brain areas with some changes by anesthesia or drug administration.
Strengths:
The whole-brain approach to address drug effects is appealing and their conclusion is clear. The methodology and motivation are clearly explained.
Weaknesses:
While gene expression analyses may not be related to their findings on the anatomical effects of drugs, this will be a nice starting point for follow-up studies.
We understand and agree with the suggestion that gene expression allows us to provide correlative observations between in situ hybridization datasets and rabies mapping datasets, and that these results do not show causality. As such, future studies would be needed to assess this in more detail. We have added a line in the discussion to this effect (lines 851-853).
Recommendations for the authors:
Reviewer #1 (Recommendations for the authors):
Recommendations for improving the writing and presentation:
(1) There are a couple of packages available for 3D whole-brain reconstructions based on Allen Brain Atlas (eg. https://github.com/tractatus/wholebrain, https://github.com/lahammond/BrainJ), which would be helpful to align with the gene expression or other data from Allen Institute.
This comment is related to the noted weakness we responded to previously in this rebuttal also from R1 (see comment 1), about the discrepancies between the Franklin-Paxinos atlas and Allen Brain atlas. We agree that a systematic comparison of these two atlases using a tool like wholebrain or BrainJ would be valuable for the field. However, it would be a substantial amount of work, and likely would be an independent study in itself. We believe that the resolution of these atlases was sufficient to make our key conclusions here (e.g., identify gene expression patterns that relate to drug-induced changes rabies virus labeling patterns, and develop a testable hypothesis for CRISPR-based gene editing). They are also based on the same atlases and region definitions that have been applied in our previous studies (e.g., Beier et al., Cell 2015; Beier et al., Nature 2017; Beier et al., Cell Reports 2019; Tian et al., Cell Reports 2022; Tian et al., Neuron 2024; Hubbard et al., Neuropsychophamacology 2025, etc.) The expression of Cacna1e is relatively consistent across the NAc, as we have now detailed in Figure S13.
(2) There are so far two kinds of rabies virus strains available in the neuroscience field (SAD-B19 or CVS-N2c). It is recommended to describe which strain was used in the Material and Methods Section because labeling efficiency and toxicity is quite different between the strains (Reardon TR et al., Neuron 2016).
We have now noted that we used SAD B19 for all experiments (Lines 141-142).
Minor corrections to the text and figures:
(1) In Figure 1A, the color differences are not clear (i.e. light gray and dark gray). The figure can be simplified.
In addition, generally, images/figures are recommended not to be overlapped with other figures/images (Figures 2A-F, 2G-L).
(2) In Figures 7C and D, the authors could add enlarged views of starter cells in VTA and NAcLat.
We have attempted to simplify schematics and figures throughout. High-magnification images of cells have been added as insets in what is now Figure 10 (formerly Figure 7).
Reviewer #2 (Recommendations For the authors):
The number of animals for each graph should be explicated within the figure legend. For example, Figure 1C and Figure 7E lack this information. It is also advisable to delineate the definition of error bars within the figure legend.
We have now added mouse numbers to all figures and/or legends, as appropriate. We also indicated in the legend at the end of Figure 1 how error bars and asterisks are defined. Furthermore, we added a sentence to the methods saying that in UMAP and PCA plots each dot is an animal (lines 244-245).
The visual representations, particularly in Figures 1 and 3, are overcrowding. Furthermore, the arrangement of figure subpanels does not consistently adhere to the sequence of explication in the main text, significantly compromising the readability of the text. The authors are encouraged to consider the possibility of segmenting dense figures into two if there exists no upper limit for the number of figure displays. To illustrate, in Figure 3Q, crucial details about experimental conditions are denoted by numerical references, owing to spatial constraints.
We agree that the figure layout and mis-alignment with a linear read of the text was unideal. Therefore, we broke our figures, especially the original Figures 1-4, into multiple sub-figures, including both main and supplemental figures. This facilitated the use of space to rearrange the figure panels, allowing the story to be told in a linear fashion. All figures and panels should now be read in order.
I am seeking clarification on how to interpret the term "overlap" at the bottom of figures illustrating Gene Ontology analysis.
We have clarified the meaning of overlap in this context (lines 324-325): The ‘overlap’ term on the x-axis of these plots means the number of genes in the correlated gene lists that were also within the list of genes for the corresponding GO term.
The authors could provide Cacna1e gene expression patterns within the NAc from the AGEA data.
Cacna1e expression data are now provided in Figure S13.
Additionally, the meaning of "controls" in Figure 7F, along with the "No gRNA" condition, remains ambiguous. While the text mentions "no shRNA", the involvement of shRNA in this experiment lacks clarity.
We now clarify that the control conditions are based on previously published data where no AAVs were injected into NAcLat. This is now clarified in the legend for Figure 10F (lines 1277-1578). We also corrected “shRNA” to “gRNA” in the text.
Author response:
The following is the authors’ response to the original reviews
We appreciate the reviewers’ insightful comments. In response, we conducted three new experiments, summarized in Author response table 1. After the table, we provide detailed responses to each comment.
Author response table 1.
Summary of new experiments and results.
Reviewer #1 (Public review):
The authors show that corticotropin-releasing factor (CRF) neurons in the central amygdala (CeA) and bed nucleus of the stria terminalis (BNST) monosynaptically target cholinergic interneurons (CINs) in the dorsal striatum of rodents. Functionally, activation of CRFR1 receptors increases CIN firing rate, and this modulation was reduced by pre-exposure to ethanol. This is an interesting finding, with potential significance for alcohol use disorders, but some conclusions could use additional support.
Strengths:
Well-conceived circuit mapping experiments identify a novel pathway by which the CeA and BNST can modulate dorsal striatal function by controlling cholinergic tone. Important insight into how CRF, a neuropeptide that is important in mediating aspects of stress, affective/motivational processes, and drug-seeking, modulates dorsal striatal function.
Weaknesses:
(1) Tracing and expression experiments were performed both in mice and rats (in a mostly nonoverlapping way). While these species are similar in many ways, some conclusions are based on assumptions of similarities that the presented data do not directly show. In most cases, this should be addressed in the text (but see point number 2).
In the revised manuscript, we have clarified this limitation in the first paragraph of the Methods and the third paragraph of the Discussion and avoid cross-species claims, limiting our conclusions to the species in which each assay was performed. Specifically, we now state that while mice and rats share many conserved amygdalostriatal components, our tracing and expression studies were performed in a species-specific manner, and direct cross-species comparisons of CRF–CIN connectivity and CRFR1 expression were not assessed. We further note that future studies will be needed to determine the extent to which these observations are conserved across species as more tools become available.
(2) Experiments in rats show that CRFR1 expression is largely confined to a subpopulation of striatal CINs. Is this true in mice, too? Since most electrophysiological experiments are done in various synaptic antagonists and/or TTX, it does not affect the interpretation of those data, but non-CIN expression of CRFR1 could potentially have a large impact on bath CRF-induced acetylcholine release.
To address whether CRFR1 expression in striatal CINs is conserved across species, we performed new histological experiments using CRFR1-GFP mice. Striatal sections were immunostained with anti-ChAT, and we found that approximately 10% of CINs express CRFR1 (new Fig. 4D, 4E). This result indicates that, similar to rats, a subset of CINs in mice express CRFR1. However, the proportion of CRFR1<sup>+</sup> CINs is lower than the proportion of CRF-responsive CINs observed during electrophysiology experiments, suggesting that CRF may also modulate CIN activity indirectly through network or synaptic mechanisms. We have also noted in the revised Discussion that while CRFR1 expression is confirmed in a subset of CINs, the broader distribution of CRFR1 among other striatal cell types remains to be determined (third paragraph of Discussion).
In our study, bath application of CRF increased striatal ACh release. Because striatal ACh is released primarily from CINs, and CRFR1 is an excitatory receptor, this effect is most likely mediated by CRF activation of CRFR1 on CINs, leading to enhanced CIN activity and ACh release. Although CRFR1 may also be expressed on other striatal neurons, these cell types—medium spiny neurons and GABAergic interneurons—are inhibitory. If CRF were to activate CRFR1 on these GABAergic neurons, the resulting increase in GABA release would suppress CIN activity and consequently reduce, rather than enhance, ACh release. Given that most CINs responded functionally while only a small subset expressed CRFR1, these findings imply that indirect mechanisms, such as CRF modulation of local circuits influencing CIN excitability, may also contribute to the observed increase in ACh release. Together, these data support a model in which CRF primarily enhances ACh release via activation of CRFR1-expressing CINs, while indirect network effects may further amplify this response.
(3) Experiments in rats show that about 30% of CINs express CRFR1 in rats. Did only a similar percentage of CINs in mice respond to bath application of CRF? The effect sizes and error bars in Figure 5 imply that the majority of recorded CINs likely responded. Were exclusion criteria used in these experiments?
We thank the reviewer for this insightful question. In our mouse cell-attached recordings, ~80% of CINs increased firing during CRF bath application, and all recorded cells were included in the analysis (no exclusions based on response direction/magnitude; cells were only required to meet standard recording-quality criteria such as stable baseline firing and seal).
Using a CRFR1-GFP reporter mouse, we found that ~10% of striatal CINs are GFP+, suggesting that the high proportion of CRF-responsive CINs cannot be explained solely by somatic reporter-labeled CRFR1 expression. Importantly, the CRF-induced increase in CIN firing is blocked by the selective CRFR1 antagonist NBI 35695 (Fig. 5B–C), supporting a CRFR1-dependent mechanism at the circuit level. We now discuss several non-mutually exclusive explanations for this apparent discrepancy: (i) reporter lines (e.g., CRFR1-GFP) may underestimate functional CRFR1 expression, particularly for low-level or compartmentalized receptor pools; (ii) bath-applied CRF may act indirectly via CRFR1 on presynaptic afferents, thereby enhancing excitatory drive onto CINs; and (iii) electrical coupling among CINs could allow direct effects in a subset of CINs to propagate through the CIN network (Ren, Liu et al. 2021). We added this discussion to the revised manuscript (fourth paragraph of the Discussion).
(4) The conclusion that prior acute alcohol exposure reduces the ability of subsequent alcohol exposure to suppress CIN activity in the presence of CRF may be a bit overstated. In Figure 6D (no ethanol preexposure), ethanol does not fully suppress CIN firing rate to baseline after CRF exposure. The attenuated effect of CRF on CIN firing rate after ethanol pre-treatment (6E) may just reduce the maximum potential effect that ethanol can have on firing rate after CRF, due to a lowered starting point. It is possible that the lack of significant effect of ethanol after CRF in pre-treated mice is an issue of experimental sensitivity. Related to this point, does pre-treatment with ethanol reduce the later CIN response to acute ethanol application (in the absence of CRF)?
In the revised manuscript, we have tempered our interpretation in the final Results section and throughout the Discussion to emphasize that ethanol pre-exposure attenuates, rather than abolishes, the CRFinduced increase in CIN firing. We also note the reviewer’s important point that in Figure 6D, ethanol does not fully suppress firing to baseline after CRF exposure, consistent with a partial effect. Regarding the reviewer’s question, our experiments were specifically designed to test interactions between CRF and ethanol, so we did not assess whether ethanol pre-treatment alters subsequent responses to ethanol alone. We now explicitly acknowledge CRF-dependent and CRF-independent effects of ethanol on CIN activity as an important point for future studies to disentangle (sixth paragraph of the Discussion). For example, comparing ethanol responses with and without prior ethanol without any treatment with CRF could resolve this question.
(5) More details about the area of the dorsal striatum being examined would be helpful (i.e., a-p axis).
We now provide more detail regarding the anterior–posterior axis of the dorsal striatum examined. Most recordings and imaging were performed in the posterior dorsomedial striatum (pDMS), corresponding to coronal slices posterior to the crossing of the anterior commissure and anterior to the tail of the striatum (starting around 0.62 mm and ending at −1.3 mm relative to the Bregma). While our primary focus was on posterior slices, some anterior slices were included to increase the sample size. These details have been added to the Methods (Last sentence of the ‘Histology and cell counting’ section and of the ‘Slice electrophysiology’ section).
Reviewer #2 (Public review):
Essoh and colleagues present a thorough and elegant study identifying the central amygdala and BNST as key sources of CRF input to the dorsal striatum. Using monosynaptic rabies tracing and electrophysiology, they show direct connections to cholinergic interneurons. The study builds on previous findings that CRF increases CIN firing, extending them by measuring acetylcholine levels in slices and applying optogenetic stimulation of CRF+ fibers. It also uncovers a novel interaction between alcohol and CRF signaling in the striatum, likely to spark significant interest and future research.
Strengths:
A key strength is the integration of anatomical and functional approaches to demonstrate these projections and assess their impact on target cells, striatal cholinergic interneurons.
Weaknesses:
(1) The nature of the interaction between alcohol and CRF actions on cholinergic neurons remains unclear. Also, further clarification of the ACh sensor used and others is required
We have clarified the nature of the interaction between alcohol and CRF signaling in CINs and have provided additional details regarding the acetylcholine sensor used. These issues are addressed in detail in our responses to the specific comments below.
Reviewer #2 (Recommendations for the authors):
(1) The interaction between the effects of alcohol and CRF is a novel and important part of this study. When considering possible mechanisms underlying the findings in the discussion, there is no mention of occlusion. Given that incubation with alcohol produced a similar increase in firing of CINs as CRF, occlusion could be a parsimonious explanation for the observed interaction. Have the author considered blocking the effects of alcohol on CIN with CRF-R1 antagonist? Another experiment that could address the occlusion would be to test if alcohol also increases ACh levels as it did CRF.
We thank the reviewer for proposing occlusion as a potential mechanism underlying the interaction between alcohol and CRF. We agree that, in principle, alcohol-induced endogenous CRF release could occlude subsequent exogenous CRF-mediated potentiation of CIN firing, and we carefully considered this possibility.
However, several observations from our data argue against occlusion driven by acute alcohol exposure or withdrawal in this preparation. First, as shown in Fig. 6A, bath application of alcohol transiently reduced CIN firing, and firing recovered to baseline levels after washout without any rebound increase. Second, in Fig. 6D–E, the baseline firing rates under control conditions and following alcohol pretreatment were comparable, indicating that acute alcohol exposure and short-term withdrawal did not produce a sustained increase in CIN excitability. Together, these results suggest that acute withdrawal in slices is less likely to trigger substantial endogenous CRF release capable of occluding subsequent exogenous CRF effects.
While we and others have previously reported increased spontaneous CIN firing following prolonged in vivo alcohol exposure and extended withdrawal periods (e.g., 21 days), short-term withdrawal (e.g., 1 day) does not robustly alter baseline CIN firing (Ma, Huang et al. 2021, Huang, Chen et al. 2024). Consistent with these prior findings, the absence of a rebound or elevated baseline firing in the present slice experiments discouraged further pursuit of an endogenous CRF occlusion mechanism under acute conditions.
We also considered experimentally testing occlusion by blocking CRFR1 signaling during alcohol pre-treatment. However, this approach is technically challenging in slice recordings, as CRFR1 antagonists require prolonged incubation (~1 hour) during alcohol exposure. Because it is unclear whether endogenous CRF release is triggered by alcohol incubation itself or by withdrawal, the antagonist would need to remain present throughout both the incubation and withdrawal periods. This leaves insufficient time for complete washout of the CRFR1 antagonist prior to subsequent bath application of exogenous CRF to assess its effects on CIN firing. Consequently, residual antagonist presence would confound the interpretation of the exogenous CRF response.
Finally, regarding the possibility that alcohol increases acetylcholine release, we did not observe alcohol-induced increases in CIN firing in slices, arguing against elevated ACh signaling under these conditions. Consistent with prior work (Ma, Huang et al. 2021, Huang, Chen et al. 2024), alcohol-induced increases in CIN excitability and cholinergic signaling appear to depend on prolonged in vivo exposure and extended withdrawal rather than acute slice-level manipulations.
We have now incorporated discussion of occlusion as a potential mechanism (seventh paragraph) and clarified why our data and technical considerations argue against it in the present study. We thank the reviewer for this wonderful suggestion, which we will test in future in vivo studies.
(2) Retrograde monosynaptic tracing of inputs to CIN. Results state the finding of labeling in all previously reported area..." Can the authors report these areas? A list in the text or a bar plot, if there is quantification, will suffice. This formation will serve as important validation and replication of previous findings.
We thank the reviewer for this constructive suggestion. We agree that summarizing the anatomical sources of CIN input provides important validation of our tracing results. In the revised Results, we now list the major input regions observed, including the striatum itself, cortex (e.g., cingulate cortex, motor cortex, somatosensory cortex), thalamus (e.g., parafascicular thalamic nucleus, centrolateral thalamic nucleus), globus pallidus, and midbrain (first paragraph of the Results). Quantitative analysis of relative input strength will be presented in a separate study that expands on these findings. Here, we limit the current manuscript to the functional characterization of CRF and alcohol modulation of CINs.
(3) Given the difference in connectivity among striatal subregions, it would be important to describe in more detail the injection site in the results and figures. In the figure, for example, you might want to include the AP coordinates, given that it is such a zoomed-in image, it is hard to tell how anterior/posterior the site is. I imagine that the picture is a representative image of the injection site, but maybe having a side image with overlay of injection sites in all the animals used, would help.
The anterior–posterior (AP) coordinates for representative images have been included in the panels and reiterated more clearly in the revised Results section and figure legends. In the legend for Figure 3B, a list of AP coordinates for each animal used for Figure 3A-3E has been added.
(4) Figure 1D inset, there seem to be some double-labeled cells in the zoomed in BNST images. The authors might want to comment on this. It seemed far from the injection site. Do D1-MSN so far away show connectivity to CINs?
Upon closer inspection of the BNST images, we noted a small number of double-labeled cells were indeed present, consistent with prior reports that a subset of D1R-expressing neurons (~10%) has been reported previously in our lab in the BNST, with the majority being D2R-expressing neurons (Lu, Cheng et al. 2021). Given the BNST’s anatomical proximity to the dorsal striatum, it is plausible that some D1Rexpressing neurons in this region provide monosynaptic input to CINs, highlighting a potential ventral-to-dorsal connection that merits further study.
(5) Can the author provide quantification of the onset delay of the optogenetic evoked CRF+ axon responses onto CINs? The claim of monosynaptic connectivity is well supported by the TTX/4AP experiment but additional information on the timing will strengthen that conclusion.
We thank the reviewer for this insightful suggestion. Quantifying the onset latency of optogenetically evoked CRFMsup+</sup> axon responses onto CINs provides valuable confirmation of monosynaptic connectivity. To address this, we performed new latency measurements under the same recording conditions as the TTX/4-AP experiments. The average onset latency from the start of the optical stimulation was 5.85 ± 0.37 ms (new Figure 3J), consistent with direct monosynaptic transmission.
As an additional reference, we analyzed latency data from a separate project in which we optogenetically stimulated cholinergic interneurons and recorded synaptic responses in medium spiny neurons. This circuit, known to involve disynaptic transmission from CINs to MSNs via nAChR-expressing interneurons (Autor response image 1) (English, Ibanez-Sandoval et al. 2011), exhibited a significantly longer latency (18.34 ± 0.70 ms; t<sub>(29)</sub> = 10.3, p < 0.001) compared to CRF⁺ CeA/BNST inputs to CINs (5.85 ± 0.37 ms). Together, these results further support that CRF⁺ axons form direct functional synapses onto CINs.
Author response image 1.
Latency of disynaptic transmission from CINs to MSNs via interneurons A) Schematic illustrating optogenetic stimulation of Chrimson-expressing CINs, leading to excitation of nAChRexpressing interneurons that release GABA onto recorded MSNs. B) Sample trace of disynaptic transmission (left) and bar graph summarizing onset latency (right) from light stimulation to synaptic response onset (n = 23 neurons from 3 mice).
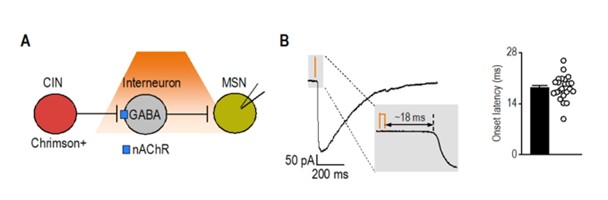
(6) The ACh sensor reported is "AAV-GRABACh4m" but the reference is for GRAB-ACh3.0. Also, BrainVTA has GRAB-ACh4.3. Is this the vector? Could you please check the name of the construct and report the corresponding reference, as well as clarify the meaning of the additional "m". They have a mutant version of the GRAB-ACH that researchers use for control, and of course, you want to use it as a control, but not for the test experiment.
GRAB-ACh4m is the correct acetylcholine sensor used in this study. The ACh4 series (including ACh4h, ACh4m, and ACh4l; personal communication with Dr. Yulong Li’s lab) represents an updated generation following GRAB-ACh3.0. Although the ACh4 family has not yet been formally published, these constructs are publicly available through BrainVTA (https://www.brainvta.tech/plus/view.php?aid=2680).
The suffix “m” does not indicate a mutant control; rather, it denotes a medium-affinity variant within the ACh4 sensor family. Importantly, the mutant (non-responsive) control sensor is only available for GRAB-ACh3.0 (ACh3.0mut) and does not exist for the ACh4 series.
Our laboratory has previously used GRAB-ACh4m in multiple peer-reviewed publications (Huang, Chen et al. 2024, Gangal, Iannucci et al. 2025, Purvines, Gangal et al. 2025), and its use has also been reported by independent groups in recent preprints (Potjer, Wu et al. 2025, Touponse, Pomrenze et al. 2025). We have now clarified the construct name, its relationship to GRAB-ACh3.0, in the Methods ‘Reagents’ section, and we have corrected the reference accordingly.
(7) Are CRF-R1+ CINs equally abundant in the DMS and DLS? From the image in Figure 4, it seems that a larger percentage of CINs are CRFR1+ in the DLS than in DMS. Is this true? The authors probably already have this data, or it should be easy to get, and it could be additional information that was not studied before.
We did not perform a quantitative comparison of CRFR1+ CIN abundance between the DMS and DLS in the present study. While the representative images in Figure 4 may appear to suggest regional differences, these panels were selected to illustrate labeling quality rather than relative density and should not be interpreted as evidence of unequal distribution. We have clarified this point in the revised Discussion (last sentence of the third paragraph) and note that future studies will be needed to systematically evaluate potential regional differences in CRFR1 expression, which could have important implications for dorsal striatal function.
(8) The manuscript states several times that there are no CRF+ neurons in the dorsal striatum. At the same time, there are reports of the CRF+ neuron in the ventral striatum and its role in learning. Could the authors include mention of the studies by the Lemos group (10.1016/j.biopsych.2024.08.006)
We have revised the Discussion section to clarify that our findings pertain specifically to the dorsal striatum and now acknowledge the presence and functional relevance of CRF+ neurons in the ventral striatum, citing the Lemos group’s study (fifth paragraph of the Discussion).
(9) For the histology analysis, please express cell counts as "density", not just number of cells, by providing an area (e.g., "number of cell/ µm2").
In the revised manuscript, all histological outcomes have been recalculated as cell density (cells/mm<sup>2</sup>) by normalizing raw cell counts to the measured area of each region of interest (ROI). Figures that previously displayed absolute counts now present densities (cells/mm<sup>2</sup>), with corresponding updates made to figure legends and text. We note one exception in Figure 4B, where the comparison between the total number of CINs and CRFR1+ CINs is best represented as cell counts rather than normalized values, as the counting was conducted in the same area (within the same ROI) of the dorsostriatal subregion.
(10) Figure 2C, we can see there are some labeled fibers in the striatum cut. Would it be possible to get a better confocal image?
Figure 2C has been replaced with a higher-quality confocal image captured at the same magnification and scale. The updated image provides improved clarity and resolution, ensuring accurate visualization of labeled CRF+ fibers, but not cell bodies, within the striatum.
(11) The ACh measurements in the slice are very informative and an important addition. I first thought that these experiments with the GRAB-ACh sensor were performed in ChAT-eGFP mice. After reading more carefully, I realized they were done in wild-type mice. Would you include the wildtype label in the figure as well? The ChATeGFP BAC transgenic line was reported to have enhanced ACh packaging and increased ACh release, which could have magnified the signals. So, it is important to highlight the experiments were done in wildtype mice.
We now label with ‘WT mice’ and note in the legend that all GRAB-ACh experiments were performed in wild-type mice, not ChAT-eGFP, to avoid confounds in ACh release. We thank the reviewer for this important suggestion.
Reviewer #3 (Public review):
The authors demonstrate that CRF neurons in the extended amygdala form GABAergic synapses onto cholinergic interneurons and that CRF can excite these neurons. The evidence is strong, however, the authors fail to make a compelling connection showing CRF released from these extended amygdala neurons is mediating any of these effects. Further, they show that acute alcohol appears to modulate this action, although the effect size is not particularly robust.
Strengths:
This is an exciting connection from the extended amygdala to the striatum that provides a new direction for how these regions can modulate behavior. The work is rigorous and well done.
Weaknesses:
(1) While the authors show that opto stim of these neurons can increase firing, this is not shown to be CRFR1 dependent. In addition, the effects of acute ethanol are not particularly robust or rigorously evaluated. Further, the opto stim experiments are conducted in an Ai32 mouse, so it is impossible to determine if that is from CEA and BNST, vs. another population of CRF-containing neurons. This is an important caveat.
We added recordings with the CRFR1 antagonist antalarmin. Light-evoked increases in CIN firing were abolished under CRFR1 blockade, linking the effect to CRFR1 (Figure 5J, 5K). We also clarify that CRFCre;Ai32 does not isolate CeA versus BNST sources, so we temper regional claims and highlight this as a limitation. The acute ethanol effects are modest but consistent; we expanded the discussion of dose and preparation constraints in acute slice physiology and note that in vivo studies will be needed to define the network-level impact.
Reviewer #3 (Recommendations for the authors):
(1) The authors could bring some of this data together by examining CRFR1 dependence of optical stimulationinduced increases in firing. Further, the authors have devoted significant effort to exploring how the BNST and CEA project to the CIN, yet their ephys does not explore site-specific infusion of ChR2 into either region. How are we to be sure it is not some other population of CRF neurons mediating this effect? The alcohol data does not appear particularly robust, but I think if the authors wanted to, they could explore other concentrations. Mostly I think it is important to discuss the limitations of acute alcohol on 5a brain slice.
We thank the reviewer for these thoughtful comments, which helped us strengthen the mechanistic interpretation of the CRF-CIN interaction. In the revised manuscript, we have addressed each point as follows:
- CRFR1 dependence of optogenetically evoked responses: We performed new recordings in which optogenetic stimulation of CRF⁺ terminals in the dorsal striatum was conducted in the presence of the CRFR1 antagonist antalarmin. The increase in CIN firing evoked by light stimulation was abolished under CRFR1 blockade, confirming that this effect is mediated through CRFR1 activation (new Figure 5J, 5K, third paragraph of the corresponding Result section). These results directly link the functional effects of CRF⁺ terminal activation to CRFR1 signaling on CINs.
- CeA vs. BNST projection specificity: The reviewer is correct that CeA and BNST projections were not analyzed separately. As unknown pathways, our experiment was designed to first establish the monosynaptic connections between CeA/BNST CRF neurons to striatal CINs. Future studies would further explore the specific contribution of each site. However, our data exclude the possibility of other CRF neurons as we selectively infused Cre-dependent opsins into both CeA and BNST of CRF-Cre mice (Figure 3G-3J).
- Limitations of acute slice experiments: We have expanded the Discussion (sixth paragraph) to acknowledge that acute slice physiology cannot fully capture the dynamic and network-level effects of ethanol observed in vivo. While this preparation enables mechanistic precision, factors such as washout, diffusion constraints, and the absence of systemic feedback may underestimate ethanol’s impact on CINs. We now explicitly note this limitation and highlight the need for in vivo studies to examine behavioral and circuit-level implications of CRF–alcohol interactions.
Collectively, these revisions clarify the CRFR1 dependence of CRF<sup>+</sup> terminal effects and reaffirm that both CeA and BNST projections contribute to CIN modulation while addressing the methodological limitations of the slice preparation.
Reviewer #4 Public Review):
This manuscript presents a compelling and methodologically rigorous investigation into how corticotropin-releasing factor (CRF) modulates cholinergic interneurons (CINs) in the dorsal striatum - a brain region central to cognitive flexibility and action selection-and how this circuit is disrupted by alcohol exposure. Through an integrated series of anatomical, optogenetic, electrophysiological, and imaging experiments, the authors uncover a previously uncharacterized CRF⁺ projection from the central amygdala (CeA) and bed nucleus of the stria terminalis (BNST) to dorsal striatal CINs.
Strengths:
Key strengths of the study include the use of state-of-the-art monosynaptic rabies tracing, CRF-Cre transgenic models, CRFR1 reporter lines, and functional validation of synaptic connectivity and neurotransmitter release. The finding that CRF enhances CIN excitability and acetylcholine (ACh) release via CRFR1, and that this effect is attenuated by acute alcohol exposure and withdrawal, provides important mechanistic insight into how stress and alcohol interact to impair striatal function. These results position CRF signaling in CINs as a novel contributor to alcohol use disorder (AUD) pathophysiology, with implications for relapse vulnerability and cognitive inflexibility associated with chronic alcohol intake. The study is well-structured, with a clear rationale, thorough methodology, and logical progression of results. The discussion effectively contextualizes the findings within broader addiction neuroscience literature and suggests meaningful future directions, including therapeutic targeting of CRFR1 signaling in the dorsal striatum.
Weaknesses:
(1) Minor areas for improvement include occasional redundancy in phrasing, slightly overlong descriptions in the abstract and significance sections, and a need for more concise language in some places. Nevertheless, these do not detract from the manuscript's overall quality or impact. Overall, this is a highly valuable contribution to the fields of addiction neuroscience and striatal circuit function, offering novel insights into stress-alcohol interactions at the cellular and circuit level, which requires minor editorial revisions.
We have streamlined the abstract and significance statement, reduced redundancy, and improved conciseness throughout the text. We appreciate the reviewer’s feedback, which has helped us further strengthen the clarity and readability of the manuscript.
Reviewer #4 (Recommendations for the authors):
(1) Line 29-30: Slightly verbose. Consider: "Alcohol relapse is associated with corticotropin-releasing factor (CRF) signaling and altered reward pathway function, though the precise mechanisms are unclear."
The sentence has been revised as recommended to improve clarity and conciseness in the introductory section (Lines 31-32).
(2) Lines 39-43: Good synthesis, but could better emphasize the novelty of identifying a CRF-CIN pathway.
The abstract has been revised to more clearly emphasize the novelty of identifying a CRF-CIN pathway and its functional significance (Line 42-43).
(3) Lines 66-68: Consider integrating clinical relevance more directly, e.g., "AUD affects over 14 million adults in the U.S., with relapse often triggered by stress...".
The introduction has been revised to more directly emphasize the clinical relevance of alcohol use disorder, including its high prevalence and the role of stress in relapse, thereby underscoring the translational significance of our findings (Lines 68-69).
(4) Line 83: Repetition of "goal-directed learning, habit formation, and behavioral flexibility" appears multiple times; consider variety.
We have varied the phrasing in the Introduction to avoid redundancy. Specifically, in place of repeating “goal-directed learning, habit formation, and behavioral flexibility,” we now use alternative terms such as “action selection,” “habitual responding,” and “cognitive flexibility,” depending on the context.
(5) Lines 107-116: Clarify why both rats and mice were used-do they serve different experimental purposes?
We now explain that each species was used for complementary experimental purposes. Rats were used for histological validation of CRFR1 expression using the CRFR1-Cre-tdTomato line, which has been extensively characterized in this species. Mice were used for the majority of electrophysiological, optogenetic, and GRAB-ACh sensor experiments due to the availability of well-established transgenic CRF-Cre-driver lines. This division allowed us to leverage the most appropriate tools in each species to address different aspects of the study. We have clarified this rationale in the Methods (first paragraph of the “Animals” section) and Discussion (third paragraph).
(6) Electrophysiology section: The distinction between acute exposure vs. withdrawal could be further emphasized.
To better highlight the distinction between acute alcohol exposure and withdrawal, we have clarified the timing and context of each condition within the Results section for Figure 6. Specifically, we now distinguish the immediate suppressive effects of alcohol observed during bath application (acute exposure) from the subsequent changes in CIN firing measured after washout (withdrawal). These revisions clarify the temporal dynamics and functional implications of CRF–alcohol interactions in our experimental design.
(7) Lines 227-229: Reword for clarity: "Significantly more BNST neurons projected to CINs compared to the CeA...".
The sentence has been reworded to clarify as recommended (Lines 247-248).
(8) Lines 373-374: Consider connecting the CRF-CIN circuit to behavioral inflexibility in AUD more directly.
We have modified the sentence (Lines 390-395) to more explicitly link alcohol-induced dysregulation of the CRF–CIN circuit to behavioral inflexibility in AUD, consistent with the established role of CINs in action selection and cognitive flexibility.
(9) Lines 387-389: This is an excellent point about stress resilience; consider expanding with examples or potential implications.
We thank the reviewer for this insightful suggestion. In the revised Discussion (sixth paragraph), we expanded this section to more directly connect alcohol-induced disruption of CRF–CIN signaling with impaired stress resilience and behavioral inflexibility. Specifically, we now note that such dysregulation may compromise stress resilience mechanisms mediated by CRF–cholinergic interactions in the striatum and related corticostriatal circuits. We further discuss how impaired CIN responsiveness could blunt adaptive behavioral adjustments under stress, biasing animals toward habitual or compulsive alcohol seeking. This addition highlights the broader implication that alcohol-induced alterations in CRF–CIN signaling may contribute to relapse vulnerability by undermining adaptive stress coping.
References
English, D. F., O. Ibanez-Sandoval, E. Stark, F. Tecuapetla, G. Buzsaki, K. Deisseroth, J. M. Tepper and T. Koos (2011). "GABAergic circuits mediate the reinforcement-related signals of striatal cholinergic interneurons." Nat Neurosci 15(1): 123–130.
Gangal, H., J. Iannucci, Y. Huang, R. Chen, W. Purvines, W. T. Davis, A. Rivera, G. Johnson, X. Xie, S. Mukherjee, V. Vierkant, K. Mims, K. O'Neill, X. Wang, L. A. Shapiro and J. Wang (2025). "Traumatic brain injury exacerbates alcohol consumption and neuroinflammation with decline in cognition and cholinergic activity." Transl Psychiatry 15(1): 403.
Huang, Z., R. Chen, M. Ho, X. Xie, H. Gangal, X. Wang and J. Wang (2024). "Dynamic responses of striatal cholinergic interneurons control behavioral flexibility." Sci Adv 10(51): eadn2446.
Lu, J. Y., Y. F. Cheng, X. Y. Xie, K. Woodson, J. Bonifacio, E. Disney, B. Barbee, X. H. Wang, M. Zaidi and J. Wang (2021). "Whole-Brain Mapping of Direct Inputs to Dopamine D1 and D2 Receptor-Expressing Medium Spiny Neurons in the Posterior Dorsomedial Striatum." Eneuro 8(1).
Ma, T., Z. Huang, X. Xie, Y. Cheng, X. Zhuang, M. J. Childs, H. Gangal, X. Wang, L. N. Smith, R. J. Smith, Y. Zhou and J. Wang (2021). "Chronic alcohol drinking persistently suppresses thalamostriatal excitation of cholinergic neurons to impair cognitive flexibility." J Clin Invest 132(4): e154969.
Potjer, E. V., X. Wu, A. N. Kane and J. G. Parker (2025). "Parkinsonian striatal acetylcholine dynamics are refractory to L-DOPA treatment." bioRxiv.
Purvines, W., H. Gangal, X. Xie, J. Ramos, X. Wang, R. Miranda and J. Wang (2025). "Perinatal and prenatal alcohol exposure impairs striatal cholinergic function and cognitive flexibility in adult offspring." Neuropharmacology 279: 110627.
Ren, Y., Y. Liu and M. Luo (2021). "Gap Junctions Between Striatal D1 Neurons and Cholinergic Interneurons." Front Cell Neurosci 15: 674399.
Touponse, G. C., M. B. Pomrenze, T. Yassine, V. Mehta, N. Denomme, Z. Zhang, R. C. Malenka and N. Eshel (2025). "Cholinergic modulation of dopamine release drives effortful behavior." bioRxiv.
ERC-4337
First ERC for the implementation of AA. Introduced, UserOperations to handle txns differentlt. transactions, are first kept in a high-level mempopl, tehn packaged as a sinlge classic transaction, this process is known as bundling, anthe bundler, takes the txns, and proposes a bloc.
it also brought about the concept of paymaster, which allows other bodies to pay for users's gas, and also made room for payment, that are not with native tokens, like paying for gas with solana
Headline somewhat misleading, mostly covers that CapGemini is selling their US branch that works for ICE where bonuses directly correlate with immigrants located and detained. They're not ditching doing business with ICE, they're selling it to the next bidder who by def has no qualms doing business with ICE. And it remains to be seen how fast this sale will happen if at all. A few other examples that are smaller, like office leases. IBM-style behaviour still the norm imo. Vgl [[Comment le groupe français Capgemini aide la police fédérale américaine ICE à localiser les migrants]]
2026-ban kapott friss doksit tettük be UG-ba. Ezért nem lett validálva.
2026-ban kapott friss doksit tettük be UG-ba. Ezért nem lett validálva.
2025-ben kapott friss doksit tettük be UG-ba. Ezért nem lett validálva.
2025-ben kapott friss doksit tettük be UG-ba. Ezért nem lett validálva.
Mirlo is a platform a la Bandcamp
RRID:AB_2313606
DOI: 10.64898/2026.01.26.701850
Resource: (Vector Laboratories Cat# BA-1000, RRID:AB_2313606)
Curator: @scibot
SciCrunch record: RRID:AB_2313606
RRID:SCR_023756
DOI: 10.1111/bph.70331
Resource: SwissTargetPrediction (RRID:SCR_023756)
Curator: @scibot
SciCrunch record: RRID:SCR_023756