Communicating statistics, risk and uncertainty in the age of Covid—Prof. David Spiegelhalter. (2020, June 30). https://www.youtube.com/watch?v=Dq7W1l7RptQ&feature=youtu.be
579 Matching Annotations
- Jul 2020
-
www.youtube.com www.youtube.com
-
-
Uchikoshi, F. (2020). COVerAGE-JP: COVID-19 Deaths by Age and Sex in Japan [Preprint]. SocArXiv. https://doi.org/10.31235/osf.io/cpqrt
-
-
projecteuclid.org projecteuclid.org
-
Shmueli, G. (2010). To Explain or to Predict? Statistical Science, 25(3), 289–310.
-
-
www.theguardian.com www.theguardian.com
-
Spiegelhalter, D. (2020, July 5). Risks, R numbers and raw data: How to interpret coronavirus statistics. The Observer. https://www.theguardian.com/world/2020/jul/05/risks-r-numbers-and-raw-data-how-to-interpret-coronavirus-statistics
-
-
www.jclinepi.com www.jclinepi.com
-
Sperrin, M., Martin, G. P., Sisk, R., & Peek, N. (2020). Missing data should be handled differently for prediction than for description or causal explanation. Journal of Clinical Epidemiology, 0(0). https://doi.org/10.1016/j.jclinepi.2020.03.028
-
-
jasp-stats.org jasp-stats.org
-
Introducing JASP 0.13. (2020, July 2). JASP - Free and User-Friendly Statistical Software. https://jasp-stats.org/?p=6483
-
- Jun 2020
-
psyarxiv.com psyarxiv.com
-
Lakens, D. (2019). The practical alternative to the p-value is the correctly used p-value [Preprint]. PsyArXiv. https://doi.org/10.31234/osf.io/shm8v
-
-
psyarxiv.com psyarxiv.com
-
Parsons, Sam. ‘Reliability Multiverse’, 26 June 2020. https://doi.org/10.31234/osf.io/y6tcz.
-
-
twitter.com twitter.com
-
Amy Perfors on Twitter: “I’ve been having a difficult time lately — partly because of [insert frantic gesturing at the state of the world], partly personal — but one thing has been a real bright light for me in the last few months. I think it has some broader lessons that might give some hope, so THREAD” / Twitter. (n.d.). Twitter. Retrieved June 26, 2020, from https://twitter.com/amyperfors/status/1275931919897595904
-
-
www.lshtm.ac.uk www.lshtm.ac.uk
-
Causal inference isn’t what you think it is. (n.d.). LSHTM. Retrieved June 26, 2020, from https://www.lshtm.ac.uk/newsevents/events/causal-inference-isnt-what-you-think-it
-
-
Local file Local file
-
higher when Ericksen conflict was present (Figure 2A)
Yeah, in single neurons you can show the detection of general conflict this way, and it was not partitionable into different responses...
-
G)
Very clear effect! suspicious? how exactly did they even select the pseudo-populations, its not clear exactly from the methods to me
-
pseudotrial vector x
one trial for all different neurons in the current pseudopopulation matrix?
-
The separating hyperplane for each choice i is the vector (a) that satisfies: 770 771 772 773 Meaning that βi is a vector orthogonal to the separating hyperplane in neuron-774 dimensional space, along which position is proportional to the log odds of that correct 775 response: this is the the coding dimension for that correct response
Makes sense: If Beta is proportional to the log-odds of a correct response, a is the hyperplane that provides the best cutoff, which must be orthogonal. Multiplying two orthogonal vectors yields 0.
-
X is the trials by neurons pseudopopulation matrix of firing rates
So these pseudopopulations were random agglomerates of single neurons that were recorded, so many fits for random groups, and the best were kept?
-
Within each neuron, 719 we calculated the expected firing rate for each task condition, marginalizing over 720 distractors, and for each distractor, marginalizing over tasks.
Distractor = specific stimulus / location (e.g. '1' or 'left')?
Task = conflict condition (e.g. Simon or Ericksen)?
-
condition-averaged within neurons (9 data points per 691 neuron, reflecting all combinations of the 3 correct response, 3 Ericksen distractors, and 3 692 Simon distractors)
How do all combinations of 3 responses lead to only 9 data points per neuron? 3x2x2 = 12.
-
-
twitter.com twitter.com
-
Twitter. (n.d.). Twitter. Retrieved June 22, 2020, from https://twitter.com/JASPStats/status/1274764017752592384
-
-
twitter.com twitter.com
-
Prof Shamika Ravi on Twitter: “1) ACTIVE cases...shows which countries have 1) Peaked: Germany, S Korea, Japan, Italy, Spain... 2) Plateaued: France 3) Yet to peak: US, UK, Brazil, India...active cases still rising. 4) Second wave: Iran and.... Spain (?) https://t.co/C5c3gAhINc” / Twitter. (n.d.). Twitter. Retrieved June 2, 2020, from https://twitter.com/ShamikaRavi/status/1267664491040440322
-
-
iebh.bond.edu.au iebh.bond.edu.au
-
Institute for Evidence-Based Healthcare. (n.d.) 2 week systematic reviews (2weekSR). https://iebh.bond.edu.au/education-services/2-week-systematic-reviews-2weeksr
-
-
medium.com medium.com
-
Morey, R. D. (2020, June 12). Power and precision. Medium. https://medium.com/@richarddmorey/power-and-precision-47f644ddea5e
-
-
www.r-bloggers.com www.r-bloggers.com
-
Dablander, F. (2020, June 11). Interactive exploration of COVID-19 exit strategies. R-Bloggers. https://www.r-bloggers.com/interactive-exploration-of-covid-19-exit-strategies/
-
-
-
Brodeur, A., Cook, N., & Heyes, A. (2020). A Proposed Specification Check for p-Hacking. AEA Papers and Proceedings, 110, 66–69. https://doi.org/10.1257/pandp.20201078
-
-
rviews.rstudio.com rviews.rstudio.com
-
Views, R. (2020, May 20). An R View into Epidemiology. /2020/05/20/some-r-resources-for-epidemiology/
-
-
psyarxiv.com psyarxiv.com
-
Hopp, F. R., Fisher, J. T., Cornell, D., Huskey, R., & Weber, R. (2020). The Extended Moral Foundations Dictionary (eMFD): Development and Applications of a Crowd-Sourced Approach to Extracting Moral Intuitions from Text [Preprint]. PsyArXiv. https://doi.org/10.31234/osf.io/924gq
-
-
www.tandfonline.com www.tandfonline.com
-
Efron, B. (2020). Prediction, Estimation, and Attribution. Journal of the American Statistical Association, 115(530), 636–655. https://doi.org/10.1080/01621459.2020.1762613
-
-
twitter.com twitter.com
-
Adam Kucharski on Twitter: “I’m getting asked more about the ‘k’ parameter that describes variation in the reproduction number, R (i.e. describes superspreading). But what does this parameter actually mean? A short statistical thread... 1/” / Twitter. (n.d.). Twitter. Retrieved June 4, 2020, from https://twitter.com/AdamJKucharski/status/1267737631481364480
-
-
psyarxiv.com psyarxiv.com
-
Han, H., & Dawson, K. J. (2020). JASP (Software) [Preprint]. PsyArXiv. https://doi.org/10.31234/osf.io/67dcb
-
-
journals.sagepub.com journals.sagepub.com
-
Rosenbusch, H., Hilbert, L. P., Evans, A. M., & Zeelenberg, M. (2020). StatBreak: Identifying “Lucky” Data Points Through Genetic Algorithms. Advances in Methods and Practices in Psychological Science, 2515245920917950. https://doi.org/10.1177/2515245920917950
-
-
twitter.com twitter.com
-
Probability Fact on Twitter: “Random phenomena are not obligated to follow one of the few dozen distributions that humans have given names to.” / Twitter. (n.d.). Twitter. Retrieved June 2, 2020, from https://twitter.com/probfact/status/1267204212972236808
-
-
-
Cantwell, G. T., Liu, Y., Maier, B. F., Schwarze, A. C., Serván, C. A., Snyder, J., & St-Onge, G. (2020). Thresholding normally distributed data creates complex networks. Physical Review E, 101(6), 062302. https://doi.org/10.1103/PhysRevE.101.062302
-
- May 2020
-
twitter.com twitter.com
-
🔥Kareem Carr🔥 on Twitter: “I want to talk about bugs in statistical analyses. I think many data analysts worry unnecessarily about this. I do think it’s important to put a good faith effort into avoiding bugs, but I know data analysts that live in terror of hearing there’s a bug in published work. 1/6” / Twitter. (n.d.). Twitter. Retrieved May 30, 2020, from https://twitter.com/kareem_carr/status/1266029701392412673
-
-
www.theguardian.com www.theguardian.com
-
Richardson, S., & Spiegelhalter, D. (2020, April 12). Coronavirus statistics: What can we trust and what should we ignore? The Observer. https://www.theguardian.com/world/2020/apr/12/coronavirus-statistics-what-can-we-trust-and-what-should-we-ignore
-
-
www.nytimes.com www.nytimes.com
-
Roberts, D. C. (2020, May 22). Putting the Risk of Covid-19 in Perspective. The New York Times. https://www.nytimes.com/2020/05/22/well/live/putting-the-risk-of-covid-19-in-perspective.html
-
-
psyarxiv.com psyarxiv.com
-
Cuskley, C., & Wallenberg, J. (2020, May 14). Noise resistance in communication: Quantifying uniformity and optimality. https://doi.org/10.31234/osf.io/wpvq4
-
-
www.nature.com www.nature.com
-
Li, A., Zhou, L., Su, Q., Cornelius, S. P., Liu, Y.-Y., Wang, L., & Levin, S. A. (2020). Evolution of cooperation on temporal networks. Nature Communications, 11(1), 1–9. https://doi.org/10.1038/s41467-020-16088-w
-
-
www.estimationstats.com www.estimationstats.com
-
For comparisons between 3 or more groups that typically employ analysis of variance (ANOVA) methods, one can use the Cumming estimation plot, which can be considered a variant of the Gardner-Altman plot.
Cumming estimation plot

-
Efron developed the bias-corrected and accelerated bootstrap (BCa bootstrap) to account for the skew whilst obtaining the central 95% of the distribution.
Bias-corrected and accelerated bootstrap (BCa boostrap) deals with skewed sample distributions. However; it must be noted that it "may not give very accurate coverage in a small-sample non-parametric situation" (simply said, take caution with small datasets)
-
We can calculate the 95% CI of the mean difference by performing bootstrap resampling.
Bootstrap - simple but powerful technique that creates multiple resamples (with replacement) from a single set of observations, and computes the effect size of interest on each of these resamples. It can be used to determine the 95% CI (Confidence Interval).
We can use bootstrap resampling to obtain measure of precision and confidence about our estimate. It gives us 2 important benefits:
- Non-parametric statistical analysis - no need to assume normal distribution of our observations. Thanks to Central Limit Theorem, the resampling distribution of the effect size will approach normality
- Easy construction of the 95% CI from the resampling distribution. For 1000 bootstrap resamples of the mean difference, 25th value and 975th value can be used as boundaries of the 95% CI.
Bootstrap resampling can be used for such an example:

Computers can easily perform 5000 resamples:

Tags
Annotators
URL
-
-
psyarxiv.com psyarxiv.com
-
Zinn, S., & Gnambs, T. (2020, April 18). Analyzing nonresponse in longitudinal surveys using Bayesian additive regression trees: A nonparametric event history analysis. https://doi.org/10.31234/osf.io/82c3w
-
-
github.com github.com
-
McElreath, R. Statistical Rethinking: A Bayesian Course Using R and Stan Github.com. https://github.com/rmcelreath/statrethinking_winter2019
Entire course with materials online.
-
-
statmodeling.stat.columbia.edu statmodeling.stat.columbia.edu
-
Statistical Modeling, Causal Inference, and Social Science. (2020 April 22). Blog Post: New analysis of excess coronavirus mortality; also a question about poststratification. https://statmodeling.stat.columbia.edu/2020/04/22/analysis-of-excess-coronavirus-mortality-also-a-question-about-poststratification/
-
- Apr 2020
-
towardsdatascience.com towardsdatascience.com
-
the limitations of the PPS
Limitations of the PPS:
- Slower than correlation
- Score cannot be interpreted as easily as the correlation (it doesn't tell you anything about the type of relationship). PPS is better for finding patterns and correlation is better for communicating found linear relationships
- You cannot compare the scores for different target variables in a strict math way because they're calculated using different evaluation metrics
- There are some limitations of the components used underneath the hood
- You've to perform forward and backward selection in addition to feature selection
-
How to use the PPS in your own (Python) project
Using PPS with Python
- Download ppscore:
pip install ppscoreshell - Calculate the PPS for a given pandas dataframe:
import ppscore as pps pps.score(df, "feature_column", "target_column") - Calculate the whole PPS matrix:
pps.matrix(df)
- Download ppscore:
-
The PPS clearly has some advantages over correlation for finding predictive patterns in the data. However, once the patterns are found, the correlation is still a great way of communicating found linear relationships.
PPS:
- good for finding predictive patterns
- can be used for feature selection
- can be used to detect information leakage between variables
- interpret PPS matrix as a directed graph to find entity structures Correlation:
- good for communicating found linear relationships
-
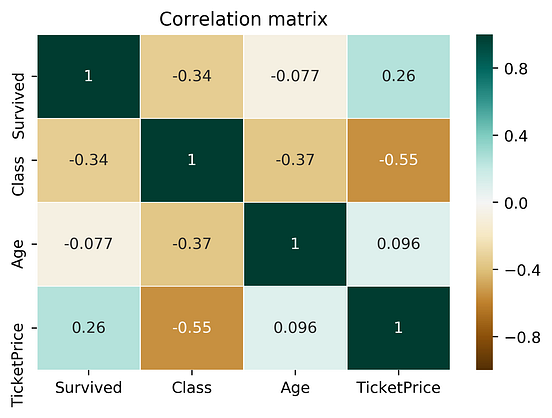
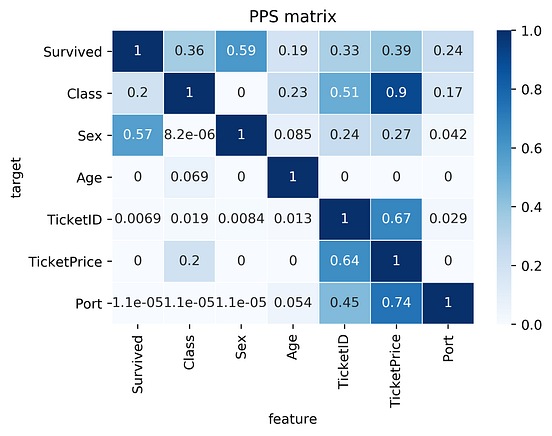
Let’s compare the correlation matrix to the PPS matrix on the Titanic dataset.
Comparing correlation matrix and the PPS matrix of the Titanic dataset:
findings about the correlation matrix:
- Correlation matrix is smaller because it doesn't work for categorical data
- Correlation matrix shows a negative correlation between
TicketPriceandClass. For PPS, it's a strong predictor (0.9 PPS), but not the other wayClasstoTicketPrice(ticket of 5000-10000$ is most likely the highest class, but the highest class itself cannot determine the price)
findings about the PPS matrix:
- First row of the matrix tells you that the best univariate predictor of the column
Survivedis the columnSex(Sexwas dropped for correlation) TicketIDuncovers a hidden pattern as well as it's connection with theTicketPrice
-
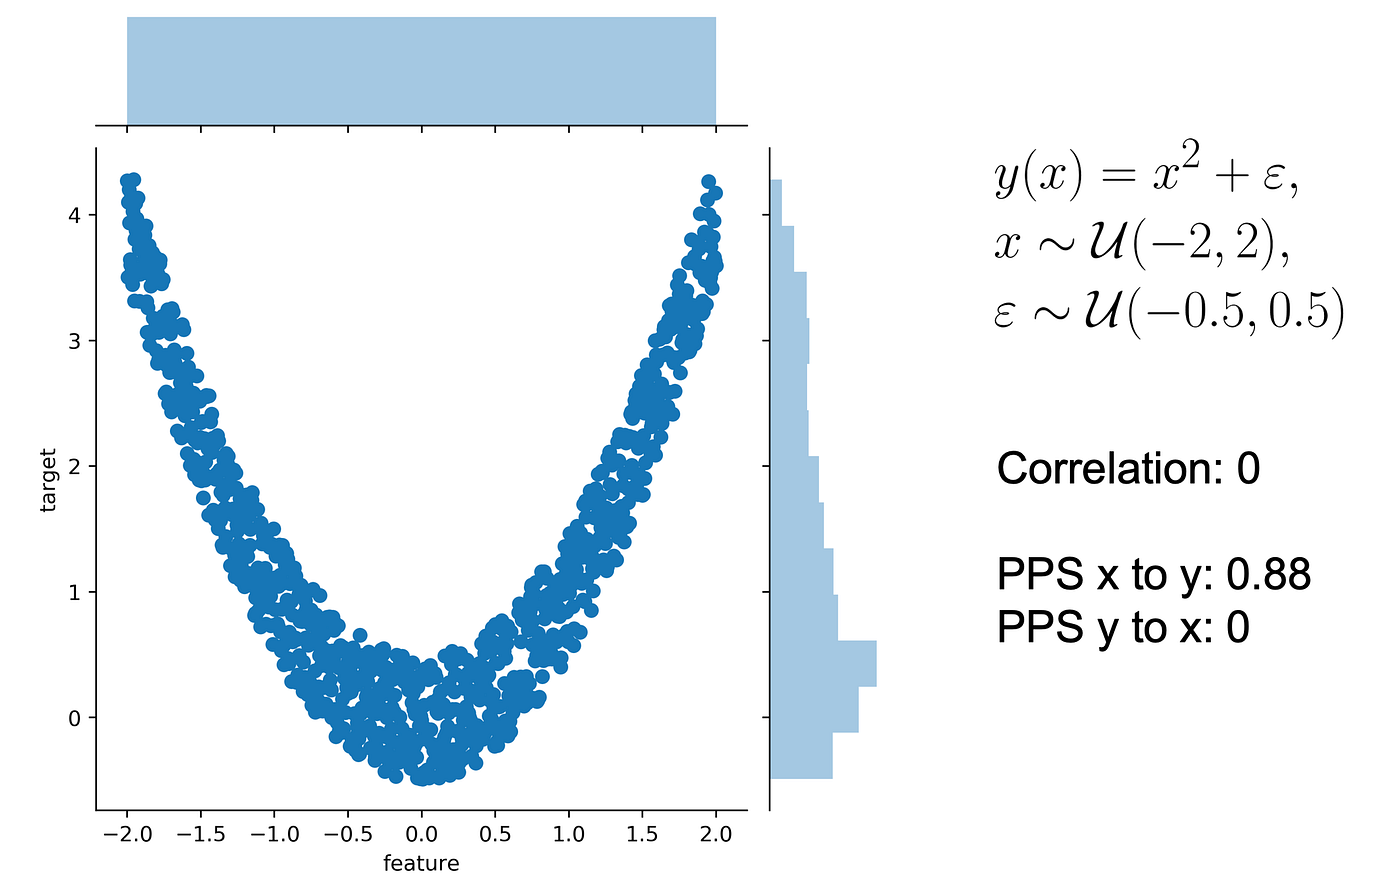
Let’s use a typical quadratic relationship: the feature x is a uniform variable ranging from -2 to 2 and the target y is the square of x plus some error.
In this scenario:
- we can predict y using x
- we cannot predict x using y as x might be negative or positive (for y=4, x=2 or -2
- the correlation is 0. Both from x to y and from y to x because the correlation is symmetric (more often relationships are assymetric!). However, the PPS from x to y is 0.88 (not 1 because of existing error)
- PPS from y to x is 0 because there's no relationship that y can predict if it only knows its own value
-
how do you normalize a score? You define a lower and an upper limit and put the score into perspective.
Normalising a score:
- you need to put a lower and upper limit
- upper limit can be F1 = 1, and a perfect MAE = 0
- lower limit depends on the evaluation metric and your data set. It's the value that a naive predictor achieves
-
For a classification problem, always predicting the most common class is pretty naive. For a regression problem, always predicting the median value is pretty naive.
What is a naive model:
- predicting common class for a classification problem
- predicting median value for a regression problem
-
Let’s say we have two columns and want to calculate the predictive power score of A predicting B. In this case, we treat B as our target variable and A as our (only) feature. We can now calculate a cross-validated Decision Tree and calculate a suitable evaluation metric.
If the target (B) variable is:
- numeric - we can use a Decision Tree Regressor and calculate the Mean Absolute Error (MAE)
- categoric - we can use a Decision Tree Classifier and calculate the weighted F1 (or ROC)
-
More often, relationships are asymmetric
a column with 3 unique values will never be able to perfectly predict another column with 100 unique values. But the opposite might be true
-
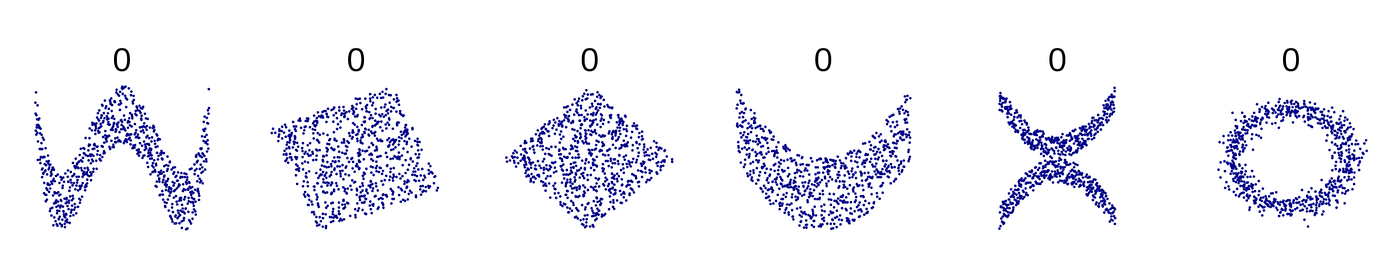
there are many non-linear relationships that the score simply won’t detect. For example, a sinus wave, a quadratic curve or a mysterious step function. The score will just be 0, saying: “Nothing interesting here”. Also, correlation is only defined for numeric columns.
Correlation:
- doesn't work with non-linear data
- doesn't work for categorical values
Examples:
-
-
math.stackexchange.com math.stackexchange.com
-
Suppose you have only two rolls of dice. then your best strategy would be to take the first roll if its outcome is more than its expected value (ie 3.5) and to roll again if it is less.
Expected payoff of a dice game:
Description: You have the option to throw a die up to three times. You will earn the face value of the die. You have the option to stop after each throw and walk away with the money earned. The earnings are not additive. What is the expected payoff of this game?
Rolling twice: $$\frac{1}{6}(6+5+4) + \frac{1}{2}3.5 = 4.25.$$
Rolling three times: $$\frac{1}{6}(6+5) + \frac{2}{3}4.25 = 4 + \frac{2}{3}$$
-
-
math.stackexchange.com math.stackexchange.com
-
Therefore, En=2n+1−2=2(2n−1)
Simplified formula for the expected number of tosses (e) to get
nconsecutive heads(n≥1):$$e_n=2(2^n-1)$$
For example, to get 5 consecutive heads, we've to toss the coin 62 times:
$$e_n=2(2^5-1)=62$$
We can also start with the longer analysis of the 5 scenarios:
- If we get a tail immediately (probability 1/2) then the expected number is e+1.
- If we get a head then a tail (probability 1/4), then the expected number is e+2.
- If we get two head then a tail (probability 1/8), then the expected number is e+2.
- If we get three head then a tail (probability 1/16), then the expected number is e+4.
- If we get four heads then a tail (probability 1/32), then the expected number is e+5.
- Finally, if our first 5 tosses are heads, then the expected number is 5.
Thus:
$$e=\frac{1}{2}(e+1)+\frac{1}{4}(e+2)+\frac{1}{8}(e+3)+\frac{1}{16}\\(e+4)+\frac{1}{32}(e+5)+\frac{1}{32}(5)=62$$
We can also generalise the formula to:
$$e_n=\frac{1}{2}(e_n+1)+\frac{1}{4}(e_n+2)+\frac{1}{8}(e_n+3)+\frac{1}{16}\\(e_n+4)+\cdots +\frac{1}{2^n}(e_n+n)+\frac{1}{2^n}(n) $$
-
-
psyarxiv.com psyarxiv.com
-
Derks, K., de swart, j., van Batenburg, P., Wagenmakers, E., & wetzels, r. (2020, April 28). Priors in a Bayesian Audit: How Integration of Existing Information into the Prior Distribution Can Increase Transparency, Efficiency, and Quality. Retrieved from psyarxiv.com/8fhkp
-
-
stats.stackexchange.com stats.stackexchange.com
-
Repeated measures involves measuring the same cases multiple times. So, if you measured the chips, then did something to them, then measured them again, etc it would be repeated measures. Replication involves running the same study on different subjects but identical conditions. So, if you did the study on n chips, then did it again on another n chips that would be replication.
Difference between repeated measures and replication
-
-
psyarxiv.com psyarxiv.com
-
Olapegba, P. O., Ayandele, O., Kolawole, S. O., Oguntayo, R., Gandi, J. C., Dangiwa, A. L., … Iorfa, S. K. (2020, April 12). COVID-19 Knowledge and Perceptions in Nigeria. https://doi.org/10.31234/osf.io/j356x
Tags
- information
- COVID-19
- media
- lockdown
- is:preprint
- behavior
- misinformation
- lang:en
- symptom
- knowledge
- data collection
- perception
- news
- misconception
- precaution
- infection
- China
- questionnaire
- general public
- public health
- Nigeria
- health information
- descriptive statistics
- transmission
- prevention
Annotators
URL
-
-
arxiv.org arxiv.org
-
Taleb, N. N. (2019). On the Statistical Differences between Binary Forecasts and Real World Payoffs. ArXiv:1907.11162 [Physics, q-Fin]. http://arxiv.org/abs/1907.11162
-
-
doi.org doi.org
-
Hossain, M. A. (2020). Is the spread of COVID-19 across countries influenced by environmental, economic and social factors? [Preprint]. Epidemiology. https://doi.org/10.1101/2020.04.08.20058164
-
-
users.ox.ac.uk users.ox.ac.uk
-
Bird, S., Nielsen, B. (2020 April 20). Now-casting of Covid-19 deaths in English Hospitals. http://users.ox.ac.uk/~nuff0078/Covid/index.htm
-
-
doi.org doi.org
-
Atchison, C. J., Bowman, L., Vrinten, C., Redd, R., Pristera, P., Eaton, J. W., & Ward, H. (2020). Perceptions and behavioural responses of the general public during the COVID-19 pandemic: A cross-sectional survey of UK Adults [Preprint]. Public and Global Health. https://doi.org/10.1101/2020.04.01.20050039
Tags
- modeling
- COVID-19
- survey
- government
- economy
- lockdown
- demographics
- social distancing
- is:preprint
- behavior
- minority
- transmission dynamics
- lang:en
- statistics
- handwashing
- policy
- data collection
- face mask
- response
- cross-sectional
- perception
- risk perception
- self-isolation
- UK
- quarentine
- adult
- prevention
Annotators
URL
-
-
twitter.com twitter.com
-
ReconfigBehSci en Twitter: “an interesting source of statistics, both on COVID-19 and other issues that help provide some context to numbers https://t.co/T0wBZIlCfR” / Twitter. (n.d.). Twitter. Retrieved April 17, 2020, from https://twitter.com/SciBeh/status/1246714565850734592
-
-
www.ons.gov.uk www.ons.gov.uk
-
Deaths involving COVID-19, England and Wales—Office for National Statistics. (n.d.). Retrieved April 20, 2020, from https://www.ons.gov.uk/peoplepopulationandcommunity/birthsdeathsandmarriages/deaths/bulletins/deathsinvolvingcovid19englandandwales/deathsoccurringinmarch2020
-
- Mar 2020
-
datagenetics.com datagenetics.com
-
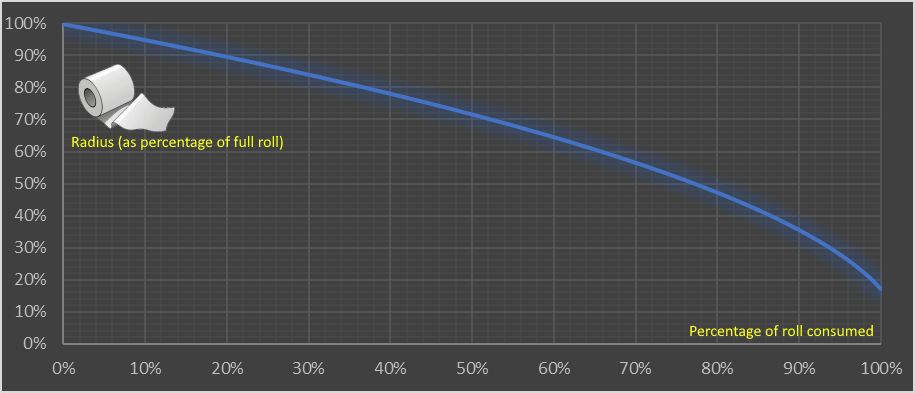
This volume of paper should be the same as the coaxial plug of paper on the roll.
Calculating volume of the paper roll: $$\mathbf{Lwt = \pi w(R^2 - r^2)} \~\ L = \text{length of the paper} \ w = \text{width of the paper} \ t = \text{thickness} \ R = \text{outer radius} \ r = \text{inner radius}$$ And that simplifies into a formula for R: $$\color{red} {\bf R = \sqrt{\frac{Lt}{\pi}+r^2}}$$
-
This shows the nonlinear relationship and how the consumption accelerates. The first 10% used makes just a 5% change in the diameter of the roll. The last 10% makes an 18.5% change.
Consumption of a toilet paper roll has a nonlinear relationship between the:
- y-axis (outer Radius of the roll (measured as a percentage of a full roll))
- x-axis (% of the roll consumed)
-
Toilet paper is typically supplied in rolls of perforated material wrapped around a central cardboard tube. There’s a little variance between manufacturers, but a typical roll is approximately 4.5” wide with an 5.25” external diameter, and a central tube of diameter 1.6” Toilet paper is big business (see what I did there?) Worldwide, approximately 83 million rolls are produced per day; that’s a staggering 30 billion rolls per year. In the USA, about 7 billion rolls a year are sold, so the average American citizen consumes two dozen rolls a year (two per month). Americans use 24 rolls per capita a year of toilet paper Again, it depends on the thickness and luxuriousness of the product, but the perforations typically divide the roll into approximately 1,000 sheets (for single-ply), or around 500 sheets (for double-ply). Each sheet is typically 4” long so the length of a (double-ply) toilet roll is approximately 2,000” or 167 feet (or less, if your cat gets to it).
Statistics on the type and use of toilet paper in the USA.
1" (inch) = 2.54 cm
Tags
Annotators
URL
-
-
-
In the interval scale, there is no true zero point or fixed beginning. They do not have a true zero even if one of the values carry the name “zero.” For example, in the temperature, there is no point where the temperature can be zero. Zero degrees F does not mean the complete absence of temperature. Since the interval scale has no true zero point, you cannot calculate Ratios. For example, there is no any sense the ratio of 90 to 30 degrees F to be the same as the ratio of 60 to 20 degrees. A temperature of 20 degrees is not twice as warm as one of 10 degrees.
Interval data:
- show not only order and direction, but also the exact differences between the values
- the distances between each value on the interval scale are meaningful and equal
- no true zero point
- no fixed beginning
- no possibility to calculate ratios (only add and substract)
- e.g.: temperature in Fahrenheit or Celsius (but not Kelvin) or IQ test
-
As the interval scales, Ratio scales show us the order and the exact value between the units. However, in contrast with interval scales, Ratio ones have an absolute zero that allows us to perform a huge range of descriptive statistics and inferential statistics. The ratio scales possess a clear definition of zero. Any types of values that can be measured from absolute zero can be measured with a ratio scale. The most popular examples of ratio variables are height and weight. In addition, one individual can be twice as tall as another individual.
Ratio data is like interval data, but with:
- absolute zero
- possibility to calculate ratio (e.g. someone can be twice as tall)
- possibility to not only add and subtract, but multiply and divide values
- e.g.: weight, height, Kelvin scale (50K is 2x hot as 25K)
Tags
Annotators
URL
-
-
towardsdatascience.com towardsdatascience.com
-
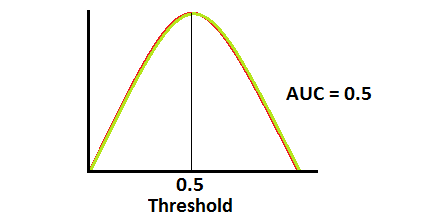
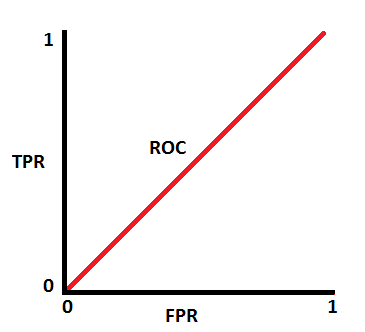
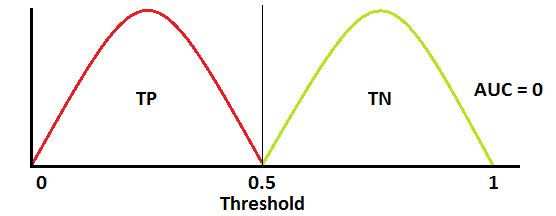
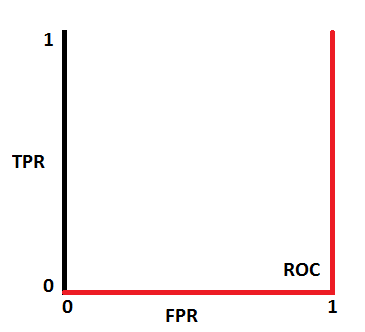
when AUC is 0.5, it means model has no class separation capacity whatsoever.
If AUC = 0.5
-
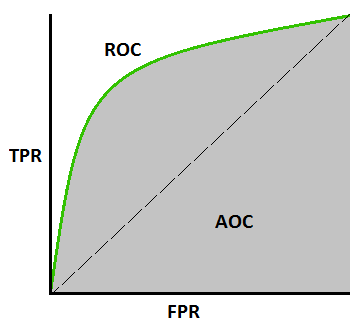
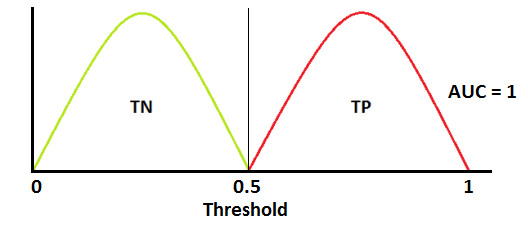
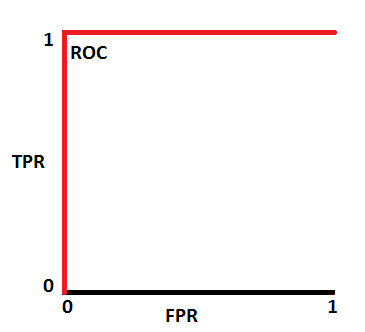
ROC is a probability curve and AUC represents degree or measure of separability. It tells how much model is capable of distinguishing between classes.
ROC & AUC
-
In multi-class model, we can plot N number of AUC ROC Curves for N number classes using One vs ALL methodology. So for Example, If you have three classes named X, Y and Z, you will have one ROC for X classified against Y and Z, another ROC for Y classified against X and Z, and a third one of Z classified against Y and X.
Using AUC ROC curve for multi-class model
-
When AUC is approximately 0, model is actually reciprocating the classes. It means, model is predicting negative class as a positive class and vice versa
If AUC = 0
-
AUC near to the 1 which means it has good measure of separability.
If AUC = 1
-
-
-
Softmax turns arbitrary real values into probabilities
Softmax function -
- outputs of the function are in range [0,1] and add up to 1. Hence, they form a probability distribution
- the calcualtion invloves e (mathematical constant) and performs operation on n numbers: $$s(x_i) = \frac{e^{xi}}{\sum{j=1}^n e^{x_j}}$$
- the bigger the value, the higher its probability
- lets us answer classification questions with probabilities, which are more useful than simpler answers (e.g. binary yes/no)
Tags
Annotators
URL
-
-
www.linkedin.com www.linkedin.comLinkedIn1
-
1. Logistic regression IS a binomial regression (with logit link), a special case of the Generalized Linear Model. It doesn't classify anything *unless a threshold for the probability is set*. Classification is just its application. 2. Stepwise regression is by no means a regression. It's a (flawed) method of variable selection. 3. OLS is a method of estimation (among others: GLS, TLS, (RE)ML, PQL, etc.), NOT a regression. 4. Ridge, LASSO - it's a method of regularization, NOT a regression. 5. There are tens of models for the regression analysis. You mention mainly linear and logistic - it's just the GLM! Learn the others too (link in a comment). STOP with the "17 types of regression every DS should know". BTW, there're 270+ statistical tests. Not just t, chi2 & Wilcoxon
5 clarifications to common misconceptions shared over data science cheatsheets on LinkedIn
-
-
www.linkedin.com www.linkedin.comLinkedIn1
-
An exploratory plot is all about you getting to know the data. An explanatory graphic, on the other hand, is about telling a story using that data to a specific audience.
Exploratory vs Explanatory plot
-
- Feb 2020
-
www.magasinetparagraf.se www.magasinetparagraf.se
-
(Återkommande forskning visar att 85-90 procent av tonårskillar begår brott. Allt från snatteri upp till rån och mord. Och det oavsett om de har invandrarbakgrund eller inte. Cirka 97-98 procent av de här killarna blir sedan skötsamma arbetande vuxna medborgare – som beklagar sig över ungdomsbrottsligheten.)
-
- Jan 2020
-
www.theglobeandmail.com www.theglobeandmail.com
-
In the dark: the cost of Canada's data deficit
-
- Dec 2019
-
www.ncbi.nlm.nih.gov www.ncbi.nlm.nih.gov
-
The average IQs of adopted children in lower and higher socioeconomic status (SES) families were 85 (SD = 17) and 98 (SD = 14.6), respectively, at adolescence (mean age = 13.5 years)
I'm looking for the smallest standard deviation in an adopted sample to compare the average difference to that of identical twins. This study suggests that the SD in adoption is identical to the SD in the general population. This supports the idea that lower SD in adopted identical twins is entirely down to genes (or, in principal, prenatal environment).
Note that this comment is referring to this Reddit inquiry.
-
-
andrewmaclachlan.github.io andrewmaclachlan.github.io
-
If you are running a regression model on data that do not have explicit space or time dimensions, then the standard test for autocorrelation would be the Durbin-Watson test.
Durbin-Watson test?
-
- Nov 2019
-
users.hist.umn.edu users.hist.umn.edu
-
For most of the twentieth century, Census Bureau administrators resisted private-sector intrusion into data capture and processing operations, but beginning in the mid-1990s, the Census Bureau increasingly turned to outside vendors from the private sector for data captureand processing. Thisprivatization led to rapidly escalating costs, reduced productivity, near catastrophic failures of the 2000 and 2010 censuses, and high risks for the 2020 census.
Parallels to ABS in Australia
-
-
a-little-book-of-r-for-time-series.readthedocs.io a-little-book-of-r-for-time-series.readthedocs.io
-
This booklet itells you how to use the R statistical software to carry out some simple analyses that are common in analysing time series data.
what is time series?
-
-
docdrop.org docdrop.org
-
Top 20 topic categories.
Immigration, Guns, Education, that exactly what I choose for my three letters comments. I think this result is also influenced by media. Every day these three areas are the main subject developed on media. 10 years ago the result will show different areas.
-
- Aug 2019
-
ec.europa.eu ec.europa.eu
-
Pages in category "Passengers"
Statistics for transportation in EU
-
-
www.uitp.org www.uitp.org
-
On public transport ridership in the EU
A screenshot is needed
-
-
www.sanalabs.com www.sanalabs.com
-
ie. decision tree split, entropy minimum or information max at 0.5:0.5 split
-
- Jul 2019
-
www.jwilber.me www.jwilber.me
-
In statistical testing, we structure experiments in terms of null & alternative hypotheses. Our test will have the following hypothesis schema: Η0: μtreatment <= μcontrol ΗA: μtreatment > μcontrol Our null hypothesis claims that the new shampoo does not increase wool quality. The alternative hypothesis claims the opposite; new shampoo yields superior wool quality.
hypothesis schema; statistics
-
- Jun 2019
-
pib.nic.in pib.nic.in
-
Ministries will be involved in close monitoring and supervision of the field work to ensure data quality and good coverage. This is the first time that the rigours of monitoring and supervision of field work exercised in NSS will be leveraged for the Economic Census so that results of better quality would be available for creation of a National Statistical Business Register. This process has been catalysed by the establishment of a unified National Statistical Office (NSO).
Tags
Annotators
URL
-
- May 2019
-
www.theatlantic.com www.theatlantic.com
-
It’s as if they’d been “describing the life cycle of unicorns, what unicorns eat, all the different subspecies of unicorn, which cuts of unicorn meat are tastiest, and a blow-by-blow account of a wrestling match between unicorns and Bigfoot,” Alexander wrote.
-
-
en.wikipedia.org en.wikipedia.org
-
Parametric statistics is a branch of statistics which assumes that sample data comes from a population that can be adequately modelled by a probability distribution that has a fixed set of parameters.[1] Conversely a non-parametric model differs precisely in that the parameter set (or feature set in machine learning) is not fixed and can increase, or even decrease, if new relevant information is collected.[2] Most well-known statistical methods are parametric.[3] Regarding nonparametric (and semiparametric) models, Sir David Cox has said, "These typically involve fewer assumptions of structure and distributional form but usually contain strong assumptions about independencies".[4]
Non-parametric vs parametric stats
-
-
en.wikipedia.org en.wikipedia.org
-
Statistical hypotheses concern the behavior of observable random variables.... For example, the hypothesis (a) that a normal distribution has a specified mean and variance is statistical; so is the hypothesis (b) that it has a given mean but unspecified variance; so is the hypothesis (c) that a distribution is of normal form with both mean and variance unspecified; finally, so is the hypothesis (d) that two unspecified continuous distributions are identical. It will have been noticed that in the examples (a) and (b) the distribution underlying the observations was taken to be of a certain form (the normal) and the hypothesis was concerned entirely with the value of one or both of its parameters. Such a hypothesis, for obvious reasons, is called parametric. Hypothesis (c) was of a different nature, as no parameter values are specified in the statement of the hypothesis; we might reasonably call such a hypothesis non-parametric. Hypothesis (d) is also non-parametric but, in addition, it does not even specify the underlying form of the distribution and may now be reasonably termed distribution-free. Notwithstanding these distinctions, the statistical literature now commonly applies the label "non-parametric" to test procedures that we have just termed "distribution-free", thereby losing a useful classification.
Non-parametric vs parametric statistics
-
Non-parametric methods are widely used for studying populations that take on a ranked order (such as movie reviews receiving one to four stars). The use of non-parametric methods may be necessary when data have a ranking but no clear numerical interpretation, such as when assessing preferences. In terms of levels of measurement, non-parametric methods result in ordinal data. As non-parametric methods make fewer assumptions, their applicability is much wider than the corresponding parametric methods. In particular, they may be applied in situations where less is known about the application in question. Also, due to the reliance on fewer assumptions, non-parametric methods are more robust. Another justification for the use of non-parametric methods is simplicity. In certain cases, even when the use of parametric methods is justified, non-parametric methods may be easier to use. Due both to this simplicity and to their greater robustness, non-parametric methods are seen by some statisticians as leaving less room for improper use and misunderstanding. The wider applicability and increased robustness of non-parametric tests comes at a cost: in cases where a parametric test would be appropriate, non-parametric tests have less power. In other words, a larger sample size can be required to draw conclusions with the same degree of confidence.
Non-parametric vs parametric statistics
-
-
en.wikipedia.org en.wikipedia.org
-
The concept of data type is similar to the concept of level of measurement, but more specific: For example, count data require a different distribution (e.g. a Poisson distribution or binomial distribution) than non-negative real-valued data require, but both fall under the same level of measurement (a ratio scale).
-
-
-
Even if Muslims were hypothetically behind every single one of the 140,000 terror attacks committed worldwide since 1970, those terrorists would represent barely 0.009 percent of global Islam
This is a veryyy relevant statistic, thank god.
-
That is, deaths from terrorism account for 0.025 of the total number of murders, or 2.5%
Irrelevant statistics IMO
-
American Muslims have killed less than 0.0002 percent of those murdered in the USA during this period
selection of detail
-
How many people did toddlers kill in 2013? Five, all by accidentally shooting a gun
selection of detail of outlandish statistic to emphasise main point
-
you actually have a better chance of being killed by a refrigerator falling on you
selection of detail of outlandish statistic to emphasise main point
-
Since 9/11, Muslim-American terrorism has claimed 37 lives in the United States, out of more than 190,000 murders during this period
stats
-
pproximately 60 were carried out by Muslims. In other words, approximately 2.5% of all terrorist attacks on US soil between 1970 and 2012 were carried out by Muslims.
stats
-
94 percent of the terror attacks were committed by non-Muslims
stats
-
Muslim terrorists were responsible for a meagre 0.3 percent of EU terrorism during those years.
stats
-
in 2013, there were 152 terrorist attacks in Europe. Only two of them were “religiously motivated”, while 84 were predicated on ethno-nationalist or separatist beliefs
stats
-
in the 4 years between 2011 and 2014 there were 746 terrorist attacks in Europe. Of these, only eight were religiously-inspired, which is 1% of the total
stats
-
official data from Europol
Stats
Tags
Annotators
URL
-
-
bengoldhaber.com bengoldhaber.com
-
info-request
What is the current price of cyber insurance? Has it gone up in price?
-
info-request
Looking for statistics on the number of cybercrime prosecutions over time.
Tags
Annotators
URL
-
- Apr 2019
-
mp.weixin.qq.com mp.weixin.qq.com果壳4
-
要保持谦逊:兼容性评估的前提是用于计算区间的统计假设是正确的
應翻為確認統計假設的正確性。這點看出他們的立論基於估計的參數,而非實在的科學理論。統計假設是科學理論推理的延伸,只用推理合乎有效的邏輯形式,有效結果與無效結果都會是科學理論的證據。
-
在给定假设的情况下,区间内数值与研究数据的兼容性并不完全相同
原文“not all values inside are equally compatible with the data, given the assumptions. ” 這裡的assumption是指估計的參數,還是科學理論對現實狀況的預測,並沒有明確說明。如果是估計的參數,Amrhein等人也許將P(D|theta)當成P(theta)。
-
我们看到了大量具有“统计学显著性”的结果;而不具有“统计学显著性”的结果则被显著低估
豈止低估。不顯著的研究結果經常被鎖起來不見天日。
-
在置信区间包含风险显著增高的情况下,仅因为结果不具有统计学显著性就推论药物与房颤发生“无关”十分可笑;据此就认为前后两项研究矛盾——即便风险比完全一致——同样非常荒谬。这些常见情况表明我们依赖的统计学显著性阈值有可能误导我们。
Amrhein 等人以此例子顯示confidence interval能突顯不一致的研究之間,評估要測量的效應其實一致的資訊。
Tags
Annotators
URL
-
- Mar 2019
-
medium.economist.com medium.economist.com
-
At The Economist, we take data visualisation seriously. Every week we publish around 40 charts across print, the website and our apps. With every single one, we try our best to visualise the numbers accurately and in a way that best supports the story. But sometimes we get it wrong. We can do better in future if we learn from our mistakes — and other people may be able to learn from them, too.
This is, factually and literally speaking, laudable in the extreme.
Anybody can make mistakes; the best one can do is to admit that one does, and publicly learn from them - if one is a magazine. This is beauteously done.
-
-
www.nature.com www.nature.com
- Jan 2019
-
inst-fs-iad-prod.inscloudgate.net inst-fs-iad-prod.inscloudgate.net
-
the strongest first factor accounted for 86.3% of observed variable variance
I suspect that this factor was so strong because it consisted of only four observed variables, and three of them were written measures of verbal content. All of the verbal cariables correlated r = .72 to .89. Even the "non-verbal" variable (numerical ability) correlates r = .72 to .81 with the other three variables (Rehna & Hanif, 2017, p. 25). Given these strong correlations, a very strong first factor is almost inevitable.
-
The weakest first factor accounted for 18.3% of variance
This factor may be weak because the sample consists of Sudanese gifted children, which may have restricted the range of correlations in the dataset.
Tags
Annotators
URL
-
- Dec 2018
-
www.anthropic-principle.com www.anthropic-principle.com
-
The Doomsday argument
The Doomsday argument (DA) is a probabilistic argument that claims to predict the number of future members of the human species given only an estimate of the total number of humans born so far. Simply put, it says that supposing that all humans are born in a random order, chances are that any one human is born roughly in the middle.
From Wikipedia, Doomsday argument
Tags
Annotators
URL
-
- Nov 2018
-
www.coursera.org www.coursera.org
-
Basic Statistics
part of specialization
Tags
Annotators
URL
-
-
www.insidehighered.com www.insidehighered.com
-
Online Options Give Adults Access, but Outcomes Lag
In this article, drivers that increase and improve online learning success in adults are explored. State by state data along with federal stats contribute to the conclusions presented.
Roughly 13% of all undergraduates are full-time online students and between 2012 and 2017 online students grew y 11 percent, about 2.25 million. The article presents a map showing state by state stats and the information provided can assist in growing individual school needs.
RATING: 4/5 (rating based upon a score system 1 to 5, 1= lowest 5=highest in terms of content, veracity, easiness of use etc.)
-
- Sep 2018
-
stackoverflow.com stackoverflow.com
-
Double-centering a matrix M
-
-
stats.stackexchange.com stats.stackexchange.com
-
Relationship between ridge regression and PCA regression
-
-
Local file Local file
-
Lack of metrics
Develop or strengthen statistical information of new industry developments, ups and downs of existing industries.
-
LDLC workers and their needs
Develop or strengthen statistics regarding LDLC workers and their needs
-
-
www.statisticssolutions.com www.statisticssolutions.com
-
predictive analysis
Predictive analytics encompasses a variety of statistical techniques from data mining, predictive modelling, and machine learning, that analyze current and historical facts to make predictions about future or otherwise unknown events.
-
- Apr 2018
-
www.madinamerica.com www.madinamerica.com
-
Excellent example of badly used statistics.
-
- Mar 2018
-
www.r-bloggers.com www.r-bloggers.com
-
Boxplots and Beyond – Part II: Asymmetry
-
-
eurekastatistics.com eurekastatistics.com
-
Using the Median Absolute Deviation to Find Outliers
-
-
www.ncbi.nlm.nih.gov www.ncbi.nlm.nih.gov
-
Power analysis and sample size estimation for RNA-Seq differential expression
Tags
Annotators
URL
-
-
www.ncbi.nlm.nih.gov www.ncbi.nlm.nih.gov
-
Polyester: simulating RNA-seq datasets with differential transcript expression
-
- Feb 2018
-
hypothes.is hypothes.is
-
My daughter will be brought up to understand her true value. That’s a promise. As for all the little girls to be born around the world, the creation of these ads is an effort to show how imagination can change the conversation around their lives.
-
-
achri.blogspot.com achri.blogspot.com
-
Combining data from multiple RNASeq experiments: release the Kruskal! (...Wallis test)
-
- Dec 2017
-
www.sciencedirect.com www.sciencedirect.com
-
Neural correlates of interspecies perspective taking in the post-mortem Atlantic Salmon: an argument for multiple comparisons correction
-
-
royalsocietypublishing.org royalsocietypublishing.org
-
The natural selection of bad science
-
- Nov 2017
-
rafalab.github.io rafalab.github.ioharvardx1
-
HarvardX Biomedical Data Science Open Online Training
-
-
www.sciencedirect.com www.sciencedirect.com
-
pairwise overlaps using Fisher’s test and mutual exclusion (Leiserson et al., 2016xA weighted exact test for mutually exclusive mutations in cancer. Leiserson, M.D.M., Reyna, M.A., and Raphael, B.J. Bioinformatics. 2016; 32: i736–i745Crossref | PubMed | Scopus (4)See all ReferencesLeiserson et al., 2016)
-
-
www.ncbi.nlm.nih.gov www.ncbi.nlm.nih.gov
-
Gene Set Enrichment Analysis Made Simple
using aggregate t or chi^2 statistic to test if a set of genes is on aggregate differentially expressed
-
- Oct 2017
-
www.restore.ac.uk www.restore.ac.uk
-
An Introduction to Odds, Odds Ratios and Exponents
-
-
tedunderwood.com tedunderwood.com
-
One of the main ways computers are changing the textual humanities is by mediating new connections to social science. The statistical models that help sociologists understand social stratification and social change haven’t in the past contributed much to the humanities, because it’s been difficult to connect quantitative models to the richer, looser sort of evidence provided by written documents.
DH as moving English more toward the statistical...
-
- May 2017
-
fivethirtyeight.com fivethirtyeight.com
-
Analysis of a subreddit for Trump supporters, based on comparisons of the users of various subreddits.
-
-
static1.squarespace.com static1.squarespace.com
-
s. If we want to understand the effects of global warming or whether the economy is headed for a recessio
The class on The Rhetorical Situation brought up discussion on the evolving notion of "weather" as a changeable, even rhetorical, thing. Moving to integrate database and narrative as symbionts makes a connection between data and delivery/appeal.
-
- Apr 2017
-
bangordailynews.com bangordailynews.com
-
The annual drop in Maine wood demand since 2014 would fill that imaginary 1,770-mile caravan. The loss equals about 350 fewer truckloads of wood a day, every day of the year.
-
- Mar 2017
-
bangordailynews.com bangordailynews.com
-
The state has pumped more than 100 million pounds of low bush fruit into the frozen market each year for the last three growing cycles.
-
A typical acre of blueberry barrens will yield about 2,000 to 4,000 pounds of berries, depending on pollination and other factors.
-
-
tachesdesens.blogspot.com tachesdesens.blogspot.com
-
I never regret the eleven months which hardened my resolve, to go beyond 98 'Nos' to get to the precious, unexpected 'Yes's'. I was nobody, I was selling nothing, I could be nobody selling anything.
Numbers
Statistics
Alienation
-
- Feb 2017
-
static1.squarespace.com static1.squarespace.com
-
That two dice marked in the common way will tum up seven, is thrice as probable as that they will tum up eleven, and six times as probable as that they will tum up twelve
D&D has made me embarrassingly good at estimating probable outcomes of platonic die in my head.
-
In moral reasoning we ascend from pos-~ibility, by an insensible gradation, to probabil-ity, and thence, in the same manner, to the sum-mit of moral certainty.
I believe Campbell addresses some of the uncertainty of Inductive Reasoning here. The phrase "insensible gradation" seems meaningful--how we go from a possibility to moral certainty is something fundamentally difficult in a manner Hume cannot accept. But Campbell explains in this section many of the difficulties of this, and how it's still useable, for moral judgment.
On the same side, I come back to Bayesian Probabilities, wondering if Campbell knew about them, and how they transfer statistical, mathematical knowledge towards determining if a hypothesis is true. Once again, I'm hesitant that I'll exceed my grasp of stats if I talk to much about it, though.
-
The course of nature will be the same tomorrow that it is today; or, the future will resemble the past"
Apparently, this is a surprisingly successful rationale for meteorology. If you just assume "tomorrow's weather will resemble today's," you'll end up more right than not, and can actually beat some meteorologists. Then again, Jim Flowers and the KMTV Accu-Weather Forecast might have just been terrible.
-
- Oct 2016
-
www.businessinsider.com www.businessinsider.com
-
With figures like those, it's clear that the education system isn't going away anytime soon.
How so?
-
- Sep 2016
-
www.thelocal.se www.thelocal.se
-
According to the language periodical Språktidningen, ‘hen’ was by 2014 used once in the Swedish media for every 300 used of ‘hon’ or ‘han’, up from one in every 13,000 in 2011
Increasing rate of usage of hen vs. hon or han: 1/13,000 in 2011; 1/300 in 2014.
-
- May 2016
-
www.propublica.org www.propublica.org
-
the algorithm was somewhat more accurate than a coin flip
In machine learning it's also important to evaluate not just against random, but against how well other methods (e.g. parole boards) do. That kind of analysis would be nice to see.
-
-
medium.com medium.com
-
A study of housing cost in San Francisco from the 1950s to 2016.
-
- Mar 2016
-
amstat.tandfonline.com amstat.tandfonline.com
-
American Statistical Association statement on p-values
-
- Feb 2016
-
-
3,068 adults in August 2014, found that 72 percent of Americans reported feeling stressed about money at least some of the time during the past month. Twenty-two percent said that they experienced extreme stress about money during the past month (an 8, 9 or 10 on a 10-point scale, where 1 is “little or no stress” and 10 is “a great deal of stress”). For the majority of Americans (64 percent), money is a somewhat or very significant source of stress, but especially for parents and younger adults (77 percent of parents, 75 percent of millennials [18 to 35 years old] and 76 percent of Gen Xers [36 to 49 years old]).
Along the lines of the first paragraph except putting some percentages into it. Almost three quarters of Americans (out of a 3,000 person survey) feels some kind of "extreme stress about money" each month, the majority coming from parents, adults and young adults (18-35). I'll incorporate this into my paper by using statistics to show how money is a huge reason for stress in adults.
-
-
bangordailynews.com bangordailynews.com
-
He expects that the logging project near Quimby’s land will likely generate about $755,250 at the state’s average sale price, $50.35 per cord of wood. The land has about 1,500 harvestable acres that contain about 30 cords of wood per acre, or 45,000 cords, but only about a third of that will be cut because the land is environmentally sensitive, Denico said. The Bureau of Parks and Lands expects to generate about $6.6 million in revenue this year selling about 130,000 cords of wood from its lots, Denico said. Last year, the bureau generated about $7 million harvesting about 139,000 cords of wood. The Legislature allows the cutting of about 160,000 cords of wood on state land annually, although the LePage administration has sought to increase that amount.
-
-
www.psychologytoday.com www.psychologytoday.com
-
From 1926 until the early 1950s, US military aircraft relied on a "one size fits all" design based on average measurements of hundreds of male pilots.
But a 1950 study by Lt. Gilbert Daniels showed that out of 4,063 airmen, not even one was average in all ten measurements. They started designing cockpits and controls to be adjustable. Accidents decreased, and pilot performance increased.
Standardized education makes the same mistake.
-
The science of the individual relies on dynamic systems theory rather than group statistics. Its research methodology is characterized by “analyze, then aggregate” (analyze each subject separately, then combine individual patterns into collective understanding) rather than “aggregate, then analyze” (derive group statistics based on aggregate data, then use these statistics to evaluate and understand individuals).
A mathematical psychologist at Penn State University, Molenaar extended ergodic theory (link is external) to prove that it was not mathematically permissible to use assessment instruments based on group averages to evaluate individuals.
A Manifesto on Psychology as Idiographic Science, Peter Molenaar
-
-
leanpub.com leanpub.com
-
Books on data science and R programming by Roger D. Peng of Johns Hopkins.
-
-
blog.cloudera.com blog.cloudera.com
-
Great explanation of 15 common probability distributions: Bernouli, Uniform, Binomial, Geometric, Negative Binomial, Exponential, Weibull, Hypergeometric, Poisson, Normal, Log Normal, Student's t, Chi-Squared, Gamma, Beta.
-
- Jan 2016
-
courses.csail.mit.edu courses.csail.mit.edu
-
50 Years of Data Science, David Donoho<br> 2015, 41 pages
This paper reviews some ingredients of the current "Data Science moment", including recent commentary about data science in the popular media, and about how/whether Data Science is really di fferent from Statistics.
The now-contemplated fi eld of Data Science amounts to a superset of the fi elds of statistics and machine learning which adds some technology for 'scaling up' to 'big data'.
-
-
blogs.scientificamerican.com blogs.scientificamerican.com
-
P(B|E) = P(B) X P(E|B) / P(E), with P standing for probability, B for belief and E for evidence. P(B) is the probability that B is true, and P(E) is the probability that E is true. P(B|E) means the probability of B if E is true, and P(E|B) is the probability of E if B is true.
-
The probability that a belief is true given new evidence equals the probability that the belief is true regardless of that evidence times the probability that the evidence is true given that the belief is true divided by the probability that the evidence is true regardless of whether the belief is true. Got that?
-
Initial belief plus new evidence = new and improved belief.
-
-
-
This criterion is not based on any specific shape of the dose-response relationship.
I would expect that the relationship must be monotonic to support the causal hypothesis.
-
-
phys.org phys.org
-
paradox of unanimity - Unanimous or nearly unanimous agreement doesn't always indicate the correct answer. If agreement is unlikely, it indicates a problem with the system.
Witnesses who only saw a suspect for a moment are not likely to be able to pick them out of a lineup accurately. If several witnesses all pick the same suspect, you should be suspicious that bias is at work. Perhaps these witnesses were cherry-picked, or they were somehow encouraged to choose a particular suspect.
-
-
rpy2.readthedocs.org rpy2.readthedocs.org
-
Python interface to the R programming language.<br> Use R functions and packages from Python.<br> https://pypi.python.org/pypi/rpy2
-
- Oct 2015
-
cms.whittier.edu cms.whittier.edu
-
In 1930 its population was 112,000. Today it is 36,000. The halcyon talk of “interracial living” is dead. The neighborhood is 92 percent black. Its homicide rate is 45 per 100,000—triple the rate of the city as a whole. The infant-mortality rate is 14 per 1,000—more than twice the national average.
These are some intense statistics.. It'd be interesting to compare them to other cities in the area..
-
- Aug 2015
-
www.vox.com www.vox.com
-
What's really being measured is heterogeneity of opinion, not centrism.
-
- Jul 2015
-
www.eblida.org www.eblida.org
-
European Bureau of Libraries in Europe Public libraries- statistics
-
-
localhost:8080 localhost:8080
-
analyses
another, with tag
-
- Feb 2015
-
en.wikipedia.org en.wikipedia.org
-
The use of the term n − 1 is called Bessel's correction, and it is also used in sample covariance and the sample standard deviation (the square root of variance)
Why in \(\sigma^2\) is not equal to \(s^2\)
-
Sample variance can also be applied to the estimation of the variance of a continuous distribution from a sample of that distribution.
-
-
www.emathzone.com www.emathzone.com
-
Suppose the value of for wages is 10% and the values of for kilograms of meat is 25%. This means that the wages of workers are consistent. Their wages are close to the overall average of their wages. But the families consume meat in quite different quantities. Some families use very small quantities of meat and some others use large quantities of meat. We say that there is greater variation in their consumption of meat. The observations about the quantity of meat are more dispersed or more variant.
Interpretation of Relative Deviation Coefficient
-
- Nov 2013
-
cran.r-project.org cran.r-project.org
-
n its space-time representation (Ogata, 1998), the ETASmodel is a temporal marked point process model, and a special case of marked Hawks process, withconditional intensity function(t;x;yjHt) =(x;y) +Xti<tk(mi)g(tti)f(xxi;yyijmi)
Testing out PDF annotation that also include LaTeX rendered formulas.
-
-
www.plosone.org www.plosone.org
-
two cadavers
why two? For comparative purposes? Limited sample size?
-
- Sep 2013
-
rhetoric.eserver.org rhetoric.eserver.org
-
Hence the man who makes a good guess at truth is likely to make a good guess at probabilities
At first, I didn't like this quote, then I thought back to good ol' Oakley's stats class. We make scientific theories based on what idea is most likely to happen (we reject/do not reject the null hypothesis, but we do not say we accept the null hypothesis). Science: putting me in my place since I had a place to be put.
-