AB_2147781
DOI: 10.1186/s13287-025-04844-y
Resource: (DSHB Cat# MF 20, RRID:AB_2147781)
Curator: @scibot
SciCrunch record: RRID:AB_2147781
AB_2147781
DOI: 10.1186/s13287-025-04844-y
Resource: (DSHB Cat# MF 20, RRID:AB_2147781)
Curator: @scibot
SciCrunch record: RRID:AB_2147781
AB_528428
DOI: 10.1186/s13287-025-04844-y
Resource: (DSHB Cat# pax7, RRID:AB_528428)
Curator: @scibot
SciCrunch record: RRID:AB_528428
AB_2146601
DOI: 10.1186/s13287-025-04844-y
Resource: None
Curator: @scibot
SciCrunch record: RRID:AB_2146601
AB_2146602
DOI: 10.1186/s13287-025-04844-y
Resource: (DSHB Cat# F5D, RRID:AB_2146602)
Curator: @scibot
SciCrunch record: RRID:AB_2146602
RRID:CVCL_0480
DOI: 10.1038/s41598-025-34204-y
Resource: (ECACC Cat# 87092802, RRID:CVCL_0480)
Curator: @scibot
SciCrunch record: RRID:CVCL_0480
RRID:CVCL_0152
DOI: 10.1038/s41598-025-34204-y
Resource: (NCBI_Iran Cat# C558, RRID:CVCL_0152)
Curator: @scibot
SciCrunch record: RRID:CVCL_0152
RRID:SCR_001847
DOI: 10.1038/s41597-026-06591-y
Resource: FreeSurfer (RRID:SCR_001847)
Curator: @scibot
SciCrunch record: RRID:SCR_001847
RRID:SCR_010519
DOI: 10.1007/s00436-025-08620-y
Resource: Geneious (RRID:SCR_010519)
Curator: @scibot
SciCrunch record: RRID:SCR_010519
Cuantización vectorial residual [28] , inicializando el libro de códigos por medio de [28] , teniendo el libro de códigos en una dimensión inferior [29] , pérdida de regularización ortogonal en el libro de códigos [30] , cuantificación vectorial de múltiples cabezales [31] y códigos obsoletos que expiran [28] son algunos de estos trabajos. En este trabajo, utilizamos códigos obsoletos que expiraban para optimizar el libro de códigos y evitar su colapso.
Buscar trabajos
Author response:
The following is the authors’ response to the original reviews
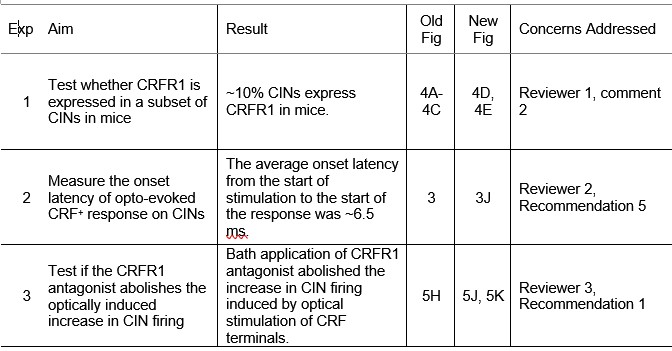
We appreciate the reviewers’ insightful comments. In response, we conducted three new experiments, summarized in Author response table 1. After the table, we provide detailed responses to each comment.
Author response table 1.
Summary of new experiments and results.
Reviewer #1 (Public review):
The authors show that corticotropin-releasing factor (CRF) neurons in the central amygdala (CeA) and bed nucleus of the stria terminalis (BNST) monosynaptically target cholinergic interneurons (CINs) in the dorsal striatum of rodents. Functionally, activation of CRFR1 receptors increases CIN firing rate, and this modulation was reduced by pre-exposure to ethanol. This is an interesting finding, with potential significance for alcohol use disorders, but some conclusions could use additional support.
Strengths:
Well-conceived circuit mapping experiments identify a novel pathway by which the CeA and BNST can modulate dorsal striatal function by controlling cholinergic tone. Important insight into how CRF, a neuropeptide that is important in mediating aspects of stress, affective/motivational processes, and drug-seeking, modulates dorsal striatal function.
Weaknesses:
(1) Tracing and expression experiments were performed both in mice and rats (in a mostly nonoverlapping way). While these species are similar in many ways, some conclusions are based on assumptions of similarities that the presented data do not directly show. In most cases, this should be addressed in the text (but see point number 2).
In the revised manuscript, we have clarified this limitation in the first paragraph of the Methods and the third paragraph of the Discussion and avoid cross-species claims, limiting our conclusions to the species in which each assay was performed. Specifically, we now state that while mice and rats share many conserved amygdalostriatal components, our tracing and expression studies were performed in a species-specific manner, and direct cross-species comparisons of CRF–CIN connectivity and CRFR1 expression were not assessed. We further note that future studies will be needed to determine the extent to which these observations are conserved across species as more tools become available.
(2) Experiments in rats show that CRFR1 expression is largely confined to a subpopulation of striatal CINs. Is this true in mice, too? Since most electrophysiological experiments are done in various synaptic antagonists and/or TTX, it does not affect the interpretation of those data, but non-CIN expression of CRFR1 could potentially have a large impact on bath CRF-induced acetylcholine release.
To address whether CRFR1 expression in striatal CINs is conserved across species, we performed new histological experiments using CRFR1-GFP mice. Striatal sections were immunostained with anti-ChAT, and we found that approximately 10% of CINs express CRFR1 (new Fig. 4D, 4E). This result indicates that, similar to rats, a subset of CINs in mice express CRFR1. However, the proportion of CRFR1<sup>+</sup> CINs is lower than the proportion of CRF-responsive CINs observed during electrophysiology experiments, suggesting that CRF may also modulate CIN activity indirectly through network or synaptic mechanisms. We have also noted in the revised Discussion that while CRFR1 expression is confirmed in a subset of CINs, the broader distribution of CRFR1 among other striatal cell types remains to be determined (third paragraph of Discussion).
In our study, bath application of CRF increased striatal ACh release. Because striatal ACh is released primarily from CINs, and CRFR1 is an excitatory receptor, this effect is most likely mediated by CRF activation of CRFR1 on CINs, leading to enhanced CIN activity and ACh release. Although CRFR1 may also be expressed on other striatal neurons, these cell types—medium spiny neurons and GABAergic interneurons—are inhibitory. If CRF were to activate CRFR1 on these GABAergic neurons, the resulting increase in GABA release would suppress CIN activity and consequently reduce, rather than enhance, ACh release. Given that most CINs responded functionally while only a small subset expressed CRFR1, these findings imply that indirect mechanisms, such as CRF modulation of local circuits influencing CIN excitability, may also contribute to the observed increase in ACh release. Together, these data support a model in which CRF primarily enhances ACh release via activation of CRFR1-expressing CINs, while indirect network effects may further amplify this response.
(3) Experiments in rats show that about 30% of CINs express CRFR1 in rats. Did only a similar percentage of CINs in mice respond to bath application of CRF? The effect sizes and error bars in Figure 5 imply that the majority of recorded CINs likely responded. Were exclusion criteria used in these experiments?
We thank the reviewer for this insightful question. In our mouse cell-attached recordings, ~80% of CINs increased firing during CRF bath application, and all recorded cells were included in the analysis (no exclusions based on response direction/magnitude; cells were only required to meet standard recording-quality criteria such as stable baseline firing and seal).
Using a CRFR1-GFP reporter mouse, we found that ~10% of striatal CINs are GFP+, suggesting that the high proportion of CRF-responsive CINs cannot be explained solely by somatic reporter-labeled CRFR1 expression. Importantly, the CRF-induced increase in CIN firing is blocked by the selective CRFR1 antagonist NBI 35695 (Fig. 5B–C), supporting a CRFR1-dependent mechanism at the circuit level. We now discuss several non-mutually exclusive explanations for this apparent discrepancy: (i) reporter lines (e.g., CRFR1-GFP) may underestimate functional CRFR1 expression, particularly for low-level or compartmentalized receptor pools; (ii) bath-applied CRF may act indirectly via CRFR1 on presynaptic afferents, thereby enhancing excitatory drive onto CINs; and (iii) electrical coupling among CINs could allow direct effects in a subset of CINs to propagate through the CIN network (Ren, Liu et al. 2021). We added this discussion to the revised manuscript (fourth paragraph of the Discussion).
(4) The conclusion that prior acute alcohol exposure reduces the ability of subsequent alcohol exposure to suppress CIN activity in the presence of CRF may be a bit overstated. In Figure 6D (no ethanol preexposure), ethanol does not fully suppress CIN firing rate to baseline after CRF exposure. The attenuated effect of CRF on CIN firing rate after ethanol pre-treatment (6E) may just reduce the maximum potential effect that ethanol can have on firing rate after CRF, due to a lowered starting point. It is possible that the lack of significant effect of ethanol after CRF in pre-treated mice is an issue of experimental sensitivity. Related to this point, does pre-treatment with ethanol reduce the later CIN response to acute ethanol application (in the absence of CRF)?
In the revised manuscript, we have tempered our interpretation in the final Results section and throughout the Discussion to emphasize that ethanol pre-exposure attenuates, rather than abolishes, the CRFinduced increase in CIN firing. We also note the reviewer’s important point that in Figure 6D, ethanol does not fully suppress firing to baseline after CRF exposure, consistent with a partial effect. Regarding the reviewer’s question, our experiments were specifically designed to test interactions between CRF and ethanol, so we did not assess whether ethanol pre-treatment alters subsequent responses to ethanol alone. We now explicitly acknowledge CRF-dependent and CRF-independent effects of ethanol on CIN activity as an important point for future studies to disentangle (sixth paragraph of the Discussion). For example, comparing ethanol responses with and without prior ethanol without any treatment with CRF could resolve this question.
(5) More details about the area of the dorsal striatum being examined would be helpful (i.e., a-p axis).
We now provide more detail regarding the anterior–posterior axis of the dorsal striatum examined. Most recordings and imaging were performed in the posterior dorsomedial striatum (pDMS), corresponding to coronal slices posterior to the crossing of the anterior commissure and anterior to the tail of the striatum (starting around 0.62 mm and ending at −1.3 mm relative to the Bregma). While our primary focus was on posterior slices, some anterior slices were included to increase the sample size. These details have been added to the Methods (Last sentence of the ‘Histology and cell counting’ section and of the ‘Slice electrophysiology’ section).
Reviewer #2 (Public review):
Essoh and colleagues present a thorough and elegant study identifying the central amygdala and BNST as key sources of CRF input to the dorsal striatum. Using monosynaptic rabies tracing and electrophysiology, they show direct connections to cholinergic interneurons. The study builds on previous findings that CRF increases CIN firing, extending them by measuring acetylcholine levels in slices and applying optogenetic stimulation of CRF+ fibers. It also uncovers a novel interaction between alcohol and CRF signaling in the striatum, likely to spark significant interest and future research.
Strengths:
A key strength is the integration of anatomical and functional approaches to demonstrate these projections and assess their impact on target cells, striatal cholinergic interneurons.
Weaknesses:
(1) The nature of the interaction between alcohol and CRF actions on cholinergic neurons remains unclear. Also, further clarification of the ACh sensor used and others is required
We have clarified the nature of the interaction between alcohol and CRF signaling in CINs and have provided additional details regarding the acetylcholine sensor used. These issues are addressed in detail in our responses to the specific comments below.
Reviewer #2 (Recommendations for the authors):
(1) The interaction between the effects of alcohol and CRF is a novel and important part of this study. When considering possible mechanisms underlying the findings in the discussion, there is no mention of occlusion. Given that incubation with alcohol produced a similar increase in firing of CINs as CRF, occlusion could be a parsimonious explanation for the observed interaction. Have the author considered blocking the effects of alcohol on CIN with CRF-R1 antagonist? Another experiment that could address the occlusion would be to test if alcohol also increases ACh levels as it did CRF.
We thank the reviewer for proposing occlusion as a potential mechanism underlying the interaction between alcohol and CRF. We agree that, in principle, alcohol-induced endogenous CRF release could occlude subsequent exogenous CRF-mediated potentiation of CIN firing, and we carefully considered this possibility.
However, several observations from our data argue against occlusion driven by acute alcohol exposure or withdrawal in this preparation. First, as shown in Fig. 6A, bath application of alcohol transiently reduced CIN firing, and firing recovered to baseline levels after washout without any rebound increase. Second, in Fig. 6D–E, the baseline firing rates under control conditions and following alcohol pretreatment were comparable, indicating that acute alcohol exposure and short-term withdrawal did not produce a sustained increase in CIN excitability. Together, these results suggest that acute withdrawal in slices is less likely to trigger substantial endogenous CRF release capable of occluding subsequent exogenous CRF effects.
While we and others have previously reported increased spontaneous CIN firing following prolonged in vivo alcohol exposure and extended withdrawal periods (e.g., 21 days), short-term withdrawal (e.g., 1 day) does not robustly alter baseline CIN firing (Ma, Huang et al. 2021, Huang, Chen et al. 2024). Consistent with these prior findings, the absence of a rebound or elevated baseline firing in the present slice experiments discouraged further pursuit of an endogenous CRF occlusion mechanism under acute conditions.
We also considered experimentally testing occlusion by blocking CRFR1 signaling during alcohol pre-treatment. However, this approach is technically challenging in slice recordings, as CRFR1 antagonists require prolonged incubation (~1 hour) during alcohol exposure. Because it is unclear whether endogenous CRF release is triggered by alcohol incubation itself or by withdrawal, the antagonist would need to remain present throughout both the incubation and withdrawal periods. This leaves insufficient time for complete washout of the CRFR1 antagonist prior to subsequent bath application of exogenous CRF to assess its effects on CIN firing. Consequently, residual antagonist presence would confound the interpretation of the exogenous CRF response.
Finally, regarding the possibility that alcohol increases acetylcholine release, we did not observe alcohol-induced increases in CIN firing in slices, arguing against elevated ACh signaling under these conditions. Consistent with prior work (Ma, Huang et al. 2021, Huang, Chen et al. 2024), alcohol-induced increases in CIN excitability and cholinergic signaling appear to depend on prolonged in vivo exposure and extended withdrawal rather than acute slice-level manipulations.
We have now incorporated discussion of occlusion as a potential mechanism (seventh paragraph) and clarified why our data and technical considerations argue against it in the present study. We thank the reviewer for this wonderful suggestion, which we will test in future in vivo studies.
(2) Retrograde monosynaptic tracing of inputs to CIN. Results state the finding of labeling in all previously reported area..." Can the authors report these areas? A list in the text or a bar plot, if there is quantification, will suffice. This formation will serve as important validation and replication of previous findings.
We thank the reviewer for this constructive suggestion. We agree that summarizing the anatomical sources of CIN input provides important validation of our tracing results. In the revised Results, we now list the major input regions observed, including the striatum itself, cortex (e.g., cingulate cortex, motor cortex, somatosensory cortex), thalamus (e.g., parafascicular thalamic nucleus, centrolateral thalamic nucleus), globus pallidus, and midbrain (first paragraph of the Results). Quantitative analysis of relative input strength will be presented in a separate study that expands on these findings. Here, we limit the current manuscript to the functional characterization of CRF and alcohol modulation of CINs.
(3) Given the difference in connectivity among striatal subregions, it would be important to describe in more detail the injection site in the results and figures. In the figure, for example, you might want to include the AP coordinates, given that it is such a zoomed-in image, it is hard to tell how anterior/posterior the site is. I imagine that the picture is a representative image of the injection site, but maybe having a side image with overlay of injection sites in all the animals used, would help.
The anterior–posterior (AP) coordinates for representative images have been included in the panels and reiterated more clearly in the revised Results section and figure legends. In the legend for Figure 3B, a list of AP coordinates for each animal used for Figure 3A-3E has been added.
(4) Figure 1D inset, there seem to be some double-labeled cells in the zoomed in BNST images. The authors might want to comment on this. It seemed far from the injection site. Do D1-MSN so far away show connectivity to CINs?
Upon closer inspection of the BNST images, we noted a small number of double-labeled cells were indeed present, consistent with prior reports that a subset of D1R-expressing neurons (~10%) has been reported previously in our lab in the BNST, with the majority being D2R-expressing neurons (Lu, Cheng et al. 2021). Given the BNST’s anatomical proximity to the dorsal striatum, it is plausible that some D1Rexpressing neurons in this region provide monosynaptic input to CINs, highlighting a potential ventral-to-dorsal connection that merits further study.
(5) Can the author provide quantification of the onset delay of the optogenetic evoked CRF+ axon responses onto CINs? The claim of monosynaptic connectivity is well supported by the TTX/4AP experiment but additional information on the timing will strengthen that conclusion.
We thank the reviewer for this insightful suggestion. Quantifying the onset latency of optogenetically evoked CRFMsup+</sup> axon responses onto CINs provides valuable confirmation of monosynaptic connectivity. To address this, we performed new latency measurements under the same recording conditions as the TTX/4-AP experiments. The average onset latency from the start of the optical stimulation was 5.85 ± 0.37 ms (new Figure 3J), consistent with direct monosynaptic transmission.
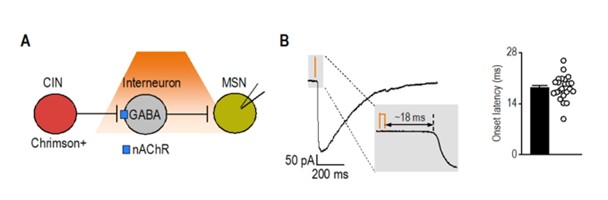
As an additional reference, we analyzed latency data from a separate project in which we optogenetically stimulated cholinergic interneurons and recorded synaptic responses in medium spiny neurons. This circuit, known to involve disynaptic transmission from CINs to MSNs via nAChR-expressing interneurons (Autor response image 1) (English, Ibanez-Sandoval et al. 2011), exhibited a significantly longer latency (18.34 ± 0.70 ms; t<sub>(29)</sub> = 10.3, p < 0.001) compared to CRF⁺ CeA/BNST inputs to CINs (5.85 ± 0.37 ms). Together, these results further support that CRF⁺ axons form direct functional synapses onto CINs.
Author response image 1.
Latency of disynaptic transmission from CINs to MSNs via interneurons A) Schematic illustrating optogenetic stimulation of Chrimson-expressing CINs, leading to excitation of nAChRexpressing interneurons that release GABA onto recorded MSNs. B) Sample trace of disynaptic transmission (left) and bar graph summarizing onset latency (right) from light stimulation to synaptic response onset (n = 23 neurons from 3 mice).
(6) The ACh sensor reported is "AAV-GRABACh4m" but the reference is for GRAB-ACh3.0. Also, BrainVTA has GRAB-ACh4.3. Is this the vector? Could you please check the name of the construct and report the corresponding reference, as well as clarify the meaning of the additional "m". They have a mutant version of the GRAB-ACH that researchers use for control, and of course, you want to use it as a control, but not for the test experiment.
GRAB-ACh4m is the correct acetylcholine sensor used in this study. The ACh4 series (including ACh4h, ACh4m, and ACh4l; personal communication with Dr. Yulong Li’s lab) represents an updated generation following GRAB-ACh3.0. Although the ACh4 family has not yet been formally published, these constructs are publicly available through BrainVTA (https://www.brainvta.tech/plus/view.php?aid=2680).
The suffix “m” does not indicate a mutant control; rather, it denotes a medium-affinity variant within the ACh4 sensor family. Importantly, the mutant (non-responsive) control sensor is only available for GRAB-ACh3.0 (ACh3.0mut) and does not exist for the ACh4 series.
Our laboratory has previously used GRAB-ACh4m in multiple peer-reviewed publications (Huang, Chen et al. 2024, Gangal, Iannucci et al. 2025, Purvines, Gangal et al. 2025), and its use has also been reported by independent groups in recent preprints (Potjer, Wu et al. 2025, Touponse, Pomrenze et al. 2025). We have now clarified the construct name, its relationship to GRAB-ACh3.0, in the Methods ‘Reagents’ section, and we have corrected the reference accordingly.
(7) Are CRF-R1+ CINs equally abundant in the DMS and DLS? From the image in Figure 4, it seems that a larger percentage of CINs are CRFR1+ in the DLS than in DMS. Is this true? The authors probably already have this data, or it should be easy to get, and it could be additional information that was not studied before.
We did not perform a quantitative comparison of CRFR1+ CIN abundance between the DMS and DLS in the present study. While the representative images in Figure 4 may appear to suggest regional differences, these panels were selected to illustrate labeling quality rather than relative density and should not be interpreted as evidence of unequal distribution. We have clarified this point in the revised Discussion (last sentence of the third paragraph) and note that future studies will be needed to systematically evaluate potential regional differences in CRFR1 expression, which could have important implications for dorsal striatal function.
(8) The manuscript states several times that there are no CRF+ neurons in the dorsal striatum. At the same time, there are reports of the CRF+ neuron in the ventral striatum and its role in learning. Could the authors include mention of the studies by the Lemos group (10.1016/j.biopsych.2024.08.006)
We have revised the Discussion section to clarify that our findings pertain specifically to the dorsal striatum and now acknowledge the presence and functional relevance of CRF+ neurons in the ventral striatum, citing the Lemos group’s study (fifth paragraph of the Discussion).
(9) For the histology analysis, please express cell counts as "density", not just number of cells, by providing an area (e.g., "number of cell/ µm2").
In the revised manuscript, all histological outcomes have been recalculated as cell density (cells/mm<sup>2</sup>) by normalizing raw cell counts to the measured area of each region of interest (ROI). Figures that previously displayed absolute counts now present densities (cells/mm<sup>2</sup>), with corresponding updates made to figure legends and text. We note one exception in Figure 4B, where the comparison between the total number of CINs and CRFR1+ CINs is best represented as cell counts rather than normalized values, as the counting was conducted in the same area (within the same ROI) of the dorsostriatal subregion.
(10) Figure 2C, we can see there are some labeled fibers in the striatum cut. Would it be possible to get a better confocal image?
Figure 2C has been replaced with a higher-quality confocal image captured at the same magnification and scale. The updated image provides improved clarity and resolution, ensuring accurate visualization of labeled CRF+ fibers, but not cell bodies, within the striatum.
(11) The ACh measurements in the slice are very informative and an important addition. I first thought that these experiments with the GRAB-ACh sensor were performed in ChAT-eGFP mice. After reading more carefully, I realized they were done in wild-type mice. Would you include the wildtype label in the figure as well? The ChATeGFP BAC transgenic line was reported to have enhanced ACh packaging and increased ACh release, which could have magnified the signals. So, it is important to highlight the experiments were done in wildtype mice.
We now label with ‘WT mice’ and note in the legend that all GRAB-ACh experiments were performed in wild-type mice, not ChAT-eGFP, to avoid confounds in ACh release. We thank the reviewer for this important suggestion.
Reviewer #3 (Public review):
The authors demonstrate that CRF neurons in the extended amygdala form GABAergic synapses onto cholinergic interneurons and that CRF can excite these neurons. The evidence is strong, however, the authors fail to make a compelling connection showing CRF released from these extended amygdala neurons is mediating any of these effects. Further, they show that acute alcohol appears to modulate this action, although the effect size is not particularly robust.
Strengths:
This is an exciting connection from the extended amygdala to the striatum that provides a new direction for how these regions can modulate behavior. The work is rigorous and well done.
Weaknesses:
(1) While the authors show that opto stim of these neurons can increase firing, this is not shown to be CRFR1 dependent. In addition, the effects of acute ethanol are not particularly robust or rigorously evaluated. Further, the opto stim experiments are conducted in an Ai32 mouse, so it is impossible to determine if that is from CEA and BNST, vs. another population of CRF-containing neurons. This is an important caveat.
We added recordings with the CRFR1 antagonist antalarmin. Light-evoked increases in CIN firing were abolished under CRFR1 blockade, linking the effect to CRFR1 (Figure 5J, 5K). We also clarify that CRFCre;Ai32 does not isolate CeA versus BNST sources, so we temper regional claims and highlight this as a limitation. The acute ethanol effects are modest but consistent; we expanded the discussion of dose and preparation constraints in acute slice physiology and note that in vivo studies will be needed to define the network-level impact.
Reviewer #3 (Recommendations for the authors):
(1) The authors could bring some of this data together by examining CRFR1 dependence of optical stimulationinduced increases in firing. Further, the authors have devoted significant effort to exploring how the BNST and CEA project to the CIN, yet their ephys does not explore site-specific infusion of ChR2 into either region. How are we to be sure it is not some other population of CRF neurons mediating this effect? The alcohol data does not appear particularly robust, but I think if the authors wanted to, they could explore other concentrations. Mostly I think it is important to discuss the limitations of acute alcohol on 5a brain slice.
We thank the reviewer for these thoughtful comments, which helped us strengthen the mechanistic interpretation of the CRF-CIN interaction. In the revised manuscript, we have addressed each point as follows:
- CRFR1 dependence of optogenetically evoked responses: We performed new recordings in which optogenetic stimulation of CRF⁺ terminals in the dorsal striatum was conducted in the presence of the CRFR1 antagonist antalarmin. The increase in CIN firing evoked by light stimulation was abolished under CRFR1 blockade, confirming that this effect is mediated through CRFR1 activation (new Figure 5J, 5K, third paragraph of the corresponding Result section). These results directly link the functional effects of CRF⁺ terminal activation to CRFR1 signaling on CINs.
- CeA vs. BNST projection specificity: The reviewer is correct that CeA and BNST projections were not analyzed separately. As unknown pathways, our experiment was designed to first establish the monosynaptic connections between CeA/BNST CRF neurons to striatal CINs. Future studies would further explore the specific contribution of each site. However, our data exclude the possibility of other CRF neurons as we selectively infused Cre-dependent opsins into both CeA and BNST of CRF-Cre mice (Figure 3G-3J).
- Limitations of acute slice experiments: We have expanded the Discussion (sixth paragraph) to acknowledge that acute slice physiology cannot fully capture the dynamic and network-level effects of ethanol observed in vivo. While this preparation enables mechanistic precision, factors such as washout, diffusion constraints, and the absence of systemic feedback may underestimate ethanol’s impact on CINs. We now explicitly note this limitation and highlight the need for in vivo studies to examine behavioral and circuit-level implications of CRF–alcohol interactions.
Collectively, these revisions clarify the CRFR1 dependence of CRF<sup>+</sup> terminal effects and reaffirm that both CeA and BNST projections contribute to CIN modulation while addressing the methodological limitations of the slice preparation.
Reviewer #4 Public Review):
This manuscript presents a compelling and methodologically rigorous investigation into how corticotropin-releasing factor (CRF) modulates cholinergic interneurons (CINs) in the dorsal striatum - a brain region central to cognitive flexibility and action selection-and how this circuit is disrupted by alcohol exposure. Through an integrated series of anatomical, optogenetic, electrophysiological, and imaging experiments, the authors uncover a previously uncharacterized CRF⁺ projection from the central amygdala (CeA) and bed nucleus of the stria terminalis (BNST) to dorsal striatal CINs.
Strengths:
Key strengths of the study include the use of state-of-the-art monosynaptic rabies tracing, CRF-Cre transgenic models, CRFR1 reporter lines, and functional validation of synaptic connectivity and neurotransmitter release. The finding that CRF enhances CIN excitability and acetylcholine (ACh) release via CRFR1, and that this effect is attenuated by acute alcohol exposure and withdrawal, provides important mechanistic insight into how stress and alcohol interact to impair striatal function. These results position CRF signaling in CINs as a novel contributor to alcohol use disorder (AUD) pathophysiology, with implications for relapse vulnerability and cognitive inflexibility associated with chronic alcohol intake. The study is well-structured, with a clear rationale, thorough methodology, and logical progression of results. The discussion effectively contextualizes the findings within broader addiction neuroscience literature and suggests meaningful future directions, including therapeutic targeting of CRFR1 signaling in the dorsal striatum.
Weaknesses:
(1) Minor areas for improvement include occasional redundancy in phrasing, slightly overlong descriptions in the abstract and significance sections, and a need for more concise language in some places. Nevertheless, these do not detract from the manuscript's overall quality or impact. Overall, this is a highly valuable contribution to the fields of addiction neuroscience and striatal circuit function, offering novel insights into stress-alcohol interactions at the cellular and circuit level, which requires minor editorial revisions.
We have streamlined the abstract and significance statement, reduced redundancy, and improved conciseness throughout the text. We appreciate the reviewer’s feedback, which has helped us further strengthen the clarity and readability of the manuscript.
Reviewer #4 (Recommendations for the authors):
(1) Line 29-30: Slightly verbose. Consider: "Alcohol relapse is associated with corticotropin-releasing factor (CRF) signaling and altered reward pathway function, though the precise mechanisms are unclear."
The sentence has been revised as recommended to improve clarity and conciseness in the introductory section (Lines 31-32).
(2) Lines 39-43: Good synthesis, but could better emphasize the novelty of identifying a CRF-CIN pathway.
The abstract has been revised to more clearly emphasize the novelty of identifying a CRF-CIN pathway and its functional significance (Line 42-43).
(3) Lines 66-68: Consider integrating clinical relevance more directly, e.g., "AUD affects over 14 million adults in the U.S., with relapse often triggered by stress...".
The introduction has been revised to more directly emphasize the clinical relevance of alcohol use disorder, including its high prevalence and the role of stress in relapse, thereby underscoring the translational significance of our findings (Lines 68-69).
(4) Line 83: Repetition of "goal-directed learning, habit formation, and behavioral flexibility" appears multiple times; consider variety.
We have varied the phrasing in the Introduction to avoid redundancy. Specifically, in place of repeating “goal-directed learning, habit formation, and behavioral flexibility,” we now use alternative terms such as “action selection,” “habitual responding,” and “cognitive flexibility,” depending on the context.
(5) Lines 107-116: Clarify why both rats and mice were used-do they serve different experimental purposes?
We now explain that each species was used for complementary experimental purposes. Rats were used for histological validation of CRFR1 expression using the CRFR1-Cre-tdTomato line, which has been extensively characterized in this species. Mice were used for the majority of electrophysiological, optogenetic, and GRAB-ACh sensor experiments due to the availability of well-established transgenic CRF-Cre-driver lines. This division allowed us to leverage the most appropriate tools in each species to address different aspects of the study. We have clarified this rationale in the Methods (first paragraph of the “Animals” section) and Discussion (third paragraph).
(6) Electrophysiology section: The distinction between acute exposure vs. withdrawal could be further emphasized.
To better highlight the distinction between acute alcohol exposure and withdrawal, we have clarified the timing and context of each condition within the Results section for Figure 6. Specifically, we now distinguish the immediate suppressive effects of alcohol observed during bath application (acute exposure) from the subsequent changes in CIN firing measured after washout (withdrawal). These revisions clarify the temporal dynamics and functional implications of CRF–alcohol interactions in our experimental design.
(7) Lines 227-229: Reword for clarity: "Significantly more BNST neurons projected to CINs compared to the CeA...".
The sentence has been reworded to clarify as recommended (Lines 247-248).
(8) Lines 373-374: Consider connecting the CRF-CIN circuit to behavioral inflexibility in AUD more directly.
We have modified the sentence (Lines 390-395) to more explicitly link alcohol-induced dysregulation of the CRF–CIN circuit to behavioral inflexibility in AUD, consistent with the established role of CINs in action selection and cognitive flexibility.
(9) Lines 387-389: This is an excellent point about stress resilience; consider expanding with examples or potential implications.
We thank the reviewer for this insightful suggestion. In the revised Discussion (sixth paragraph), we expanded this section to more directly connect alcohol-induced disruption of CRF–CIN signaling with impaired stress resilience and behavioral inflexibility. Specifically, we now note that such dysregulation may compromise stress resilience mechanisms mediated by CRF–cholinergic interactions in the striatum and related corticostriatal circuits. We further discuss how impaired CIN responsiveness could blunt adaptive behavioral adjustments under stress, biasing animals toward habitual or compulsive alcohol seeking. This addition highlights the broader implication that alcohol-induced alterations in CRF–CIN signaling may contribute to relapse vulnerability by undermining adaptive stress coping.
References
English, D. F., O. Ibanez-Sandoval, E. Stark, F. Tecuapetla, G. Buzsaki, K. Deisseroth, J. M. Tepper and T. Koos (2011). "GABAergic circuits mediate the reinforcement-related signals of striatal cholinergic interneurons." Nat Neurosci 15(1): 123–130.
Gangal, H., J. Iannucci, Y. Huang, R. Chen, W. Purvines, W. T. Davis, A. Rivera, G. Johnson, X. Xie, S. Mukherjee, V. Vierkant, K. Mims, K. O'Neill, X. Wang, L. A. Shapiro and J. Wang (2025). "Traumatic brain injury exacerbates alcohol consumption and neuroinflammation with decline in cognition and cholinergic activity." Transl Psychiatry 15(1): 403.
Huang, Z., R. Chen, M. Ho, X. Xie, H. Gangal, X. Wang and J. Wang (2024). "Dynamic responses of striatal cholinergic interneurons control behavioral flexibility." Sci Adv 10(51): eadn2446.
Lu, J. Y., Y. F. Cheng, X. Y. Xie, K. Woodson, J. Bonifacio, E. Disney, B. Barbee, X. H. Wang, M. Zaidi and J. Wang (2021). "Whole-Brain Mapping of Direct Inputs to Dopamine D1 and D2 Receptor-Expressing Medium Spiny Neurons in the Posterior Dorsomedial Striatum." Eneuro 8(1).
Ma, T., Z. Huang, X. Xie, Y. Cheng, X. Zhuang, M. J. Childs, H. Gangal, X. Wang, L. N. Smith, R. J. Smith, Y. Zhou and J. Wang (2021). "Chronic alcohol drinking persistently suppresses thalamostriatal excitation of cholinergic neurons to impair cognitive flexibility." J Clin Invest 132(4): e154969.
Potjer, E. V., X. Wu, A. N. Kane and J. G. Parker (2025). "Parkinsonian striatal acetylcholine dynamics are refractory to L-DOPA treatment." bioRxiv.
Purvines, W., H. Gangal, X. Xie, J. Ramos, X. Wang, R. Miranda and J. Wang (2025). "Perinatal and prenatal alcohol exposure impairs striatal cholinergic function and cognitive flexibility in adult offspring." Neuropharmacology 279: 110627.
Ren, Y., Y. Liu and M. Luo (2021). "Gap Junctions Between Striatal D1 Neurons and Cholinergic Interneurons." Front Cell Neurosci 15: 674399.
Touponse, G. C., M. B. Pomrenze, T. Yassine, V. Mehta, N. Denomme, Z. Zhang, R. C. Malenka and N. Eshel (2025). "Cholinergic modulation of dopamine release drives effortful behavior." bioRxiv.
y, w, dlgA40.2
DOI: 10.3390/ijms23169187
Resource: Bloomington Drosophila Stock Center (RRID:SCR_006457)
Curator: @bdscstockkeepers
SciCrunch record: RRID:SCR_006457
y, w, dlgS975
DOI: 10.3390/ijms23169187
Resource: Bloomington Drosophila Stock Center (RRID:SCR_006457)
Curator: @bdscstockkeepers
SciCrunch record: RRID:SCR_006457
y, w, dlgXI-2
DOI: 10.3390/ijms23169187
Resource: Bloomington Drosophila Stock Center (RRID:SCR_006457)
Curator: @bdscstockkeepers
SciCrunch record: RRID:SCR_006457
(y[1]w;PBac{HpaI-GFP.A}MhcYD0783)
DOI: 10.1242/bio.059376
Resource: Bloomington Drosophila Stock Center (RRID:SCR_006457)
Curator: @bdscstockkeepers
SciCrunch record: RRID:SCR_006457
(y[1]v[1];P{y[+t7.7]v[+t1.8]=TRiP.JF03047}attP2)
DOI: 10.1242/bio.059376
Resource: Bloomington Drosophila Stock Center (RRID:SCR_006457)
Curator: @bdscstockkeepers
SciCrunch record: RRID:SCR_006457
(y[1]v[1]; P{TRiP.JF02077}attP2)
DOI: 10.1242/bio.059376
Resource: Bloomington Drosophila Stock Center (RRID:SCR_006457)
Curator: @bdscstockkeepers
SciCrunch record: RRID:SCR_006457
RRID:SCR_016202
DOI: 10.1038/s41422-026-01222-y
Resource: HIRN Human Pancreas Analysis Program (RRID:SCR_016202)
Curator: @scibot
SciCrunch record: RRID:SCR_016202
cada vez son menos las sociedades en las que importa la tradición oral
La tradición oral por mucho tiempo ha sido la principal manera de transmitir las historias y el conocimiento. En la época actual, como se menciona en el texto, esta práctica ha disminuido drásticamente con la llegada de la escritura y aún más con la llegada de las nuevas tecnologías. Me parece curioso pensar cómo se transmitía el conocimiento de manera oral. Las personas y la humanidad en general no solo dependían de sus habilidades o inteligencia, sino también de su memoria. El cerebro tiene una capacidad enorme para almacenar datos y procesar información, pero tiene ciertas limitaciones a la hora de reproducir la información o almacenarla más allá del periodo de vida de un individuo. Es por lo anterior que la escritura revolucionó por completo la manera en la que la tecnología avanza, el conocimiento ya no se construía a lo largo de los años, se acumulaba generación tras generación. Personalmente creo que esto es un arma de doble filo ya que se puede perder cierta capacidad cognitiva al no usar con la misma frecuencia o intensidad todas las conexiones neuronales que tenemos. Por otro lado, la tradición oral creo que es algo inherente a la especie humana. Por más tecnología que exista no vamos a dejar de contar historias o transmitir conocimientos de la misma manera, solo que la dinámica cambia un poco.
Todo estaría por ahí, en papel o en piedra, listo para consultarse cuando se nos diera la gana.
Esta frase me parece un resumen muy claro de lo que para mí es la inteligencia artificial. A través del texto y sus supervínculos, entiendo la IA como una gran base de datos siempre disponible, lista para ser consultada cuando se nos da la gana. En ese sentido, la inteligencia artificial no filtra la información ni distingue necesariamente entre lo verdadero y lo falso, sino que ofrece lo que tiene a su disposición. No importa quién produjo la información ni de dónde proviene, porque todo está ahí, accesible para ser consultado. Esta idea se complementa con el fragmento que plantea que la inteligencia artificial no es una tecnología utópica ni distópica, sino una tecnología más, con usos, aplicaciones y consecuencias, pero que no transformará a la sociedad de pies a cabeza. Desde esta perspectiva, la IA se parece a algo que alguien escribió alguna vez en una piedra, solo que hoy todos tenemos acceso a esas “piedras”, lo que hace que el conocimiento esté al alcance de cualquiera. Además, el texto me invita a reflexionar sobre mi propia relación con la inteligencia artificial. Me hace pensar que soy yo quien decide cómo usarla y con qué propósito, y que depende de mí si la convierto en una herramienta o en algo de lo que termino dependiendo. Sara Castillo Valderrama
Ser joven y campesine al mismo tiempo
Desigualdades y más si mujer u originarie
Analyse Approfondie du Conflit : Stratégies, Bénéfices et Psychologie
Ce document synthétise une analyse approfondie de la nature des disputes, s'éloignant de la perception traditionnelle du conflit comme étant purement négatif.
La thèse centrale est que le conflit, loin d'être un obstacle au bien-être, est un phénomène naturel et un moteur essentiel de développement personnel, relationnel et sociétal.
Son caractère constructif ou destructeur dépend entièrement de la manière dont il est géré.
Les points clés révèlent que la maîtrise du conflit repose sur la régulation émotionnelle, l'application de techniques de communication spécifiques et une volonté de remettre en question ses propres certitudes.
Les bénéfices d'une dispute bien menée sont multiples : elle permet * d'affirmer ses valeurs, de poser des limites, * de renforcer les liens en créant un sentiment d'appartenance et de confiance, * et même de stimuler l'excellence en milieu professionnel.
La gestion efficace des émotions, notamment le stress et la colère, est fondamentale.
Des stratégies comme la reconnaissance de ses émotions, le recadrage de la montée d'adrénaline en énergie positive et des techniques d'ancrage physique sont des outils puissants.
L'analyse met également en lumière l'influence déterminante des expériences de l'enfance sur notre rapport adulte au conflit, soulignant que des schémas de communication peuvent être consciemment modifiés.
Enfin, des méthodes concrètes pour désamorcer les tensions et dialoguer, même avec des interlocuteurs aux opinions radicalement opposées, sont présentées, insistant sur l'importance de présumer la bonne foi et de rechercher des solutions communes.
--------------------------------------------------------------------------------
La compréhension psychologique du conflit a radicalement changé.
Si elle a longtemps prôné l'évitement des disputes, considérées comme nuisibles au bien-être, la perspective moderne est tout autre.
• Vision Traditionnelle vs. Moderne :
◦ Anciennement : La psychologie défendait l'idée qu'il fallait "éviter les conflits autant que possible".
Le bonheur était assimilé à l'absence de conflit.
◦ Aujourd'hui : Le conflit est considéré comme "tout à fait naturel".
Ce qui est déterminant n'est pas le conflit en soi, mais "la façon dont on se dispute".
• Le Conflit comme Moteur Social :
◦ Le sociologue Georg Simmel est cité pour affirmer que "le conflit est ce qui fait bouger une société".
◦ L'harmonie et le consensus total mènent à la stagnation : "quand on vient en harmonie et qu'on est tous du même avis, il ne se passe rien, tout se met à l'arrêt".
◦ Éviter systématiquement la confrontation ne résout pas les problèmes sous-jacents, qui continuent de "s'aggraver jusqu'à ce que plus rien ne puisse sauver le couple".
Lorsqu'il est abordé de manière saine, le conflit devient une source de force et de croissance à plusieurs niveaux.
• Développement Personnel :
◦ Affirmation de soi : Une dispute est une occasion "d'affirmer ses propres valeurs, poser ses limites et savoir qui on est".
Même sans solution, elle permet de "s'exprimer" et de "formuler son opinion à haute voix".
◦ Connaissance de soi : La confrontation peut mener à une meilleure connaissance de soi-même et des autres.
Andj, musicien de punk hardcore, témoigne qu'une "confrontation violente avec ses parents" lui a permis de mieux se connaître et de les voir sous un autre jour, améliorant considérablement leurs relations.
• Renforcement des Relations :
◦ Création de liens : Le conflit peut paradoxalement créer un "sentiment d'appartenance" lorsqu'on réalise qu'on est finalement d'accord avec l'autre sur certains points.
◦ Signe de confiance : Une première dispute avec une nouvelle connaissance peut "briser la glace".
Andj déclare : "je ne me dispute qu'avec les personnes qui comptent pour moi [...] si j'ai une confrontation avec quelqu'un, ça veut dire que je tiens à cette relation".
◦ Évolution commune : Le plus grand bonheur réside dans le fait que l'autre "n'a pas pris la fuite" et a surmonté l'épreuve ensemble, ce qui "nous a fait évoluer ensemble".
• Efficacité Professionnelle :
◦ En management, des équipes "un peu trop harmonieuses" où la critique constructive est absente n'atteignent qu'un "résultat moyen".
◦ Pour "atteindre l'excellence, on a besoin du conflit".
La clé d'une dispute constructive réside dans la capacité à gérer le flux d'émotions intenses qu'elle génère.
• La Nature des Émotions en Conflit :
◦ La dispute est décrite comme un "grand tsunami émotionnel".
◦ Les émotions proviennent de trois sources :
1. L'objet direct de la dispute.
2. Les "émotions coptées" : stress ou frustration accumulés durant la journée.
3. Les émotions de la petite enfance.
• Stratégies de Régulation Émotionnelle :
◦ Reconnaissance et acceptation : La première étape est de reconnaître ses émotions ("oui je suis en colère et c'est légitime").
Le simple fait d'accepter et d'accueillir mentalement le stress "le réduit déjà de 30 %".
◦ Recadrage cognitif : Il est possible de "requalifier ce sentiment" et de voir la montée d'adrénaline comme un "surcroix d'énergie" positif.
Cette technique, enseignée en négociation, peut réduire la tension de 40 % supplémentaires.
◦ Ancrage physique : En cas de confusion mentale ou émotionnelle, il est important de "sentir le sol sous mes pieds" pour retrouver un ancrage.
◦ La pause stratégique : Proposer de "quitter la pièce" lorsque la discussion tourne en rond est "très efficace".
En 3 minutes, "le stress disparaît, la colère s'estompe".
◦ L'expression physique : Le cri, pratiqué par Andj, est présenté comme "une forme puissante d'expression de soi et un outil pour réguler ses émotions".
• Le Rôle Positif de la Colère :
◦ La colère n'est pas systématiquement négative. Hasnain Kazim, écrivain, déclare : "j'aime la colère, je trouve qu'elle a quelque chose d'extrêmement direct.
Elle dit clairement : ça me va, ça ça ne me convient pas".
◦ Il la préfère à l'agressivité passive : "ce que je trouve horrible, c'est quand tu vois bien que tu as vexé une personne [...] et qu'elle ne dit rien".
Des outils rhétoriques et des approches spécifiques peuvent transformer une querelle en un dialogue productif.
| Technique | Description | Exemple / Citation | | --- | --- | --- | | Éviter les Généralisations | Les mots comme "jamais" ou "toujours" enferment l'autre dans une position inconfortable et ferment le dialogue. Il faut "débarrasser le dialogue de ces mots". | "Il est toujours de mauvaise humeur." | | Utiliser le "Je" | Remplacer le "tu accusateur" par des formulations commençant par "je" pour désamorcer l'agressivité et prendre la responsabilité de sa propre perception. | Au lieu de "Tu ne m'as pas compris", dire "Je me suis mal exprimé". | | Formuler son Point de Vue | Argumenter en commençant par "de mon point de vue" pour éviter de présenter son opinion comme une vérité absolue et agressive. | "De mon point de vue, si je dis à l'autre c'est toi qui est stressé, ça ne va faire qu'attiser le débat." | | Poser des Questions Ouvertes | Utiliser des questions qui commencent par "pourquoi", "comment" ou "qu'est-ce que" pour encourager une réponse développée et maintenir la discussion ouverte. | "Qu'est-ce que tu veux dire exactement ?" | | Utiliser les Questions Fermées | Poser des questions auxquelles on ne peut répondre que par "oui", "non" ou "peut-être" pour "fixer quelque chose qui n'était pas clair". | "Ça, ça te dérange ? - Oui." | | Désamorcer les Attaques Déloyales | Identifier les techniques rhétoriques visant à déstabiliser (ex: ad hominem), puis les neutraliser en recentrant calmement le débat sur le sujet principal. | Attaque : "Ça ne vous dérange pas de passer à la télé avec la même veste qu'avanthière ?" Réponse : "Bon, à part la couleur de la veste \[...\] comment peut-on faire pour avancer sur notre sujet ?" |
Le journaliste Hasnain Kazim partage son expérience sur la nécessité et la méthode pour engager le dialogue avec des personnes aux opinions radicalement différentes, notamment politiques.
• Principes Fondamentaux :
◦ Quitter sa zone de confort : Il faut être prêt à "remettre en question ses propres certitudes".
◦ Éviter l'étiquetage : Ne pas immédiatement ranger l'autre dans un camp ("droitard", "réac", "gauchiste") pour ne pas le considérer comme un "ennemi" et couper l'échange.
◦ Présomption de bonne foi : Partir du principe que "l'autre ne me tend pas de piège" et qu'il est "honnête et sincère".
Si ses propos semblent contradictoires, au lieu de le juger "stupide", il faut chercher à comprendre "ce qu'il y a derrière".
◦ Courtoisie et absence de condescendance : Ne pas arriver en "donneur de leçon" ou en "maître d'école".
• Stratégies d'Engagement :
◦ L'importance d'initier le dialogue : Le plus important est "déjà de le faire, tout simplement".
◦ Se fixer des limites : Il est crucial de savoir se protéger et de "riposter" si nécessaire.
On n'est pas obligé de "témoigner de l'empathie à tout le monde".
◦ Les effets à retardement : Même si un débat semble échouer sur le moment, il peut avoir des "effets rétroactifs".
L'interlocuteur peut plus tard réfléchir au courage de la démarche, ce qui peut faire évoluer sa pensée.
Notre manière de gérer les disputes à l'âge adulte est profondément façonnée par les modèles et les expériences de notre enfance.
• L'Apprentissage par l'Exemple :
◦ La relation à la dispute est "héritière de ce que nous ont montré nos modèles d'identification" (parents, figures d'autorité).
◦ Si un enfant apprend qu'il est aimé lorsqu'il est "passif", "discret" et "d'accord avec tout le monde", il évitera la confrontation à l'âge adulte.
• Exemple d'Andj :
◦ Il a grandi dans une famille où les disputes étaient gérées par des cris et parfois des "agressions physiques".
◦ Ses parents "réprimaient leurs propres besoins", générant une "énorme frustration".
◦ Enfant, il essayait de se "rendre invisible".
◦ La musique punk lui a permis de réaliser qu'il n'était pas seul, en entendant d'autres "hurler cette injustice".
◦ Le processus de guérison a nécessité plusieurs années de confrontations directes avec ses parents, où il a pu "verbaliser tout ce qui [l]'avait blessé", ce qui a finalement permis de rétablir une relation saine.
Une bonne dispute doit avoir une bonne conclusion pour que ses effets soient bénéfiques.
• Rituels de Réconciliation : Des rituels comme "la bise de réconciliation" ou une poignée de main sont particulièrement efficaces, notamment avec les enfants, pour clore un conflit.
• Règles Familiales : Établir des règles claires, comme celle de ne pas "emporter la dispute au lit", aide à contenir le conflit et à préserver la relation.
• Savoir Ne Pas Disputer : Parfois, la dispute "n'en vaut pas la peine".
Lors de retrouvailles familiales, la préservation des liens peut être "plus importante que le sujet qui vient de surgir".
• Le Piège de l'Empathie pour les Spectateurs : Lors d'une dispute de groupe, les spectateurs doivent se méfier de l'empathie, qui peut les transformer en "partie prenante", leur faisant voir le débat d'un seul côté et transformant les autres en "adversaires".
Synthèse sur les Systèmes d'Émulation en Milieu Scolaire
Ce document synthétise les principes, les applications et les conditions d'efficacité des systèmes d'émulation (ou systèmes de renforcement) en contexte scolaire, basés sur l'expertise de Nancy Goudreau, docteure en psychopédagogie.
L'utilisation de ces systèmes vise à instaurer ou à renforcer des comportements spécifiques par le biais d'une motivation externe.
L'idée centrale est que ces outils doivent être employés de manière ciblée, judicieuse et temporaire. Ils sont principalement indiqués pour les élèves présentant des difficultés de comportement importantes et pour qui la motivation intrinsèque est faible.
Une erreur fréquente est de les appliquer à des élèves déjà motivés, ce qui risque de substituer une motivation externe à une motivation autonome.
Le succès d'un système d'émulation repose sur des conditions strictes : le choix d'un renforçateur perçu comme agréable par l'élève, l'application immédiate du renforçateur après le comportement (contiguïté), et un lien de cause à effet clair pour l'élève (contingence).
Il est crucial de planifier le retrait progressif du système dès sa mise en place, en parallèle d'un enseignement explicite des compétences visées.
Le système en lui-même n'enseigne rien ; il ne fait que motiver.
Il existe trois types de systèmes : indépendant (individuel), dépendant (la récompense du groupe dépend d'un individu) et interdépendant (défi collectif).
Le système interdépendant est le plus recommandé pour une classe ordinaire afin de relever un défi de groupe précis.
Finalement, il est essentiel de distinguer le système d'émulation, qui est un contrat "si... alors...", de la récompense spontanée, qui est bien plus efficace pour reconnaître la bonne conduite de la majorité des élèves et demande moins d'énergie à l'enseignant.
Un système d'émulation, aussi appelé système de renforcement, est une intervention structurée mise en place pour encourager un comportement désiré. Son objectif est double :
1. Faire apparaître un comportement qui est actuellement absent chez un élève.
2. Augmenter la fréquence ou la pertinence d'un comportement déjà présent mais manifesté de façon insuffisante ou dans des contextes inappropriés.
Le mécanisme repose sur l'utilisation d'une motivation extrinsèque (externe) pour amener l'élève à adopter le comportement.
Un "renforçateur" est présenté à l'élève immédiatement après la manifestation du comportement attendu.
Il existe deux types de renforcement :
• Renforcement positif : L'ajout d'un stimulus agréable suite au comportement (ex: obtenir un autocollant, un privilège).
• Renforcement négatif : Le retrait d'un stimulus désagréable suite au comportement (ex: être exempté d'une corvée).
Il est important de noter que le terme "négatif" se réfère au retrait et non à une connotation péjorative.
L'efficacité d'un système d'émulation n'est pas automatique.
Elle dépend du respect rigoureux de plusieurs principes fondamentaux et de l'évitement de certaines erreurs courantes.
Le recours à un système d'émulation devrait être réservé à des contextes précis :
• Lorsqu'un comportement attendu est totalement absent et qu'il faut initier son apparition.
• Avec des élèves présentant des difficultés de comportement importantes, pour qui la motivation à adopter les conduites attendues est très faible.
• Pour contrecarrer des renforçateurs sociaux qui maintiennent des comportements indésirables (ex: un élève qui fait rire la classe).
Le système vise alors à offrir une réponse positive plus forte, associée au comportement attendu.
L'utilisation inadéquate des systèmes d'émulation peut être contre-productive. Les erreurs les plus fréquentes sont :
1. Utiliser le système avec des élèves déjà motivés : Appliquer un renforçateur externe à un élève qui agit déjà pour les "bonnes raisons" (motivation autonome) risque de déplacer sa motivation.
L'élève commencera à adopter le comportement non plus par plaisir ou par conviction, mais pour obtenir la récompense.
2. Appliquer un système à toute la classe de manière indifférenciée : Souvent, seuls un ou deux élèves ont réellement besoin d'un tel système.
L'appliquer à tous est une source de gestion lourde pour un bénéfice faible, et il est souvent inefficace pour les élèves qui en ont le plus besoin.
3. Omettre de planifier le retrait du système : Un système d'émulation est une mesure temporaire.
S'il n'y a pas de plan pour le retirer progressivement, l'enseignant et les élèves deviennent "pris dans le système", ce qui mène à un cycle où il faut constamment trouver de nouveaux systèmes pour maintenir la motivation.
Pour qu'un système soit efficace, plusieurs conditions doivent être réunies :
• Choix du Renforçateur : Le renforçateur doit être perçu comme agréable et motivant du point de vue de l'élève.
Un renforçateur choisi par l'adulte sans consultation peut même avoir un effet punitif (ex: un dîner avec l'enseignante pour un adolescent).
Il est donc primordial de consulter les élèves.
• Principe de Contiguïté : Le délai entre le comportement et l'obtention du renforçateur doit être le plus court possible, surtout avec les jeunes enfants.
Un renforçateur reçu le vendredi pour un comportement du mardi n'a aucun effet, car l'association ne se fait pas.
• Principe de Contingence : L'élève doit clairement et systématiquement associer le comportement spécifique avec la conséquence agréable.
• Enseignement Explicite de la Compétence : C'est un point crucial souvent négligé.
"Ça n'enseigne rien ce système-là".
Le système motive, mais il n'enseigne pas comment gérer sa colère, résoudre un conflit ou composer avec la défaite. Il doit impérativement être accompagné d'un enseignement explicite et d'un accompagnement dans le développement de la compétence visée.
• Planification du Retrait : L'objectif ultime est de développer la motivation autonome de l'élève.
L'adulte doit donc activement l'aider à prendre conscience des avantages et du plaisir associés au nouveau comportement pour que celui-ci se maintienne sans renforçateur externe.
La durée d'utilisation doit être "le plus court possible".
• Renforçateurs Sociaux : Ce sont les renforçateurs les plus puissants pour maintenir durablement les comportements.
Ils incluent les rétroactions positives, les félicitations chaleureuses et sincères, les encouragements, etc.
Ils devraient être utilisés constamment, avec ou sans système formel.
Un système purement "comptable", sans chaleur humaine, est peu efficace.
• Renforçateurs Tangibles : Ils incluent les points, autocollants, privilèges, etc.
Ils sont utiles pour amorcer un changement, mais la transition vers les renforçateurs sociaux puis vers la motivation intrinsèque doit être planifiée.
L'apprentissage de la propreté est une analogie parfaite : on commence avec des renforçateurs tangibles (ex: un bonbon) car l'enfant n'a aucune motivation autonome, puis on transitionne rapidement vers des renforçateurs sociaux (bravos, fierté, appel aux grands-parents) jusqu'à ce que l'enfant devienne autonome.
Il existe trois manières d'organiser un système d'émulation en fonction du groupe.
| Type de Système | Description | Usage Recommandé | Avantages et Inconvénients | | --- | --- | --- | --- | | Groupe Indépendant | Chaque élève travaille pour sa propre récompense ("chacun pour soi"). | Pour un ou deux élèves ayant des difficultés spécifiques, dans le cadre d'un plan d'intervention. | Avantage: Entièrement personnalisé.<br>Inconvénient: "Le moins bon choix" lorsqu'appliqué à toute une classe. Lourd à gérer, inefficace pour les élèves en difficulté et démobilisateur. | | Groupe Dépendant | La récompense de toute la classe dépend de la réussite d'un ou de quelques élèves. | Très efficace pour les élèves avec des troubles du comportement, pour mobiliser le soutien des pairs. | Avantage: Le soutien social des pairs devient un puissant levier d'aide.<br>Inconvénient: Nécessite une bonne préparation de la classe pour éviter de blâmer l'élève en cas d'échec. | | Groupe Interdépendant | La classe travaille collectivement à l'atteinte d'un objectif commun pour une récompense collective ("tous pour un, un pour tous"). | La meilleure approche pour une classe ordinaire afin de relever un défi de groupe ponctuel et précis. | Avantage: Facile à gérer, soutient un climat de coopération, inclut tous les élèves.<br>Inconvénient: Doit cibler un seul comportement précis pour être efficace. |
La réponse est nuancée : uniquement si c'est vraiment nécessaire. La plupart des classes fonctionnent bien sans système d'émulation formel.
• Pour un élève avec des besoins importants, un système indépendant sur mesure et intégré à son plan d'intervention est justifié et peut être efficace.
• Pour un défi de groupe ponctuel (ex: un relâchement dans le calme des déplacements), un système interdépendant peut être une solution efficace et temporaire.
Il doit cibler un seul comportement, et non devenir un "melting pot" de toutes les règles de la classe.
• L'utilisation d'un système indépendant pour tous les élèves d'une classe représente "énormément de temps et d'énergie pour peu de résultats".
Il est fondamental de différencier ces deux concepts :
• Système d'Émulation : Un contrat préétabli. L'élève sait à l'avance que s'il produit le comportement X, il obtiendra la récompense Y. (Ex: "Si vous travaillez bien, je vous donnerai 15 minutes de plus dehors.")
• Récompense : Une reconnaissance spontanée et non annoncée d'un bon comportement. (Ex: "Vous avez tellement fait une belle journée que j'ai envie de vous récompenser, on va aller profiter du soleil 15 minutes.")
Pour la grande majorité des élèves, qui ont déjà une motivation autonome, la récompense spontanée est beaucoup plus efficace pour reconnaître leur bonne conduite, tout en étant infiniment moins énergivore pour l'enseignant que la gestion d'un système formel.
Ces élèves ont avant tout besoin "d'encouragement, de félicitations, de tapes dans le dos".
Soutenir l'Enfant face au Stress Toxique : Synthèse des Idées d'Alexandra Mathurin-Landry
Ce document de synthèse présente les perspectives d'Alexandra Mathurin-Landry, psychologue, neuropsychologue et professeure spécialisée dans le trauma infantile.
L'analyse distingue trois types de stress — positif, tolérable et toxique — en se concentrant sur les effets dévastateurs du stress toxique, étroitement lié au concept de "trauma complexe".
Le trauma complexe découle d'une exposition répétée et prolongée à des expériences d'adversité (abus, négligence) durant des périodes de développement critiques, souvent perpétrées par les figures de soin, ce qui prive l'enfant de tout effet protecteur.
Les données scientifiques, notamment une méta-analyse récente, révèlent l'ampleur du problème : 60 % des adultes rapportent avoir vécu au moins une expérience d'adversité dans l'enfance, et 16 % en ont vécu quatre ou plus, un seuil qui augmente substantiellement les risques développementaux.
Face à ce constat, les "approches sensibles au trauma" offrent une voie d'intervention prometteuse.
Le modèle "Attachement, Régulation et Compétences" (ARC) est présenté comme un cadre d'intervention concret, de plus en plus utilisé au Québec.
La mise en œuvre de ces approches repose sur une posture adulte de "syntonie" (ajustement empathique), qui consiste à devenir un "détective des émotions" pour comprendre les besoins non comblés derrière les comportements.
Trois stratégies concrètes sont proposées :
1) établir des routines prévisibles et sécurisantes ;
2) répondre aux besoins sous-jacents plutôt que de se focaliser sur les comportements visibles (l'analogie de l'iceberg) ; et
3) soutenir activement la régulation des émotions de l'enfant par la "corégulation", où le calme de l'adulte aide l'enfant à retrouver le sien.
--------------------------------------------------------------------------------
L'intervenante, Alexandra Mathurin-Landry, est une experte reconnue dans le domaine du développement de l'enfant.
En tant que professeure agrégée à l'École de travail social et de criminologie, titulaire de la Chaire Richelieu de recherche sur la jeunesse, l'enfance et la famille, psychologue et neuropsychologue, ses travaux se concentrent sur l'amélioration des connaissances sur le trauma et le développement de pratiques innovantes et sensibles aux traumas.
L'objectif de la discussion est d'explorer les différentes formes de stress et d'identifier les moyens de soutenir le développement et la réussite des enfants qui y sont confrontés.
Contrairement à une perception monolithique, le stress n'est pas uniforme.
Un modèle distinguant trois formes de stress permet de mieux comprendre leurs impacts respectifs sur le développement de l'enfant.
1. Le Stress Positif
◦ Description : Une forme de stress bénéfique associée à des événements normatifs qui mobilisent la préparation et les apprentissages.
◦ Exemples : Un examen scolaire, une présentation orale.
◦ Impact : N'a pas d'effets négatifs à long terme sur le développement. Il contribue à l'adaptation et à la survie.
2. Le Stress Tolérable
◦ Description : Résulte d'un événement plus exceptionnel, unique et intense. Il a un début et une fin clairs.
◦ Exemple : Un enfant se faisant frapper par une automobile.
◦ Facteur Clé : La présence d'un adulte ou d'une figure de soutien qui offre un "effet protecteur" est cruciale.
Cet adulte croit, soutient et accompagne l'enfant, ce qui permet de mitiger les effets du stress et de le rendre "tolérable".
Le message clé est de ne "pas négliger le rôle qu'on peut avoir protecteur auprès des enfants".
3. Le Stress Toxique
◦ Description : Cette forme de stress est la plus dommageable.
Elle survient dans un contexte où un enfant est exposé de manière répétée et prolongée à des expériences de vie très difficiles.
◦ Exemples : Abus, négligence.
◦ Facteurs Aggravants :
▪ Absence de Protection : L'effet protecteur de l'adulte est absent. Pire, les parents ou figures de soin peuvent être la source du trauma.
▪ Nature du Trauma : Les événements menacent l'intégrité physique et psychologique de l'enfant, affectent son identité et peuvent être associés à un sentiment de trahison.
◦ Impact : A des effets substantiels et à long terme sur tous les domaines du développement de l'enfant, y compris le développement du cerveau.
Les travaux d'Alexandra Mathurin-Landry portent spécifiquement sur le "trauma complexe", un concept étroitement lié au stress toxique.
• Définition du Trauma Complexe : La situation d'un enfant exposé de façon répétée et prolongée à des expériences d'abus, de négligence ou d'autres problématiques familiales lors de périodes vulnérables du développement (petite enfance, adolescence).
• Chevauchement : Le trauma complexe peut être directement associé au stress toxique en raison de la nature chronique de l'adversité et de l'implication des figures de soin.
• Statut Diagnostique : Il est important de noter que ni le stress toxique ni le trauma complexe ne sont des diagnostics officiels, ce qui complique leur étude et leur quantification précise.
En l'absence de diagnostic formel, l'étude de la fréquence des expériences d'adversité (abus, négligence, problématiques familiales) permet d'estimer l'ampleur du phénomène.
Une méta-analyse récente (2023 ou 2024), combinant plus de 200 études et un demi-million d'individus, fournit des données robustes :
| Indicateur | Pourcentage | Interprétation | | --- | --- | --- | | Adultes ayant vécu au moins une forme d'adversité infantile | 60 % | Un chiffre qualifié d'"énorme" et de "trop élevé". | | Adultes ayant vécu quatre formes ou plus d'adversité infantile | 16 % | Un cumul qui augmente "substantiellement les risques" pour le développement. |
Pour rendre ce chiffre concret, 16 % équivaut à quatre enfants dans une classe de 25, dont le parcours de vie est marqué par une adversité significative.
Malgré la gravité du problème, il existe des solutions efficaces.
Les "approches sensibles au trauma" sont des interventions qui ont montré des effets positifs significatifs.
• Définition : Des approches systémiques qui modifient la "manière de voir les choses, notre manière de penser, nos manières de faire".
Elles visent à ce que les pratiques, politiques et procédures tiennent compte de la réalité du trauma.
• Objectif : Créer des environnements sécurisants, accueillants et engageants pour les jeunes.
• Portée Universelle : Bien que conçues pour les enfants ayant un vécu traumatique, ces approches sont bénéfiques pour tous les enfants et ne présentent "pas de contre-indication".
Elles sont particulièrement importantes pour ceux qui vivent un stress toxique ou un trauma complexe.
Le modèle ARC est un cadre d'intervention concret et tangible qui incarne les principes des approches sensibles au trauma.
Il connaît un essor important au Québec, notamment dans les services de protection de la jeunesse et dans les écoles.
• Cible : Il vise à outiller les intervenants, mais aussi les parents (biologiques, d'accueil) et autres "piliers de résilience".
• Objectifs Fondamentaux :
1. Attachement : Aider l'enfant à développer une base relationnelle sécurisante.
2. Régulation : Soutenir l'acquisition de compétences et de stratégies de régulation des émotions.
Un point crucial est que cette acquisition doit être soutenue par l'adulte ; l'enfant ne doit pas être laissé seul.
3. Compétences : Développer diverses compétences chez l'enfant.
La Syntonie : La Clé de Voûte de l'Intervention
Au cœur du modèle ARC se trouve le concept de "syntonie", aussi appelé "ajustement empathique". C'est un élément clé de la posture de l'adulte.
• Description : Une posture axée sur l'accueil, la sensibilité aux besoins et aux émotions de l'enfant, et la capacité à détecter ses signaux verbaux et non verbaux.
• La Métaphore du Détective : L'adulte doit agir comme un "détective des émotions", cherchant à comprendre ce qui se cache derrière un comportement.
Les comportements souvent jugés "perturbateurs" ou "oppositionnels" peuvent en réalité être la manifestation de besoins non comblés (affection, écoute, affirmation de soi) ou d'émotions non régulées.
Pour traduire ces principes en actions, trois stratégies fondamentales sont proposées :
1. Établir des Routines
◦ Objectif : Sécuriser l'enfant par la prévisibilité. Les enfants ayant un vécu traumatique ont particulièrement besoin de prévisibilité, car leur vie passée en a souvent manqué.
◦ Application : Les routines doivent être individualisées pour répondre aux besoins spécifiques de chaque enfant (ex: besoin de s'activer ou de se reposer le matin).
2. Répondre aux Besoins Sous-Jacents (L'Analogie de l'Iceberg)
◦ Concept : Les comportements visibles ne sont que la pointe de l'iceberg.
La majeure partie, sous la surface de l'eau, est constituée des besoins non comblés, des émotions non régulées et du vécu traumatique.
◦ Intervention : Pour être efficace, l'intervention doit "plonger sous l'eau" et s'adresser aux causes profondes (besoins, émotions) plutôt que de se limiter à la gestion du comportement en surface.
En répondant aux besoins, les comportements problématiques sont susceptibles de diminuer.
3. Soutenir la Régulation des Émotions (La Corégulation)
◦ Principe : Ne pas laisser l'enfant seul face à ses émotions.
La "corégulation" est le processus par lequel "l'état calme de l'adulte va aider l'enfant à retrouver un état calme".
◦ Action : L'adulte doit aider l'enfant à remplir sa "boîte à outils" de stratégies de régulation saines (car il n'en a peut-être pas appris ou en a développé de dangereuses comme l'automutilation).
Plus important encore, l'adulte doit être présent pour "ouvrir sa boîte à outils avec lui" et lui montrer comment utiliser les outils.
Document de Synthèse : Contrer l'Absentéisme au Secondaire
Ce document synthétise une approche innovante pour la gestion de l'absentéisme dans une école secondaire, développée et présentée par Véronique Sir, directrice d'établissement et candidate au doctorat.
Le projet marque une transition fondamentale d'un modèle punitif, jugé lourd et inefficace, vers un modèle relationnel qui responsabilise et outille les enseignants.
Cette nouvelle stratégie a permis de réduire de 50 % le nombre d'élèves présentant plus de 15 absences non motivées en une seule année scolaire.
Au-delà des chiffres, la retombée la plus significative est l'amélioration notable de la relation entre les enseignants et les élèves, les premiers n'étant plus perçus comme des "polices de la retenue" mais comme des adultes bienveillants et soucieux de la présence de chaque jeune.
La mise en œuvre s'est articulée en cinq étapes clés, incluant une analyse rigoureuse, la création d'un sous-comité stratégique, une approche pilote par "petits pas", une intégration systémique et un partage des connaissances.
Le projet met en lumière l'importance du temps, de l'adhésion des équipes et de la focalisation sur le pouvoir d'agir collectif de l'école plutôt que sur des facteurs externes.
À l'arrivée de la nouvelle direction il y a trois ans, deux irritants majeurs étaient palpables et verbalisés par le personnel de l'école :
1. Un manque de cohérence dans l'application du code de vie.
2. Une gestion des absences perçue comme excessivement lourde et inefficace.
Cette dernière tâche était si pesante que la majorité des enseignants souhaitaient s'en dégager.
L'analyse initiale des données a permis de "neutraliser l'effet négatif" des perceptions en démontrant que le problème, bien que réel, ne concernait que deux ou trois élèves par groupe, et non une majorité comme il était parfois ressenti.
Le cœur du projet est un changement radical de philosophie, passant d'un système répressif à une approche humaine et proactive.
• D'un modèle punitif à un modèle relationnel : L'ancienne méthode, qui consistait à sanctionner l'absence (par exemple, par une retenue), est abandonnée au profit d'une démarche qui cherche à comprendre les causes de l'absence et à outiller l'élève.
Comme le résume Mme Sir : "On est passé d'un modèle punitif à un modèle relationnel et outillé soutenu par des facilitateurs à l'école."
• Le rôle central de l'enseignant : Le projet repose sur l'implication directe des enseignants, qui deviennent les premiers intervenants.
Ils sont responsables des sept premières interventions auprès de leurs élèves tuteurs, incluant deux appels aux parents pour les sensibiliser.
Cette approche s'oppose au réflexe de déléguer cette responsabilité à l'équipe de soutien, reconnaissant qu'une poignée d'intervenants ne peut gérer efficacement les absences de plus de 900 élèves.
La présence des enseignants est donc jugée "essentielle".
Le projet, axé sur une gestion par les résultats, a démontré un impact mesurable et significatif sur la réduction de l'absentéisme chronique non motivé.
| Période | Contexte | Nombre d'élèves avec >15 absences non motivées | | --- | --- | --- | | Juin 2024 | Fin de la phase pilote (3 mois, 3 groupes sur 35) | Environ 120 élèves | | Juin 2025 | Fin de la première année complète (tous les groupes) | Environ 60 élèves | | 31 octobre 2025 | Début de l'année scolaire en cours | 6 élèves |
Ces chiffres représentent une diminution d'environ 50 % des cas d'absentéisme chronique en un an.
Il est noté que le mois de juin tend à augmenter le nombre d'absences, ce qui rend la comparaison encore plus probante.
Le principal fait saillant est que tous les élèves de l'école (clientèle d'environ 950 jeunes) sont désormais connus et suivis, ne permettant à personne de "passer sous la craque".
Le cheminement réflexif du projet a été structuré en cinq phases distinctes, menées en collaboration avec des chercheurs universitaires.
1. Analyse de la situation : La première étape a consisté à faire émerger des données factuelles pour objectiver les deux irritants majeurs (code de vie et gestion des absences).
2. Création du sous-comité : Considérée comme le "cœur de la démarche", cette étape a impliqué la sélection stratégique de ses membres.
Le comité inclut non seulement des personnes ouvertes au changement, mais aussi des enseignants plus critiques et des membres du personnel encore attachés au modèle punitif.
L'objectif était de créer un espace de réflexion pour confirmer la fin du statu quo et construire une vision commune.
3. Culture des "petits pas" : Pour gérer le changement, le projet a débuté par un pilote limité : trois groupes, trois enseignants volontaires, pendant trois mois.
Ce n'est que la deuxième année que l'approche a été étendue à toute l'école.
Cette phase a été marquée par des "allers-retours constants" et un "droit à l'erreur", permettant d'ajuster les moyens tout en gardant le cap sur la finalité (le modèle relationnel).
4. Veilles et intégration systémique : Cette étape, imbriquée dans les autres, a consisté à ancrer le projet dans toutes les instances de l'école :
◦ Comité projet éducatif : Intégration d'indicateurs sur l'assiduité.
◦ Plan de lutte contre la violence et l'intimidation : Favoriser un climat scolaire sécuritaire.
◦ Assemblées générales : Véhiculer l'importance du projet, en faisant témoigner les "agents facilitateurs".
◦ Rencontres de niveaux : Instaurer un point statutaire toutes les deux semaines pour suivre les élèves absentéistes.
5. Partage à la communauté : La dernière étape consiste à diffuser le projet pour "faire gagner du temps" à d'autres équipes-écoles, évitant ainsi de réinventer des solutions existantes.
• La gestion du temps et des attentes : Les résultats ne sont pas immédiats.
Comprendre les causes profondes de l'absentéisme prend du temps, ce qui peut être un défi dans une culture axée sur les résultats rapides.
• L'adhésion de l'équipe : La deuxième année, lorsque tout le personnel est impliqué, est cruciale et peut voir émerger plus de résistance.
Le sous-comité joue un rôle fondamental pour accueillir ces résistances sans reculer.
• La gestion des cas chroniques : Certains élèves, aux prises avec des enjeux de santé mentale ou de démotivation scolaire importants, résistent aux interventions.
L'implication des professionnels (psychoéducateurs, conseillers d'orientation) est ici fondamentale.
• Le roulement du personnel : L'arrivée de personnel non formé en pédagogie peut rendre la création de liens plus difficile, nécessitant un soutien accru de la part des "agents facilitateurs" internes.
Le gain le plus "magnifique" et le plus positif du projet est l'amélioration de la qualité des relations.
Les enseignants ne sont plus vus comme des agents de sanction. Un enseignant a partagé une anecdote révélatrice :
"Les élèves m'ont dit à plusieurs reprises cette année : 'Cou'donc, avez-vous une vie à part nous regarder à l'école ?'".
Pour l'équipe, cette remarque est une "victoire", car elle signifie que chaque élève sait qu'au moins un adulte se soucie de sa présence.
1. Aller trop vite : Le changement culturel et la compréhension des causes profondes de l'absence exigent du temps.
2. Remettre le sort aux parents : Plutôt que de se concentrer sur les motifs d'absence (sur lesquels l'école a peu de contrôle), la discussion doit être réorientée vers le "pouvoir d'agir collectif" à l'interne.
3. Utiliser les données à mauvais escient : Un outil de suivi (Power BI) a été développé pour fournir des données quotidiennes.
La vigilance est de mise pour que ces données servent à comprendre et agir, et non à "masquer artificiellement" les problèmes ou à créer une compétition entre les écoles.
Outre la baisse de l'absentéisme et l'amélioration des relations, le projet a généré plusieurs impacts positifs durables :
• Approche personnalisée : L'école est passée d'une généralisation ("tous les élèves de 4e secondaire s'absentent") à une analyse fine et personnalisée des besoins de chaque élève.
• Standardisation des interventions : Un protocole écrit garantit la qualité et la pérennité des interventions, indépendamment du personnel en place.
• Autonomisation et résilience des équipes : Les enseignants ont développé une autonomie ("empowerment") et une résilience face à la problématique, conscients de leur pouvoir d'agir collectif.
• Préparation à la croissance : La structure mise en place est comparée aux "fondations d'une maison", rendant l'école prête à accueillir une hausse de sa clientèle.
• Pérennité du modèle : Le projet est conçu pour être durable. L'objectif final est de développer une autonomie telle que le projet puisse survivre au départ de la direction actuelle.
Comme le conclut Mme Sir : "demain matin si je pars comme direction d'établissement, le projet va survivre grâce à nos agents facilitateurs qui vont assurer la pérennité du projet."
Note: This response was posted by the corresponding author to Review Commons. The content has not been altered except for formatting.
Learn more at Review Commons
*Reviewer #1 (Evidence, reproducibility and clarity (Required): *
*Using genetics and microscopy approaches, Cabral et al. investigate how fission yeast regulates its length and width in response to osmotic, oxidative, or low glucose stress. Miller et al. have recently found that the cell cycle regulators Cdc25, Cdc13 and Cdr2 integrate information about cell volume, time and cell surface area into the cellular decision when to divide. Cabral now build on this work and test how disruption of these regulators affects cell size adaptation. They find that each stress condition shows a distinct dependence on the individual regulators, suggesting that the complex size control network enables optimized size adaptation for each condition. Overall, the manuscript is clear and the detailed methods ensure that the experiments can be replicated.
Major comments:
1.) It would be much easier to follow the authors' conclusions, if in addition to surface area to volume ratio, length and width, they would also plot cell volume at division in Figs. 1-4.*
AUTHOR RESPONSE: Due to space constraints in the main (and supplemental) figures, we focused on SA:Vol ratio together with cell length and width, which directly define cell geometry in rod-shaped fission yeast. Surface area and volume are derived from these measurements and can be misleading when considered alone, as similar surface area or volume values can arise from distinct combinations of length and width. The SA:Vol ratio therefore serves as a robust integrative metric for capturing coordinated changes in length and width that reshape cell geometry. We would be happy to include individual surface area and volume plots if requested.
2.) To me, it seems that maybe even more than upon osmotic stress, the cdc13-2x strain differs qualitatively from WT in low glucose conditions, where the increased SA-V ratio is almost completely abolished.
AUTHOR RESPONSE: We agree with the reviewer and have revised the manuscript text to point out this difference. The newly added text states: “Under low glucose, cdc13-2x cells also showed a WT-like response, decreasing length and increasing in SA:Vol ratio (Figures 3B-D). However, this SA:Vol increase was reduced compared to WT (1% vs 8.5%; Figures 1D and 3B), suggesting impaired geometric remodeling under glucose limitation.”
3.) It is not entirely clear to me why two copies of Cdc13 would qualitatively affect the responses. Shouldn't the extra copy behave similarly to the endogenous one and therefore only lead to quantitative changes? Maybe the authors can discuss this more clearly or even test a strain in which Cdc13 function is qualitatively disrupted.
AUTHOR RESPONSE: Increased Cdc13 protein concentration in cdc13-2x cells disrupts the typical time-scaling of Cdc13 protein. Consistent with this, cdc13-2x cells enter mitosis at a smaller cell size. We have modified the text to clarify this point. The new text states: “To access the role of the Cdc13 time-sensing pathway, we disrupted Cdc13 protein abundance by creating a cdc13-2x strain carrying an additional copy of cdc13 integrated at an exogenous locus. cdc13-2x cells divided at a smaller size than WT, reflecting accelerated mitotic entry upon disruption of typical time-scaling of Cdc13 protein (Figure S1A).”
4.) I don't see why the authors come to the conclusion that under osmotic stress cells would maximize cell volume. It leads to a decreased cell length, doesn't it?
AUTHOR RESPONSE: WT cells under osmotic stress do decrease in length, but this is accompanied by an increase in cell width. Because width contributes disproportionately to cell volume in rod-shaped cells, this change results in a modest but reproducible reduction in the SA:Vol ratio relative to WT cells in control medium (Figure 1D). We note that the degree of this change under osmotic stress is small (-0.4%), although statistically significant (p * Likewise, in Figure 2B, they interpret tiny changes in the SA/V. By my estimation, the difference between control and osmotic stress is only 2% (1.195/1.17), less that the wild-type case, which appears to be twice that (which is still pretty modest). The small amplitude of these changes is obscured by the fact that the graphs do not have a baseline at zero, which, as a matter of good data-presentation practice, they should.
*
AUTHOR RESPONSE: We appreciate the reviewer’s distinction between statistical and biological significance and agree that this is an important point to clarify. We now note in the revised text that changes in SA:Vol ratio under osmotic stress are numerically small and should not be overinterpreted. Our revised text now states: “Under oxidative and osmotic stress, the SA:Vol ratio decreased, indicating greater cell volume expansion relative to surface area (Figure 1D). However, we note that the reduction in SA:Vol under osmotic stress, while statistically significant, was modest in magnitude (−0.4%).”
Although small in absolute terms, even subtle geometric changes can be biologically meaningful in fission yeast due to the small size of these cells, where minor shifts in length or width translate into measurable differences in membrane area relative to cytoplasmic volume. Importantly, in Figure 2B, the key observation is not the magnitude of the change but its direction: cdc25-degron-DaMP cells exhibit a ~2% increase in SA:Vol ratio under osmotic stress, in contrast to the decrease observed in WT cells under the same condition. This opposite response reflects altered cell geometry and is supported by corresponding changes in cell length and width. We have revised the Results text to emphasize both the modest magnitude and the directional nature of these effects: “Under osmotic stress, cdc25-degron-DaMP cells exhibited a ~2% increase in SA:Vol ratio, opposite to the modest decrease observed in WT cells. This increase arose from increased cell length and reduced width (Figures 2B-D).”
Regarding data presentation, because SA:Vol ratios vary over a narrow numerical range, setting the y-axis minimum to zero would compress the data and obscure all detectable differences. Instead, we have modifed our SA:Vol ratio graphs in Fig. 1-4 to have consistent axis scaling across panels to accurately convey relative changes while maintaining visual clarity. We are happy to provide full data tables and statistical outputs upon request.
* I am also concerned about the use of manual measurement of width at a single point along the cell. This approach is very sensitive to the choice of width point and to non-cylindrical geometries, several of which are evident in the images presented. MATLAB will return the ??? as well as the length from a mask, but even better, one can more accurately calculate the surface area and volume by assuming rotational symmetry of the mask. Given that surface area and volume calculation need to be redone anyway, as discussed below, I encourage the authors to calculate them directly from the mask, instead of using the cylindrical assumption.*
AUTHOR RESPONSE: In initial experiments to calculate surface area and volume of fission yeast cells for prior work (Miller et al., 2023, Current Biology) we found that automated width measurements by MATLAB or ImageJ were inaccurate for a subset of cells leading to noisy cell surface area and volume values. Measuring cell width by hand and assuming that each cell in a given strain had the same cell radius (average of population) for calculation of cell surface area and volume gave more consistent results and recapitulated established conclusions regarding size control mechanisms.
In this previous work and the current study, abnormally skinny or wide regions of a cell were avoided when drawing a line to measure the cell width by hand. For each strain and condition, an average cell width was determined per independent experiment and used for surface area and volume calculations. Additionally, previous analysis demonstrated that this approach yields results consistent with a rotation method derived directly from cell masks, which does not assume a cylindrical cell shape (Facchetti et al., 2019, Current Biology; Miller et al., 2023, Current Biology).
To test the validity of our size measurements and confirm the robustness of our results in this study we compared the surface area and volume of cells by this rotation method. We have added this additional information to our revised methods section and also added SA:Vol ratio graphs generated from the rotation size measurement to our revised Figure S1 E-J. Importantly, both approaches used to measure cell size gave consistent results and supported the same conclusions.*
The authors also need to be more careful about their claims about size-dependent scaling. The concentration of both Cdc13 and Cdc25 scale with size (perhaps indirectly, in the case of Cdc13), but Cdr2 does not. Cdr2 activity has been proposed to scale with size, and its density at cortical nodes has been reported to scale with size, although that claim has been challenged .*
AUTHOR RESPONSE: We have modified text in the Introduction and Results to address this point. Our revised text in the introduction states: “Recent work has shown that Cdk1 activation integrates size- and time-dependent inputs: the Wee1-inhibitory kinase Cdr2 cortical node density scales with cell surface area (Pan et al., 2014; Facchetti et al., 2019); Cdc25 nuclear accumulation scales with cell volume; and cyclin Cdc13 accumulates over time in the nucleus (Miller et al., 2023) (Figure 1B).” Our revised text in the results section states: “Cdr2 functions as a cortical scaffold that regulates Wee1 activity in relation to cell size, with Cdr2 nodal density reported to scale with cell surface area, enforcing a surface area threshold for mitotic entry (Pan et al., 2014; Allard et al., 2018; Facchetti et al., 2019; Sayyad and Pollard, 2022).”*
Even taking the authors approach at face value, there are observations that do not seem to make sense, which led me to realize that the wrong formulae were used to calculate surface area and volume.
In Figure 1E,F, the KCl-treated cells get shorter and wider; surely, that should result in a lower SA/V ratio. However, as noted above, in Figure 1D, they are shown to have a similar ratio. As a sanity check, I eye-balled the numbers off of the figure (control: 14 µm x 3.6 µm and KCl: 11 µm x 3.8 µm) and calculated their surface area and volume using the formula for a capsule (i.e., a cylinder with hemispheric ends).
SA = the surface area of the two hemispheres + the surface are of the cylinder in between = 4*pi*(width/2)^2 + pi*width*(length-width), the length-width term calculates the side length of the capsule (length without the hemispheres) from the full length of the capsule (length including the hemispheres)
V = the volume of the two hemispheres + the volume of the cylinder in between = 4/3*pi*(width/2)^3 + pi*(width/2)^2*(length-width).
I got SA/V ratios of around 2, which are way off from what is presented in Figure 1D, but my calculated ratio goes down in KCl, as expected, but not as reported.
To make sure I was not doing something wrong, I was going to repeat my calculations with the formulae in Table 1, which made me realize both are incorrect. The stated formula for the cell surface area-2*pi*RL-only represents to surface area of the cylindrical side of the cells, not its hemispherical ends. And it is not even the correct formula for the surface area of the side, because that calls for L to be the length of the side (without the hemispherical ends) not the length of the cell (which includes the hemispherical ends). L here is stated to be cell length (which is what is normally measured in the field, and which is consistent with the reported length of control cells in Figure 1E being 14 µm). The formula for the volume of a capsule in the form use in Table 1 (volume of a cylinder of length L - the volume excluded from the hemispherical ends) is pi*R^2*L - (8-(4/3*pi))*R^3.
Given these problems, I think I spent too much time thinking about the rest of the paper, because all of the calculations, and perhaps their interpretations, need to be redone.*
AUTHOR RESPONSE: The surface area and volume equations for a cylinder with hemispherical ends used in our study and listed in our table are correct and widely used in other work with fission yeast cells (Navarro and Nurse, 2012; Pan et al., 2014; Facchetti et al., 2019; BayBay et al., 2020; and Miller et al., 2023). We write our equations with variables for cell length and radius because these are biologically relevant and measured parameters for fission yeast cells. Cell length (L) refers to the total tip-to-tip length of the cell, including the hemispherical ends, and radius (R) refers to half the measured cell width. We have revised the Methods section to clarify this definition and avoid ambiguity (Please see methods section “Cell geometry measurements”)
Additionally, SA or Vol calculations were performed using the length of each individual cell and the average cell radius of the population. We did not use mean cell length of the population for our calculations like the reviewer assumed in their “sanity check” above. Please see methods section “Cell geometry measurements”. We hope that these clarifications and text revisions improve transparency and reproducibility.
* Minor Points:
Strains should be identified by strain number is the text and figure legends.*
AUTHOR RESPONSE: For clarity and readability, we refer to strains by genotype in the main text and figure legends, which we believe is more informative for readers than strain numbers. All strain numbers corresponding to each genotype are provided in Table S1, ensuring traceability and reproducibility without compromising clarity in data presentation.*
In the Introduction, "Most cell control their size" should be "Most eukaryotic cell control their size".*
AUTHOR RESPONSE: The text has been corrected as suggested.*
Reviewer #2 (Significance (Required)):
Nothing to add.*
*Reviewer #3 (Evidence, reproducibility and clarity (Required)):
Summary This manuscript reports that fission yeast cells exhibit distinct cell size and geometry when exposed to osmotic, oxidative, or low-glucose stress. Based on quantitative measurements of cell length and width, the authors propose that different stress conditions trigger specific 'geometric adaptation' patterns, suggesting that cell size homeostasis is flexibly modulated depending on environmental cues. The study provides phenotypic evidence that multiple environmental stresses lead to distinct outcomes in the balance between cell surface area and volume, which the authors interpret as stress-specific modes of size control.
Major comments 1) The authors define the 48-hour time point as the 'long-term response', but no justification is provided for why 48 hours represents a physiologically relevant adaptation phase. It is unclear whether the size-control mode has stabilized by that time, or whether it may continue to change afterward. At minimum, the authors should provide a rationale (e.g., growth recovery dynamics, transcriptional adaptation plateau, or pilot time-course observations) to demonstrate that 48 hours corresponds to the steady-state adaptive phase rather than an arbitrarily selected time point.*
AUTHOR RESPONSE: We thank the reviewer for this important point and agree that the definition of the long-term response should be clarified. We have addressed this with new experiments and revised text. We now incorporate growth curve data and doubling time analyses for all yeast strains grown under control and stress conditions (See new Figure S3). These analyses show that following an initial transient stress-induced cell cycle delay, growth rates stabilize well before 48 hours. Notably, the slowest growth rate observed was in 1M KCl, with a doubling time of ~4 hours across all yeast strains tested. Thus, by 48 hours, cells in this condition have undergone more than 12 generations of growth, while cells in all other conditions with shorter doubling times have undergone even more divisions. So by allowing cells to grow for 48 hours prior to imaging, we are capturing cells that have resumed sustained cell cycle progression following transient stress-induced cell cycle delays. Because cell size control is tightly linked to the cell cycle, we define 48 hours as a physiologically relevant time point where cells have adapted to stress conditions.
Our revised methods now states: “Cultures were incubated at 25°C while shaking at 180 rpm for 48 h prior to imaging. This time point was chosen to ensure that cells had progressed beyond the initial transient stress response and reached a stable, condition-specific growth state, as confirmed by growth curve and doubling time analyses showing stabilization well before 48 h (Figure S3), including in the slowest growing condition (1 M KCl; doubling time ~4 h).”
* 2*)Related to the above comment, the authors propose that different stresses lead to distinct cell size adaptations, yet the rationale for the chosen stress intensities and exposure times is insufficiently described. It remains unclear whether the osmotic, oxidative, and low-glucose conditions used here induce comparable levels of cellular stress. Dose-response and time-course analyses would greatly strengthen the conclusions. Without such analyses, it is difficult to support the interpretation that geometry modulation represents a direct adaptive response.
AUTHOR RESPONSE: * *We selected the specific stress conditions based on previously published work showing that these doses elicit robust responses while preserving overall cell viability and the capacity for recovery. We note that osmotic, oxidative, and low glucose conditions perturb fundamentally different cellular systems (turgor pressure and cell wall mechanics, redox balance, and metabolism etc.) and therefore do not generate directly comparable levels of cellular stress in a quantitative sense. Our goal was not to equalize stress intensity across conditions, but to examine how cells change their geometry in response to distinct classes of stressors.
We have clarified the rationale for specific stress conditions in the revised methods: “These stress intensities were selected based on prior studies demonstrating robust cellular responses while preserving cell viability and the capacity for recovery (Fantes and Nurse, 1977, Shiozaki and Russell, 1995, Degols, et al., 1996; López-Avilés et al., 2008; Sansó et al., 2008; Satioh et al., 2015, Salat-Canela et al., 2021, Bertaux et al., 2023).”
* 3) The authors describe stress-induced size changes as an 'adaptive' response. While this is an appealing hypothesis, the presented data do not demonstrate that the change in cell size itself confers a fitness advantage. Evidence showing that blocking the size change reduces stress survival-or that the altered size improves growth recovery- would be required to support this claim. Without such data, the use of the term 'geometric adaptation' seems overstated.*
AUTHOR RESPONSE: We have revised the text to remove the term “adaptive” and now describe stress-induced size changes in descriptive terms. As discussed further in response to Comment 4, new growth curve and doubling time analyses show that defects in surface area or volume expansion do not uniformly impair growth or survival over the stress exposure examined here, reinforcing the decision to avoid fitness-based language.*
4) The authors conclude that mutants exhibit no major defects in growth or viability during 48-hour stress exposure based on comparable septation index values (Fig. S2). However, septation index alone does not fully capture growth performance or cell-cycle progression and is not sufficient to support claims regarding fitness or robustness of proliferation. If the authors intend to make statements about 'growth', 'viability', or 'cell-cycle progression', additional quantitative measures (e.g., growth curves, doubling time, colony-forming units, or microcolony growth measurements) would be necessary. Alternatively, the claims should be toned down to align with the measurements currently provided.*
AUTHOR RESPONSE: We have addressed this concern with new experiments and revised text. In addition to septation index measurements (now analyzed using chi-square tests of proportions; Figure S2), we performed growth curve experiments and doubling time analyses for all genotypes under control and stress conditions (new Figure S3). These additional data show that growth rates are largely comparable across genotypes in control, oxidative, and low-glucose conditions, with more pronounced genotype-dependent differences emerging under osmotic stress. Defects in surface area or volume expansion did not uniformly correspond to impaired population growth, indicating that geometric remodeling is not strictly required for proliferation over the 48-hour stress exposure examined here. We have refined our conclusion to emphasize that defects in surface area or volume expansion do not uniformly impair growth or survival. See revised Results text under the heading “Defects in surface area or volume expansion do not uniformly compromise growth or survival”.*
5) Related to the above comment, the manuscript does not adequately rule out the possibility that the decreased division size simply results from slower growth or delayed cell-cycle progression rather than a shift in the size-control mechanism. Measurements and normalizations of growth rate are required; without them, the interpretation remains speculative.*
AUTHOR RESPONSE: We agree that changes in growth rate or altered cell cycle timing are important to consider. We have revised our text: “Changes in growth rate or cell cycle progression under stress may influence division size by altering mitotic regulator accumulation. Future studies measuring mitotic regulator dynamics alongside growth rates will be needed to distinguish direct changes in size control mechanisms from growth- or timing-dependent effects.”
* 6) Regarding the phenotypes of wee1-2x cells, it is interesting that they increase the SA:Vol ratio under all stress conditions and show phenotypes distinct from cdr2Δ cells. From these observations, the authors claims that Cdr2 and Wee1 function as a surface-area-sensing module that complements the volume-sensing and time-sensing pathways to maintain geometric homeostasis. To support this interpretation, the authors could consider additional experiments, such as analyzing cdr2Δ + wee1-2x cells under the same stress conditions. Such data would test whether increased Wee1 can rescue or modify the cdr2Δ phenotype, providing functional evidence for the proposed Cdr2-Wee1-Cdk1 regulatory relationship. Measurements of cell length, width, SA:Vol ratio, and, if feasible, Cdk1 activity markers in the strain would greatly strengthen the mechanistic claims.*
AUTHOR RESPONSE: We thank the reviewer for this insightful suggestion. While analysis of a cdr2Δ wee1-2x strain could provide additional mechanistic detail, such experiments address a distinct question beyond the scope of our current study, which focuses on how cell geometry changes under different stress conditions in cells with perturbed surface area-, volume-, or time-sensing pathways. Our conclusions regarding a surface area-sensing role for Cdr2-Wee1 signaling are based on previous studies (Pan et al., 2014; Facchetti et al., 2019; Miller et al., 2023) and the cell geometry phenotypes we observe of cdr2Δ and wee1-2x cells under stress conditions. *
Minor comments 1) The manuscript focuses on adaptation through changes in the surface-to-volume ratio; however, only the ratio is shown. Presenting the underlying values of surface area and volume would clarify which geometric parameter primary contributes to the observed changes.*
AUTHOR RESPONSE: Please see our response to Reviewer 1 major comment 1.*
*2) Statistical analysis for Fig.S2 should be provided.
AUTHOR RESPONSE: We have completed this. See revised Figure S2 and methods.*
3) The paper by Kellog and Levin 2022 is missing from the reference list.*
AUTHOR RESPONSE: Thank you for catching this. This reference has now been added. *
**Referees cross-commenting**
After reading the other reviewer's reports, I recognize that focal points differ, but they appear sequential rather than contradictory.
Reviewer 2 raises concerns regarding the surface area/volume calculations, which-if incorrect-would influence many of the quantitative conclusions. I agree that confirming the validity of these calculations (and recalculating if necessary) should be the top priority before evaluating the biological interpretations.
Reviewer 1 raises more mechanistic biological questions. These are certainly important, but in my view they depend on the robustness of the quantitative analysis highlighted by Reviewer 2.
Therefore, I regard the reports as complementary rather than conflicting. Once the analytical issue pointed out by Reviewer 2 is resolved, the field will be in a better position to assess the significance of the mechanistic points raised by Reviewer 1 (as well as those in my own report).
Reviewer #3 (Significance (Required)):
General assessment One of the major strengths of this manuscript is its quantitative, side-by-side comparison of multiple environmental stresses under a unified experimental and analytical framework. The authors provide well-controlled morphometric measurements, allowing direct comparison of geometry changes that would otherwise be difficult to evaluate across studies. The observation that different stress types generate distinct geometric outcomes is particularly intriguing and has the potential to stimulate new conceptual thinking in the field of size control. However, the strength of the conceptual conclusion is currently limited by several aspects of the experimental design and interpretation. In particular, it remains unclear whether the observed geometry changes represent active adaptive responses rather than non-specific consequences of prolonged or string stress exposure. Demonstrating whether geometry remodeling provides a fitness advantage, clarifying whether the changes reach a steady-state rather than reflecting slow drift over time, or identifying upstream stress pathways that govern the response would substantially strengthen the conceptual advance. Even if additional mechanistic or fitness-related data cannot be added, refining the interpretation so that it remains aligned with the present evidence will enhance the clarity, and impact of the study.
Advance Previous study - including the 2023 publication by the James B. Moseley group - established that fission yeast integrates distinct size-control pathways related to surface area, volume, and time under normal growth conditions. The present manuscript extends this line of work to stressed environments and argues that each stress condition elicits a distinct size-control pattern. To our knowledge, a systematic comparison of cell geometry across multiple stress types in the context of size-control pathways has not been reported, and this represents a potentially valuable conceptual advance. The advance is primarily phenomenological and conceptual rather than mechanistic: the work presents new correlation between stress types and geometry but does not yet elucidate the pathways governing these responses or demonstrate a functional advantage. With additional evidence - or with qualifiers ensuring that claims match the current data - the study could make an important contribution to understanding how cells integrate environmental cues into size-control strategies.
Audience Although the primary audience consists of researchers in the fields of cell growth, cell-cycle control, and stress responses in yeast, the conceptual contribution may interest broader fields such as growth homeostasis, metabolic adaptation, and pathological cell size changes in higher eukaryotes. Beyond yeast biology, the modular view of size regulation proposed here may inspire new investigations in stem cell biology, cancer research, and biotechnology where environmental adaptation and cell size are closely linked.
Expertise: nuclear morphology; cell morphology; cell growth; cell cycle; cytoskeleton*
Si bien el artículo presenta hallazgos interesantes sobre la relación entre el cuidado de los nietos y el mantenimiento de la agudeza mental en personas mayores, su lectura resulta parcial si no se considera el contexto sociocultural y económico en el que fue realizado el estudio. En países como Colombia, muchos abuelos y abuelas continúan trabajando en edades avanzadas debido a la falta de una pensión estable, lo que implica cargas físicas y emocionales distintas a las analizadas en la investigación. Además, no se contemplan otras actividades cognitivas y físicas que también podrían incidir positivamente en la salud mental, como el trabajo, la participación comunitaria o el autocuidado. En el contexto bogotano, marcado por el tráfico, la inseguridad y las dificultades de movilidad, el cuidado de los nietos no siempre es una actividad estimulante, sino que puede convertirse en una fuente adicional de estrés. Y aunque los resultados pueden ser válidos en casos muy específicos, no son fácilmente generalizables al contexto colombiano sin un análisis mucho más situado.
el cuidado de los nietos puede mejorar la salud de los abuelos, al mismo tiempo que ralentiza su deterioro cognitivo.
Los niños requieren mucha atención y actividad física, por lo que un adulto mayor debe ejercitarse tanto mental como físicamente durante el cuidado de un menor. Esto hace que los cuidadores deban mantenerse atentos y físicamente aptos para el juego y demás tareas de cuidado. Yo lo veo en mi familia, porque mi mamá cuida a mi sobrino y eso la mantiene alegre y activa no solo a causa de la labor de cuidado como tal, sino por la relación cercana y amorosa que comparte con el niño, que se ha convertido en su principal motivación para estar bien.
Una nueva investigación revela que las personas de edades avanzadas que proporcionan cuidado infantil poseen mejores puntuaciones en pruebas de memoria y fluidez mental. Conozca los beneficios de esta práctica.
¿con qué intención se hace el estudio? sería interesante conocer los objetivos y financiamientos de los estudios en estas notas que lo que buscan son vistas. Yo veo una invitación a una población, que ha trabajado durante de más de 40 años, a seguir trabajando, sin remuneración, dado que el detrimento de la capacidad adquisitiva y la precarización de los derechos laborales, hace necesario encender las ventajas de la familia extensa, aunque la legislación favorece la familia nuclear. Todo lo anterior, aportando a la precarización de los cuidados y los cuidadores. Conozco algunos abuelos explotados que verían en esta nota la justificación del maltrato de sus hijos.
asistían a los pequeños
"Asistir" es un término muy impreciso. No distingue entre el cuidado recreativo y el cuidado intensivo o forzoso. Con seguridad, para los abuelos un poco de cuidado es beneficioso , ya que permite la socialización y les da un propósito, pero una carga excesiva, como la crianza a tiempo completo, sin duda genera estrés crónico, lo cual es neurotóxico y acelera el deterioro cognitivo. Al no mencionar la frecuencia ideal ni los riesgos del "síndrome de la abuela esclava", el artículo ofrece una visión incompleta y potencialmente dañina de la dinámica familiar.
de 67 años
Los abuelos que cuentan con una mejor salud física y cognitiva son, precisamente, aquellos a quienes se les confía el cuidado de los nietos o quienes se sienten capaces de hacerlo. Ahora bien, aquellos que ya presentan un deterioro cognitivo suelen ser apartados de estas responsabilidades en la mayorìa de casos por seguridad. Por tanto, no es necesariamente que los nietos mejoren el cerebro, como afirma el artículo, sino que se requiere un cerebro sano para poder cuidar de ellos.
Conozca a una de las pocas personas
Investigar y redactar una entrevista a una persona de la comunidad que tenga un oficio análogo y/o que sea experto en un saber tradicional o local
¿cómo se podrìa convertir la escuela en un laboratorio de experimentaciòn tecnológica que actúe en función de su mejoramiento y bienestar?
Movimiento que aspira a imponer un nuevo orden colectivo basado en lacerteza absoluta.
Facismo, verdad absoluta, única y dominante
fontanas
tensión entre la incertidumbre humana y la búsqueda tecnológica de una certeza absoluta
Chilled by the Present, its gloom and its noise,On waking we sigh for an ancient South,A warm nude age of instinctive poise,A taste of joy in an innocent mouth.At night in our huts we dream of a partIn the balls of the Future: each ritual mazeHas a musical plan, and a musical heartCan faultlessly follow its faultless ways.We envy streams and houses that are sure,But, doubtful, articled to error, weWere never nude and calm as a great door.And never will be faultless like our fountains:We live in freedom by necessity,A mountain people dwelling among mountains.[Helados por el Presente, su pesadumbre y su ruido,al despertar suspiramos por un Sur antiguo,una cálida y desnuda era de instintivo aplomo,en boca inocente, un sabor a gozo.De noche, en nuestros refugios, soñamos tener un huecoen los bailes del Futuro: cada laberinto ritualviene con un plano musical, y un corazón musicala la perfección puede orientarse por tan perfectos recovecos.Envidiamos los arroyos y las casas que son seguros,pero, presa de la duda, aprendices del error,nunca cual puerta grande estuvimos tranquilamente desnudos,y jamás seremos impecables como nuestras fontanas:vivimos en libertad por necesidad,pueblo montaraz que vive entre montañas.]W. H. AUDEN, Sonnets from China, XVIII
Traducción del poema de Auden: Helados por el Presente, su oscuridad y su ruido, Al despertar suspiramos por un antiguo Sur, Una época cálida y desnuda de aplomo instintivo, Un sabor de alegría en una boca inocente. Por la noche, en nuestras chozas soñamos con una parte En los bailes del Futuro: cada laberinto ritual Tiene un plan musical, y un corazón musical Puede seguir sin error sus caminos impecables. Envidiamos arroyos y casas que son seguras, pero, dudosas, articuladas al error, nunca estuvimos desnudas y tranquilas como una gran puerta. Y nunca seremos impecables como nuestras fuentes: vivimos en libertad por necesidad, un pueblo montañés que habita entre montañas. [Helados por el Presente, su pesadumbre y su ruido, al despertar suspiramos por un Sur antiguo, una cálida y desnuda era de instintivo aplomo, en boca inocente, un sabor a gozo. De noche, en nuestros refugios, soñamos tener un hueco en los bailes del Futuro: cada laberinto ritual viene con un plano musical, y un corazón musical a la perfección puede orientarse por tan perfectos recovecos. Envidiamos los arroyos y las casas que son seguros, pero, presa de la duda, aprendices del error, nunca cual puerta grande estuvimos tranquilamente desnudos, y jamás seremos impecables como nuestras fontanas: vivimos en libertad por necesidad, pueblo montaraz que vive entre montañas.] W. H. AUDEN, Sonnets from China, XVIII
NOTA: Cada respuesta correcta vale un punto.
Advertir automáticamente sobre posibles problemas de rendimiento y anomalías de fallos en la aplicación web.
Recopilar automáticamente el estado del código fuente y de las variables cuando se produce una excepción en la aplicación web.
Capturar trazas de rendimiento de la aplicación web sin afectar negativamente a los usuarios de la aplicación.
Argumentamos por la continua relevancia de una definición de "gran carpa" de MR y, de hecho, abogamos por ampliar aún más la carpa al incluir todas las experiencias mediadas por la tecnología bajo el término realidad mixta. Presentamos una nueva taxonomía para describir las experiencias de MR con las dimensiones de alcance del conocimiento del mundo, inmersión y coherencia . La nueva taxonomía se inspiró en la de Milgram y Kishino, la cual, en nuestra opinión, ha sido subestimada en comparación con las demás contribuciones de su artículo original. Si bien nos inspiramos en el trabajo original de Milgram y Kishino y estamos en deuda con ellos, esperamos que este artículo fomente el debate y la investigación en esta área.
Su abordaje es limitado, supeditado al elemento técnico, se erige bajo los estamentos de una industria consolidada y que controla el mercado.
n un juego de realidad virtual, es más importante que sea entretenido que inmersivo. En un protocolo de inducción de estrés en realidad virtual, es más importante que sea estresante y controlable que que genere presencia.
Eso es crucial puesto que la narrativa siempre va a ser primaria a la experiencia sensorial.
La esquina superior derecha del gráfico requiere un IM alto y un EWK alto juntos, lo que da como resultado un gemelo digital perfecto , que ofrece seguimiento y representación en tiempo real del mundo real.
Revisar fotogrametría
la experiencia de un usuario y abordar la tercera limitación identificada en la sección 2, debemos ir más allá de los elementos de realismo co
La experiencia de usuario se limita a lo "Realista", no a lo narrativo ni a lo emocional
Además, Slater ha argumentado que la inmersión comprende dos tipos de acciones válidas: acciones sensoriomotoras válidas y acciones efectivas válidas. Estas acciones válidas resultan en cambios en la percepción del usuario del entorno y cambios en el entorno mismo, respectivamente. Argumentamos que tanto la RF como la EPM forman parte de las acciones sensoriomotoras válidas.
No se tiene en cuenta a lo emocional, revisar articulo de: Sora-Domenjó C (2022) Disrupting the “empathy machine”: The power and perils of virtual reality in addressing social issues. Front. Psychol. 13:814565. doi: 10.3389/fpsyg.2022.814565 y Reis, António. (2023). Immersive media and social change: The ‘empathy machine’ is dead, long live ‘emotional geography’!. Anàlisi. 68. 135-154. 10.5565/rev/analisi.3539.
os de nuestras dimensiones propuestas se derivan de las tres originales de Milgram y Kishino. Adoptamos directamente la dimensión de Alcance del Conocimiento del Mundo (EWK) , ya que consideramos que captura un componente clave de las experiencias de realidad aumentada y virtualidad aumentada: el grado en que el sistema es consciente de su entorno real y puede responder a los cambios en dicho entorno.
Que sucede en ambientes de arquitectura sin gravedad, o aquellas posibilidades no experienciales en un mundo fisico. o aquellas experiencia que no son de conocimiento sino que se viven a partir de las prácticas culturales propias de los pueblos del sur global.
Milgram y Kishino requería que el contenido mostrado (visualmente) fuera una mezcla de real y virtual, mientras que nuestra redefinición propuesta simplemente requiere que la experiencia sensorial general del usuario, la percepción , sea una mezcla de real y virtual. Nuestra respuesta a la crítica de que nuestra definición de MR es demasiado amplia es doble. Primero, como se ilustró anteriormente en esta sección, las muchas definiciones de MR ya eran una fuente de confusión. Segundo, como discutimos en la siguiente sección, la "realidad mixta" no pretende describir completamente un sistema o una experiencia. E
Revisar folk computing
or ejemplo, simular una comida mediante la aplicación de las señales visuales, auditivas, hápticas, olfativas y gustativas más sofisticadas puede resultar convincente para un usuario, pero en algún momento probablemente se dará cuenta de que aún no está saciado y, de hecho, podría tener más hambre que al principio. Este conflicto entre la exterocepción y la interocepción muestra cómo las señales contradictorias en una sola percepción pueden generar una experiencia incongruente. Por esta razón, existe una discontinuidad en nuestro continuo revisado, ya que la verdadera realidad virtual solo existe cuando todos los sentidos (exteroceptivos e interoceptivos) son completamente anulados por el contenido generado por computadora.
La simulación como forma de engaño, también esa conexión entre ambientes físicos y digitales y su tensión como formas para crear nuevas formas de percepción.
Por ejemplo, la RM se ha definido como una combinación de RA y RV, como sinónimo de RA, como una versión "más potente" de RA, o como la definieron Milgram y Kishino (Speicher et al., 2019 ). En la cultura popular, la distinción entre realidad aumentada y mixta también se ha difuminado, con algunas empresas como Intel.1describiendo la realidad mixta como espacialmente ubicada e interactiva con el mundo real, mientras que la realidad aumentada específicamente no incluye interacción. Microsoft2Define la realidad aumentada como la superposición de gráficos sobre vídeo, como la RA presentada en teléfonos móviles o tabletas, mientras que la realidad mixta requiere una combinación de lo físico y lo virtual. Un ejemplo es el juego RoboRaid de Microsoft HoloLens.3En este juego, los enemigos parecen existir en las paredes y pueden ser ocultados por objetos reales en la habitación real. Si te mueves a otra habitación, la ubicación de los enemigos se adapta a la nueva configuración física. Una abreviatura común es que los sistemas de realidad aumentada (RA)
Definiciones que vienen desde la propia industria, es decir que el lugar donde los autores se situan es precisamente desde esta visión.
La discontinuidad en nuestro continuo revisado hace explícito que existen diferencias reales y sustanciales entre los entornos virtuales externos y los entornos virtuales "similares a Matrix".
Es posible hacer inmersiones espiritu-tecnológicos? Es posible integrar o simular experiencias o practicas ontológicas propias del pueblos del sur global desde estas tecnologías?
Continuo realidad-virtualidad de Milgram y Kishino (adaptado de Milgram et al., 1994 ).
Visiones lineales, que son propiamente características de un continuum, pero que es contradictoria en un contexto donde la red, la malla, el hipertexto son considerados lugares de referencia.
La experiencia completa del gusto combina sonido, olor, háptica y una sustancia química que imita el gusto natural y estimula las papilas gustativas. El proyecto Food Simulator (Iwata et al., 2004 ) abordó el componente háptico del gusto, y trabajos recientes informan sobre una pantalla de sabor que sintetiza y ofrece sabores que coinciden con los obtenidos con un sensor de sabor (Miyashita, 2020 ).
Revisión de los sentidos en otras practicas culturales. Asimismo, trabajos que han explorado las percepciones y sensaciones en lo digital.
con sentidos distintos a los visuales y las experiencias de vida previas.
Revisar experiencias con sentidos no humanos
como lo propusieron inicialmente Milgram y Kishino, se muestra en la Figura 1. Anclan un extremo con un entorno puramente real, "que consiste únicamente en objetos reales", y el otro, con un entorno puramente virtual, "que consiste únicamente en objetos virtuales"
Unos ambientes puramente reales que son perspectivas que no exploran visiones pluriversales del mundo. Se establece desde una base científica que las creencias, percepciones, practicas de pueblos afro, indigenas, mestizos, entre otros no son realidades considerables.
realidad virtual" es inalcanzable, y que cualquier forma de realidad mediada por la tecnología es, de hecho, realidad mixta.
Es preciso definir cuales tecnologías abordan porque desde ese momento han habido avances desde las propias experiencias que han ampliado el nivel de percepción.
Minority Report, Iron Man y Ready Player One
La primera película la estuvo asesorada por Alex McDowell del Worlbuilding Institute, permitiendo hacer su diseño de producción desde una perspectiva de construcción de universo narrativo.
El espacio 3D creado por nuestra taxonomía incorpora conceptos familiares como presencia e inmersión
Existen ambientes bidimensionales inmersivos que no son reconocidos, como los ambientes equirectangulares y el video 360. Mirar tambien el "Folk Computing".
Revisando el continuo realidad-virtualidad de Milgram y Kishino
Esta revisión se hace desde un lugar meramente técnico, anglosajón, purista y que desconoce de forma tajante otras maneras de percepción de la realidad. Es decir, que actualiza una propuesta que se hizo en 1994 pero surge desde ella misma para ampliar su alcance; parte de una realidad tangible para describir su accionar.
Synthèse sur la Santé Mentale : Témoignages et Enjeux
Résumé Exécutif
Ce document de synthèse analyse un ensemble de témoignages et d'expertises sur la santé mentale, en se concentrant sur les expériences vécues par des athlètes de haut niveau et des jeunes.
Il met en lumière le caractère universel des troubles psychiques, qui touchent toutes les strates de la société, indépendamment du succès ou du statut social. Les principaux points à retenir sont les suivants :
1. Universalité du Mal-être : La santé mentale est une composante de la vie de chacun, susceptible de se dégrader. Les témoignages révèlent que même les champions du monde, au sommet de leur carrière, peuvent souffrir de dépression sévère, illustrant la dichotomie fréquente entre la réussite professionnelle et la détresse personnelle.
2. Stigmatisation et Silence : La honte, la peur d'être perçu comme "faible" et la pression sociale, particulièrement dans des environnements compétitifs comme le sport de haut niveau, constituent des obstacles majeurs à l'expression de la souffrance. Beaucoup souffrent en silence, cachant leur mal-être derrière une façade de normalité.
3. Facteurs de Risque Spécifiques :
◦ Pour les Athlètes : La pression de la performance, la gestion difficile de la "redescente" après un grand succès, l'isolement lié aux blessures mal gérées, et la culture du vestiaire où "il n'y a pas de place pour les faibles". ◦ Pour les Jeunes : La pression scolaire, les traumatismes infantiles, l'environnement familial, le harcèlement (scolaire et en ligne), et l'influence des algorithmes des réseaux sociaux qui peuvent créer des "bulles numériques" toxiques.
4. Symptômes et Conséquences : La détresse psychologique se manifeste par un large éventail de symptômes : isolement social, anxiété, crises d'angoisse, troubles du comportement alimentaire (TCA), scarifications, idées suicidaires, et symptômes physiques chroniques. La solitude est décrite comme une force destructrice capable de "tuer une personne".
5. Voies de Guérison : Le déclencheur de la guérison est souvent une rencontre ou la décision de parler. Les solutions passent par la recherche d'une aide professionnelle adaptée (psychologues, coachs mentaux), le soutien de l'entourage, l'expression des émotions (par l'écriture, le sport, l'art) et l'acceptation que la vulnérabilité n'est pas une faiblesse.
6. Initiatives et Prise de Conscience : Des initiatives comme le fonds de dotation "Génération 2018", créé par des footballeurs champions du monde, témoignent d'une volonté croissante de "mettre le sujet sur la table", de déstigmatiser la santé mentale et d'avoir un impact positif sur la jeunesse.
1. Définitions et Perceptions de la Santé Mentale
La santé mentale est décrite comme une composante fondamentale et universelle de l'être humain, souvent comparée à la santé physique. Elle n'est pas un état statique mais un équilibre fluctuant.
• Définitions Personnelles :
◦ "La santé mentale au sens large, on en a tous une, plus ou moins bonne, plus ou moins efficiente." ◦ C'est "comment tu te sens à l'intérieur de soi", le "bien-être du cerveau", et se ressent "dans la tête, dans le cœur, dans le ventre". ◦ Elle est perçue comme un équilibre essentiel : "si on n'a pas ça, ben on a plus envie de rien faire." ◦ Elle inclut la connaissance de sa "propre écologie", l'harmonie entre le mental et le physique.
• Déterminants Multiples : La santé mentale est influencée par une multitude de facteurs : le logement, le travail, l'ambiance sociale, les amis, le sport, et même la météo ou le contexte international. L'état psychologique (bonheur, conflits, questionnements) en est un déterminant central.
• Dégradation Générale : Des études médicales sérieuses indiquent une "aggravation constante sur les 10 dernières années" des troubles anxieux et dépressifs, une tendance accentuée par la crise du Covid-19. La santé mentale des jeunes semble s'être "considérablement dégradée depuis 2019".
2. Le Sport de Haut Niveau : Une Arène de Pression Psychologique
Les athlètes, bien que perçus comme des modèles de force, font face à des défis psychologiques uniques et intenses, souvent cachés derrière l'image du succès.
La Dichotomie entre la Réussite et la Souffrance
Le succès professionnel peut coexister avec une profonde détresse personnelle, créant un décalage difficile à gérer.
• Témoignage d'un Champion du Monde : "Quand tu es champion du monde, ben on voit la coupe et elle est en or quoi. Et on voit que ça et mais derrière il y a beaucoup de choses qui se passent dans la tête des joueurs."
• Expérience Personnelle : Un joueur décrit son arrivée en Espagne à 18 ans : "à la fois, je vivais le rêve au niveau professionnel et à la fois au niveau personnel, j'étais pas bien, j'étais en dépression."
La "Redescente" Post-Victoire et les Blessures
L'après-succès et la gestion des blessures sont des périodes de grande vulnérabilité.
• L'Après-Graal : "Quand tu es arrivé tout en haut, tu as atteint le graal, une redescente après qui n'est pas facile à gérer." Un joueur mentionne qu'Adil Rami a vécu un "espèce de burnout après le mondial".
• L'Impact des Blessures : Une blessure peut signifier la perte de son identité. Un joueur raconte : "j'avais du mal à même le matin me réveiller, c'était dur. Je me demandais ce que j'allais faire parce que pour moi, il y avait que le foot dans la vie."
• Mauvaise Gestion par les Clubs : Un joueur témoigne avoir été mal accompagné, poussé à jouer malgré une blessure pour les besoins de l'équipe, ce qui a aggravé son état physique. Les fuites d'informations confidentielles dans la presse l'ont fait passer pour "un poids pour ce club-là", entraînant un harcèlement de la part des supporters et un profond isolement.
La Culture du Silence et la Peur de la Faiblesse
Le milieu sportif impose une culture où la vulnérabilité est souvent assimilée à une faiblesse inacceptable.
• La Loi du Vestiaire : "Quand tu arrives dans le vestiaire, il y a pas de place pour les faibles. [...] Il faut être meilleur que l'autre pour avoir sa place le weekend."
• Stigmatisation par l'Encadrement : Une joueuse de handball en national raconte avoir été renvoyée par sa coach avec cette justification : "je préfère quelqu'un de moins fort que toi mais de stable mentalement plutôt que toi qui est instable mentalement." Elle ajoute : "je me suis vraiment rendu compte que la santé mentale dans le sport c'était tabou."
• Auto-Censure : Les athlètes eux-mêmes intériorisent cette norme. L'un d'eux déclare : "Le fond du problème, c'est que eux-mêmes se l'interdisent."
3. La Vulnérabilité de la Jeunesse
Les jeunes sont confrontés à une série de pressions et de traumatismes qui peuvent déclencher des crises de santé mentale sévères.
Pression Scolaire et Épuisement
L'environnement scolaire et la pression à la réussite sont des facteurs de stress majeurs.
• Origine des Troubles : Une jeune femme lie sa dépression aux cours : "très vite on m'a mis la pression et je me suis mise la pression. Et donc ça, ça s'est enchaîné à la phobie scolaire et puis après [...] mes TCA."
• Statistiques : Il est noté que "7-8 jeunes sur 10 ont une pression à la réussite plus ou moins forte et plus ils se la mettent forte et plus effectivement ils ont un risque anxio-dépressif qui est élevé."
• Surmenage (Burnout) : Le surmenage n'est pas exclusif au monde du travail. Une jeune femme engagée dans une association décrit un épuisement physique et émotionnel : "Le rythme il baissait pas, il baissait jamais. [...] je pense qu'à un moment mon cerveau il s'est dit stop."
Traumatismes et Environnement Familial
Les expériences vécues dans l'enfance et la dynamique familiale jouent un rôle crucial.
• Traumatisme Précoce : Un jeune homme raconte la mort de son petit frère de deux mois alors qu'il n'avait que 14 ans, et le sentiment de culpabilité qui l'a envahi : "je me suis senti coupable. Je me suis dit c'est de ma faute." Il a gardé ce fardeau pour lui pendant des mois.
• Environnement Familial :
◦ Certaines familles sont "assez réservées" et ont du mal à exprimer leurs problèmes. ◦ Une jeune femme décrit une famille "dans le paraître", où il faut "paraître forte, faut pas montrer ses faiblesses", ce qui l'a empêchée de parler de sa scarification. Sa mère a qualifié ses blessures de "foutaises", provoquant un sentiment de non-compréhension et de repli sur soi. ◦ Un autre jeune, ayant grandi dans un quartier populaire, a endossé très tôt le rôle de "sauveur" familial, portant une pression immense.
Harcèlement et L'Influence des Réseaux Sociaux
Le harcèlement, qu'il soit physique, psychologique ou en ligne, a des conséquences dévastatrices.
• Définition du Harcèlement : "Si quelqu'un dit qu'il est harcelé, il est harcelé. C'est ça la définition du harcèlement."
• Violence Psychologique : Une jeune femme décrit un harcèlement moral au collège : "de m'humilier, de me dire des mots méchants. Il y a aussi du chantage", ce qui a "ruiné" son estime de soi.
• Algorithmes Toxiques : Les réseaux sociaux peuvent enfermer les utilisateurs dans une "bulle numérique".
◦ Un jeune homme raconte comment, en état de dépression, les algorithmes lui proposaient des contenus "qui glamorisaient, qui incitaient au comportement autodommageable". ◦ Une autre témoigne : "j'avais peur d'avoir une maladie grave, bah moi mon algorithme vraiment il y avait que des personnes qui allaient mourir." ◦ Ces contenus, bien que procurant un sentiment paradoxal de "réconfort" et de "compréhension", aggravent le mal-être.
4. Les Chemins vers le Rétablissement
Malgré la profondeur de la souffrance, les témoignages montrent que la guérison est possible, bien que le chemin soit souvent long et difficile.
L'Importance Cruciale de la Parole
Briser le silence est la première étape, et la plus fondamentale, vers la guérison.
• Le Déclic : Souvent, "le déclic, il vient souvent d'une rencontre".
• Parler pour Aller Mieux : "On va mieux grâce à l'échange, à pouvoir parler de sa situation." L'important est de trouver une "oreille attentive", que ce soit un ami, un professionnel, ou un guide spirituel.
• Lignes d'Écoute : L'appel à une ligne d'écoute, même tenue par des étudiants, a été une porte d'entrée pour "déballer son histoire".
La Recherche d'un Soutien Professionnel
Trouver le bon professionnel est un processus parfois ardu mais essentiel.
• La Difficulté de Trouver le Bon Psy : Un jeune homme exprime son blocage : "je suis tombé sur des psy qui qui était pas bien après avoir entendu mon histoire. C'est à dire voir un psy pleurer."
• Persévérance : La recommandation est de ne pas abandonner : "c'est pas parce que tu en as tu es tombé sur trois pas bien que le 4e ou la 4e ou la 5e ou le 5e va pas être bien."
• Terminologie : Dans le sport, il est plus courant de parler de "prépa mental" ou "coach mental" que de "psychologue", car le terme "psy" "fait un peu peur". L'important reste la démarche.
• Médicaments : Les traitements comme les antidépresseurs sont mentionnés comme une aide potentielle, souvent mal vue mais qui, "bien utilisé, ça peut vraiment aider."
Stratégies Personnelles de Guérison
Chaque individu développe ses propres outils pour surmonter les épreuves.
• Faire ce qu'on a pas envie de faire : "Quand tu fais une grosse dépression, tout ce que tu tout ce que tu as pas envie de faire, c'est ce qu'il faut que tu fasses." Cela inclut bien manger, faire du sport, et parler à un psychologue.
• L'Écriture : "J'ai acheté un cahier. J'écrivais ma colère, ma tristesse. Je cherchais à comprendre." Noter les déclencheurs des crises d'angoisse permet de "déconstruire" le processus.
• Activités Passion : L'équitation est citée comme un refuge permettant de "stopper mon cerveau". Retrouver goût à la vie passe par "faire les choses que j'aime", comme le dessin, sortir, manger.
• L'Humour et le Soutien des Pairs : Un joueur raconte comment ses coéquipiers ont désamorcé un titre de presse ("le mal-aimé") en chantant la chanson, transformant une situation douloureuse en un moment de camaraderie.
Le Rôle des Initiatives Collectives
La prise de conscience collective mène à la création de structures de soutien.
• Génération 2018 : Ce fonds de dotation, créé par les joueurs de l'équipe de France de football 2018, a choisi la santé mentale comme thématique pour "laisser une trace, un héritage" et "mettre le sujet sur la table". Leur but est d'aider les autres, mais aussi de "s'aider nous-mêmes".
5. Ressources et Lignes d'Aide
Plusieurs organisations sont mentionnées comme des ressources pour obtenir de l'aide et de l'information :
• E-Enfance 3018 : Lutte contre le harcèlement et les violences numériques. Numéro d'appel : 3018.
• Nightline : Association visant à améliorer la santé mentale des jeunes et étudiants. Site web : nightline.fr.
• Psycom : Propose de l'information fiable et accessible sur la santé mentale. Site web : psycom.org.
La Crise de la Santé Mentale Étudiante : Pressions, Impacts et Initiatives
Synthèse
Ce document de synthèse analyse la crise profonde et multifactorielle de la santé mentale qui affecte la population étudiante. La détresse psychologique, déjà présente avant la pandémie de COVID-19 (touchant 20-25% des étudiants), a été exacerbée par la crise sanitaire, atteignant un pic de 43% en 2021. Cette situation critique est alimentée par une convergence de facteurs de stress : une pression académique intense, la précarité financière, l'isolement social, et une anxiété profonde face à un avenir jugé incertain, marqué par le changement climatique et l'instabilité économique.
Le système de soins en santé mentale s'avère largement insuffisant pour répondre à cette demande croissante, caractérisé par un manque criant de professionnels (un psychologue pour 15 000 étudiants en milieu universitaire) et des listes d'attente prohibitively longues. Dans ce contexte, des initiatives d'aide par les pairs, telles que l'association Nightline, émergent comme une ressource essentielle, offrant un soutien accessible, anonyme et gratuit par des étudiants formés à l'écoute.
Malgré l'ampleur de leur souffrance, les étudiants ne se positionnent pas comme une génération décliniste. Au contraire, ils manifestent une forte volonté d'agir et de s'engager, cherchant à construire un avenir où le bien-être prime sur la réussite matérielle, et affirmant leur capacité à être des acteurs du changement dès maintenant.
--------------------------------------------------------------------------------
1. Un Constat Alarmant : L'ampleur de la détresse psychologique
Les enquêtes épidémiologiques successives révèlent une dégradation continue de la santé mentale des étudiants.
• Avant la crise sanitaire : Les études montraient déjà des taux de détresse psychologique élevés, oscillant entre 20% et 25%. Ce mal-être étudiant, documenté depuis des années, n'a pas été suffisamment pris en compte par les pouvoirs publics, malgré des rapports comme celui de Danièle Viard en 2006.
• L'effet "loupe" du COVID-19 : La pandémie a agi comme un catalyseur et un amplificateur d'une souffrance préexistante. Le taux de détresse psychologique a grimpé à 43% en septembre 2021. Le nombre d'étudiants présentant des symptômes dépressifs a doublé entre l'avant et l'après-COVID, un constat partagé dans plusieurs pays européens.
• Nature de la détresse : Il ne s'agit pas d'une maladie psychiatrique en soi, mais d'un syndrome qui affecte plusieurs sphères de la vie :
◦ Affective et émotionnelle : idées tristes, morosité, irritabilité. ◦ Somatique : troubles du sommeil, fatigue intense, incapacité à accomplir des tâches simples. ◦ Cognitive : baisse de la concentration, de la mémorisation et de la motivation, ce qui impacte directement la capacité à étudier.
2. Les Multiples Facteurs de Stress des Étudiants
La détresse étudiante est le résultat d'une accumulation de facteurs de stress spécifiques à leur condition et à l'époque actuelle.
Pression Académique et Élitiste
Un environnement universitaire extrêmement compétitif est une source majeure de stress.
• Discours élitiste : Certains professeurs instaurent une pression intense dès le début du cursus avec des phrases telles que : "Vous avez choisi un cursus très difficile, il va falloir s'accrocher. Votre voisin de table ne sera pas là dans un an."
• Surcharge de travail : Des étudiants témoignent d'un épuisement total, sacrifiant leur vie sociale et leurs loisirs. Une étudiante déclare : "J'ai arrêté le sport, j'ai arrêté de voir des gens. Je me concentre vraiment sur mes études [...] Les études, c'est toute ma vie."
• Conséquences directes : Cette pression mène à des burnouts, des dépressions et une angoisse constante de l'échec. Un professeur de japonais admet : "On le sait tous les ans, il y a plusieurs suicides. Ils s'en vantent pas mais on le sait quand même."
Précarité et Conditions de Vie
Les difficultés matérielles sont un fardeau quotidien.
• Précarité financière : La gestion du loyer, des courses, des transports et le manque de soutien familial pour certains créent une anxiété permanente.
• Pression familiale : Pour certains, la réussite est une obligation due à l'investissement des parents. Une étudiante aînée de trois sœurs confie : "Je me dis que je n'ai pas le droit à l'échec."
L'Impact Dévastateur de la Crise Sanitaire
La pandémie a eu des effets particulièrement destructeurs sur les jeunes.
• Isolation et perte de socialité : La privation de contacts sociaux a été qualifiée de "cataclysmique" pour une tranche d'âge où la vie relationnelle est fondamentale.
• Traumatisme psychique : Les confinements ont été vécus comme un traumatisme, générant des états de stress post-traumatique, un phénomène inédit à cette échelle. Les peurs (mourir, que les proches meurent, un prochain confinement) ont été des facteurs traumatisants majeurs.
• Stigmatisation : Les étudiants ont été désignés comme un des vecteurs de la circulation virale, ce qui a eu un "effet terrible sur leur santé mentale".
• Conséquences à long terme : Les experts estiment que les conséquences de cette période se feront sentir pendant des décennies, tant sur la santé mentale que sur les parcours de formation et professionnels.
Anxiété face à un Avenir Incertain
Le climat général de la société est perçu comme particulièrement anxiogène.
• Crises multiples : Le changement climatique, l'inflation, la guerre, le chômage et les violences sexistes et sexuelles créent un contexte d'incertitude généralisée.
• Écoanxiété : Il ne s'agit pas d'un trouble, mais d'une peur légitime et saine face à un danger concret et actuel. Un expert précise : "Quand on n'a pas peur face à un danger, c'est pas qu'on est courageux, c'est qu'on est inconscient."
• Perte de prévisibilité : Les structures sociales et les projections (formation menant à un métier, planète viable pour fonder une famille) sont disloquées, ce qui est particulièrement déstabilisant pour des psychismes en construction.
Vulnérabilités Spécifiques
| Catégorie | Description de la Vulnérabilité | | --- | --- | | L'Âge (15-25 ans) | Le cerveau continue sa maturation jusqu'à 25 ans, le rendant particulièrement sensible aux influences environnementales ("plasticité pour le meilleur et pour le pire"). 75% des pathologies psychiatriques (schizophrénie, trouble bipolaire) se déclarent durant cette période, soulignant l'importance de la prévention et de la détection précoce. | | Étudiants Étrangers | Ils subissent une double pression : la pression académique commune, et une pression supplémentaire pour être "excellents" afin d'assurer le renouvellement de leur titre de séjour. À cela s'ajoutent les défis de l'intégration (logement, solitude, choc culturel). |
3. Nightline : Une Réponse par les Pairs
Face à la saturation des services professionnels, l'association étudiante Nightline offre un modèle de soutien alternatif et vital.
Mission et Dispositifs
• Objectif : Améliorer la santé mentale des jeunes, en particulier des étudiants.
• Principe fondamental : L'aide par les pairs. Le service est composé et destiné aux étudiants.
• Actions : L'association informe, déstigmatise, soutient et oriente à travers :
◦ Une ligne d'écoute nocturne (tous les soirs de 21h à 2h30).
◦ Des formations dans les établissements d'enseignement supérieur.
◦ Des actions de terrain et des campagnes sur les réseaux sociaux.
◦ Des actions de plaidoyer pour améliorer les politiques de santé mentale.
Le Rôle des Bénévoles Étudiants
• Profil : Ce ne sont pas des professionnels, mais des étudiants formés à l'écoute active et bienveillante.
• Anonymat : C'est une règle cardinale, valable pour l'appelant comme pour le bénévole. Les bénévoles ne doivent pas révéler leur engagement à leur entourage pour protéger le service et ne pas décourager des proches d'appeler. La seule rupture de l'anonymat est envisagée en cas de risque suicidaire immédiat pour appeler les secours, et l'appelant en est prévenu.
• Soutien des bénévoles : Un cadre strict est mis en place pour les protéger :
◦ Débriefings à chaud entre bénévoles juste après les appels difficiles. ◦ Réunions de partage mensuelles et obligatoires, encadrées par une psychologue, pour extérioriser et analyser les appels marquants.
Un Mouvement International
Le concept de Nightline est né dans les années 1970 au Royaume-Uni. Il s'est depuis étendu en Irlande, en Allemagne, en Suisse, en Autriche et en France. Des projets sont en cours pour une implantation en Belgique, montrant que le problème de la santé mentale étudiante est une préoccupation européenne.
4. Les Défaillances du Système de Soins en Santé Mentale
L'accès aux soins professionnels est un parcours du combattant pour les étudiants en souffrance.
• Pénurie de professionnels : Le ratio dans les services de santé universitaires est de un psychologue pour 15 000 étudiants, soit dix fois moins que la recommandation internationale.
• Listes d'attente "lunaires" : Les délais pour obtenir un rendez-vous dans le secteur public (Centres Médico-Psychologiques) sont de 6 à 18 mois, ce qui est incompatible avec l'urgence d'une détresse psychique. Le système est décrit comme "bouché de chez boucher".
• Coût des soins : Le secteur privé est souvent inaccessible financièrement pour une population précaire, ce qui conduit de nombreux étudiants à renoncer aux soins.
5. Au-delà du Désarroi : L'Engagement et la Résilience Étudiante
Contrairement à une vision parfois décliniste, les témoignages révèlent une jeunesse engagée et tournée vers l'action.
• Rejet du catastrophisme : Les experts notent que les étudiants, malgré leurs difficultés, ne sont pas dans une vision catastrophique du monde. Ils conservent le sentiment d'avoir les moyens d'intervenir sur leur avenir grâce à leur formation et leur vitalité.
• Volonté d'agir maintenant : Le discours dominant est celui de l'action immédiate. Une étudiante déclare : "On est acteur et actrice déjà maintenant [...] on leur dise pas vous ferez plus tard, mais ils peuvent faire maintenant et ils ont envie de faire maintenant."
• Redéfinition de la réussite : Il y a une prise de conscience que le bien-être et un bon cadre de vie sont plus importants qu'un "cadre de vie luxueux" ou un gros salaire. La quête de sens prime sur la seule réussite professionnelle.
L'Anxiété chez les Jeunes : Synthèse et Analyse
Ce document de synthèse analyse le phénomène croissant de l'anxiété chez les jeunes, un enjeu de plus en plus qualifié d'« épidémie » ou de « maladie de l'heure ».
Les témoignages de jeunes et d'experts révèlent un problème multifactoriel profondément ancré dans les structures sociales, éducatives et familiales contemporaines.
Les principaux moteurs de cette anxiété incluent une pression de performance omniprésente, des horaires surchargés qui éliminent le temps de repos et de jeu, et l'influence des réseaux sociaux qui promeuvent une culture de la perfection irréaliste.
L'analyse scientifique distingue le stress (une réponse à une menace immédiate) de l'anxiété (une menace anticipée), tout en soulignant que le cerveau y réagit de manière identique.
Des facteurs déclencheurs universels — un faible sens de contrôle, l'imprévisibilité, la nouveauté et une menace à l'ego (acronyme SPIN) — sont identifiés comme étant au cœur des expériences anxieuses des jeunes. Parallèlement, l'omniprésence du numérique contribue à une régression de l'intelligence émotionnelle en réduisant les interactions en face à face.
Les experts appellent à un « grand réveil », arguant que l'anxiété juvénile n'est pas un simple problème individuel à traiter, mais un symptôme d'un système qui « use le cerveau » des enfants.
Les solutions résident non seulement dans des stratégies d'adaptation individuelles comme la respiration ou la méditation, mais aussi dans des changements systémiques, notamment une remise en question du modèle éducatif axé sur la performance et la création de conditions plus propices à une croissance saine.
--------------------------------------------------------------------------------
L'anxiété chez les jeunes est décrite comme un phénomène majeur et en pleine expansion.
Elle est qualifiée de « maladie de l'heure », succédant à d'autres diagnostics prévalents comme le TDAH il y a quelques années.
• Consultations en hausse : Un professionnel de la santé mentale note une augmentation significative du phénomène depuis environ six à sept ans, déclarant que l'anxiété représente aujourd'hui la majorité de ses consultations.
• Impression générale : La narratrice, travaillant dans les médias, a constaté à travers diverses statistiques que le problème est bien plus répandu qu'elle ne l'imaginait initialement.
Les jeunes eux-mêmes décrivent l'anxiété comme une expérience quasi universelle dans leur entourage.
Les témoignages des jeunes décrivent un large éventail de manifestations physiques, cognitives et émotionnelles.
| Type de Symptôme | Description | Exemples de Témoignages | | --- | --- | --- | | Physique | Réactions corporelles involontaires déclenchées par la panique ou le stress. | Maux de ventre (Julian, Sopiane), pleurs incontrôlables, hyperventilation, respiration rapide (Magalie). | | Cognitif | Pensées envahissantes et scénarios catastrophiques. | Le "cerveau qui arrête jamais" (Alexandra), se concentrer uniquement sur la panique au point d'en oublier la cause initiale (Sopiane). | | Émotionnel | Sentiment de perte de contrôle, de solitude et de peur. | Peur du jugement et du rejet (Alexandra), impression que l'anxiété "finit plus", difficulté à gérer ses émotions et à montrer sa vulnérabilité (Magalie). | | Comportemental | Réactions externes observables, souvent interprétées différemment par l'entourage. | Colère et agressivité (Julian), comportement très oppositionnel lors des crises (Sopiane), perfectionnisme extrême (arracher une feuille de dessin pour une erreur). |
--------------------------------------------------------------------------------
L'anxiété des jeunes ne peut être attribuée à une cause unique. Elle émerge de l'intersection de pressions sociales, de l'environnement numérique et de dynamiques scolaires et familiales.
Un thème central est la quête incessante de la performance dans toutes les sphères de la vie.
• Horaires surchargés : Les jeunes comme Magalie et Marie décrivent des emplois du temps extrêmement chargés, remplis d'études, de tutorat, d'activités parascolaires et de travail, ne leur laissant jamais le temps de se reposer. Marie répond "jamais" à la question "Tu te reposes quand ?".
• Compétition interne et externe : Magalie décrit son besoin de tout faire comme "une compétition contre [elle]-même".
Alexandra exprime un désir de plaire à tout le monde et d'être perçue comme "parfaite".
Cette pression est si normalisée que pleurer à cause des devoirs devient un sujet de conversation banal entre amis.
• Pression sociétale et parentale : Les jeunes ressentent que la performance à l'école, dans les sports et sur les réseaux sociaux est ce qui est valorisé par la société.
Les parents, même avec de bonnes intentions, peuvent amplifier cette pression, comme le reconnaît la narratrice à propos des cours de violon de sa fille Julian.
L'environnement numérique joue un rôle significatif dans l'amplification de l'anxiété.
• Culture de la perfection : Les plateformes comme Instagram présentent une vision idéalisée de la vie ("la photo parfaite avec le l'auto parfaite avec la maison parfaite").
Cette exposition constante à la perfection crée un décalage avec la réalité et renforce le sentiment de ne jamais être à la hauteur.
• Régression de l'intelligence émotionnelle : Un spécialiste du non-verbal explique que la diminution des interactions en face à face au profit des communications numériques appauvrit la capacité à décoder les émotions.
Une étude comparant deux camps de vacances (avec et sans téléphones) a montré qu'après une semaine, les jeunes privés de leur appareil étaient devenus plus aptes à juger les émotions des autres.
Le système éducatif est identifié comme un facteur de stress majeur.
• Surcharge d'examens : La chercheuse Sonia Lupien note une augmentation constante du nombre d'examens, qu'elle qualifie scientifiquement de "périodes de stress". L'accumulation de ces déclencheurs de stress épuise les élèves.
• Contagion du stress : Des études montrent qu'un professeur souffrant d'épuisement professionnel peut voir les enfants de sa classe produire davantage d'hormones de stress, car ils "raisonnent avec le professeur".
• Le modèle finlandais comme contre-exemple : La professeure Tina Montreuil décrit le système finlandais, qui minimise les facteurs de stress :
◦ Journées d'école plus courtes (fin vers 14h30-15h).
◦ Pauses déjeuner très longues.
◦ Absence quasi totale de devoirs et d'examens formels.
◦ L'évaluation se fait par des projets, des discussions et des mises en contexte.
◦ Bien que non utopique, ce système génère des niveaux d'anxiété de performance bien plus faibles qu'en Amérique du Nord.
--------------------------------------------------------------------------------
Les experts consultés appellent à un changement de perspective, passant d'une vision individualisée de l'anxiété à une compréhension systémique.
Le professeur Carl la Charité soutient que l'anxiété des enfants est un message adressé à la société.
• Du corps au cerveau : Il établit un parallèle historique : "Il y a [...] un siècle, la façon dont on traitait les enfants, ça nous amenait à user leur corps. [...] Aujourd'hui, en fait, ce qu'on use, c'est leur cerveau."
• Un appel au "grand réveil" : Il considère l'anxiété comme un signal que les méthodes éducatives actuelles ne fonctionnent plus. La solution n'est pas de "réparer" l'enfant, mais de changer les conditions dans lesquelles il grandit.
La chercheuse Sonia Lupien propose un cadre scientifique pour comprendre et gérer le stress.
• Stress vs. Anxiété : L'analogie du "mammouth" illustre la différence :
◦ Stress : La réponse biologique à une menace réelle et présente ("le mammouth est devant toi").
◦ Anxiété : La réponse à une menace anticipée ou imaginaire ("le mammouth est dans ta tête").
◦ Pour le cerveau, la production d'hormones de stress est identique dans les deux cas.
• Les quatre déclencheurs du stress (SPIN) : Le cerveau détecte une menace et déclenche une réponse de stress lorsqu'il est confronté à une ou plusieurs de ces situations.
| Acronyme | Caractéristique | Description | | --- | --- | --- | | S | Sens de contrôle faible | Impression de ne pas avoir le contrôle sur la situation. | | P | Personnalité menacée | L'ego ou les compétences sont remis en question. | | I | Imprévisibilité | La situation est nouvelle ou inattendue. | | N | Nouveauté | La situation n'a jamais été rencontrée auparavant. |
• Le danger de la narration "stress toxique" : Sonia Lupien soutient que le discours médiatique et scientifique présentant tout stress comme négatif est contre-productif.
Il peut engendrer une "sensibilité à l'anxiété" ou la "peur d'avoir peur", où une personne panique face aux sensations physiques normales du stress, croyant qu'elles sont dangereuses.
Il est crucial de normaliser la réponse de stress comme étant nécessaire à la survie.
--------------------------------------------------------------------------------
Face à ce constat, des solutions émergent à la fois au niveau individuel, familial et sociétal.
• Suivre son intuition : Les jeunes gèrent souvent mieux le stress en suivant leur intuition : jouer, chanter, rire pour dépenser l'énergie accumulée.
• Techniques de régulation simples : Des méthodes scientifiquement prouvées sont souvent les plus simples.
◦ Respiration abdominale : Une "belle grosse respiration avec une belle grosse bédaine" active le système parasympathique et arrête la réponse de stress.
◦ Chanter : A un effet similaire à la respiration profonde.
◦ Méditation : Pratiquée par Magalie pour faire le vide et analyser sa journée.
• Communication et soutien : L'écoute est fondamentale.
Le père de Sopiane a appris qu'au lieu de proposer des solutions, il est plus efficace d'écouter, de valider l'émotion et d'offrir un soutien inconditionnel ("je suis là pour toi").
• Changement de vocabulaire et mantras : Adopter un langage qui normalise l'inconfort sans le dramatiser.
Le mantra utilisé par Judith et Sopiane est un exemple puissant : "C'est vraiment inconfortable en ce moment mais ça va pas durer."
• Prise de conscience parentale : Les parents doivent réfléchir à l'impact de leur propre anxiété de performance sur leurs enfants et ajuster leurs attentes, en se concentrant sur le processus d'apprentissage plutôt que sur le résultat.
• Créer des conditions de croissance : Selon Carl la Charité, les enfants n'ont pas besoin qu'on "tire sur la fleur pour qu'elle pousse". Ils ont besoin de conditions propices :
◦ Jouer dehors.
◦ Interagir avec d'autres enfants, y compris dans le conflit.
◦ Avoir des adultes qui fixent des limites mais prennent aussi le temps d'écouter.
• Réformer le système éducatif : S'inspirer de modèles moins axés sur la performance et les examens, comme le système finlandais, pour recentrer l'éducation sur le goût d'apprendre.
• Parler ouvertement : La démarche de la narratrice montre que le fait de parler ouvertement de l'anxiété, de poser des questions et de partager des expériences permet de briser l'isolement, de valider les ressentis et d'ouvrir la voie à des solutions collectives.
Synthèse sur la Crise de la Santé Mentale de la Jeunesse en France
Le système de santé mentale pour la jeunesse en France est en état de crise profonde, caractérisée par une augmentation exponentielle du mal-être psychique chez les mineurs et un effondrement structurel du système de soin public.
Un jeune sur cinq souffre désormais de symptômes dépressifs sévères, et les passages aux urgences psychiatriques pour mineurs ont triplé en cinq ans.
Cette détresse est aggravée par une pénurie abyssale de moyens : plus de la moitié des lits en pédopsychiatrie ont été supprimés en une décennie, les Centres Médico-Psychologiques (CMP) sont saturés avec des listes d'attente pouvant atteindre deux ans, et le nombre de pédopsychiatres est dramatiquement insuffisant.
Face à ce système public exsangue, les familles et les soignants sont poussés à bout.
Les médecins sont contraints de "trier" les adolescents suicidaires, renvoyant chez eux des cas graves par manque de place, ce qui mène à des situations de non-assistance à personne en danger.
En réponse, des solutions palliatives émergent, dont l'efficacité est souvent contestée.
On observe une sur-médicamentation croissante, avec un doublement des prescriptions d'antidépresseurs en sept ans, parfois sans suivi psychologique adéquat et avec des effets secondaires dangereux.
Simultanément, le secteur privé lucratif se développe, profitant des défaillances du public mais soulevant des questions d'inégalité d'accès aux soins et de déstabilisation de l'hôpital public.
Les initiatives gouvernementales, comme les formations aux premiers secours en santé mentale ou les financements par appels à projets, apparaissent largement insuffisantes pour endiguer une crise systémique qui nécessite une refonte politique et financière massive.
--------------------------------------------------------------------------------
La santé mentale de la jeunesse française traverse une période de détresse sans précédent.
Les témoignages et les données statistiques dressent le portrait d'une génération en grande souffrance, confrontée à un vide psychologique et un système de soin incapable de répondre à ses besoins.
Les indicateurs de santé mentale chez les jeunes sont au rouge, témoignant d'une épidémie silencieuse.
• Statistiques Clés :
◦ Un jeune sur cinq en France souffre de symptômes dépressifs sévères.
◦ Le nombre de passages de mineurs aux urgences psychiatriques a triplé au cours des cinq dernières années.
◦ Les tentatives de suicide sont de plus en plus nombreuses et concernent des enfants de plus en plus jeunes (8, 9, 10 ans).
• Témoignages de la Souffrance :
◦ Un jeune décrit sa dépression : "L'envie de mourir me revient. Elle plane au-dessus de moi comme un grand oiseau sombre [...]. Elle prend toute la place. Elle prend ma place."
◦ Un adolescent de 15 ans aux urgences confie avoir des idées suicidaires "en permanence" depuis l'âge de 11 ans.
◦ Une mère de famille résume l'expérience : "Si j'avais à résumer et à imager en un mot la dépression de notre enfant, ce serait enfer."
Plusieurs phénomènes sociaux et conjoncturels sont identifiés comme des catalyseurs de cette crise.
• Facteurs Sociaux : Le harcèlement scolaire, l'impact des réseaux sociaux, les difficultés économiques et sociales des familles, ainsi que l'éco-anxiété sont cités comme des éléments fragilisant les adolescents et les jeunes adultes.
• L'Effet du Covid-19 : La période de la pandémie a exacerbé ce phénomène de mal-être de manière significative.
--------------------------------------------------------------------------------
Le principal paradoxe de cette crise est que, alors que la détresse psychique n'a jamais été aussi forte, l'accès à une prise en charge adéquate et durable n'a jamais été aussi difficile.
Le système public de pédopsychiatrie est en état de délabrement avancé.
La crise actuelle est le résultat de décennies de décisions politiques et de sous-investissement.
• Origine Politique : Le "virage ambulatoire" initié dans les années 1980, visant à favoriser les soins en dehors de l'hôpital, a conduit à une fermeture excessive de lits.
• Manque de Lits :
◦ Plus de la moitié des lits en pédopsychiatrie ont disparu en seulement 10 ans.
◦ Une dizaine de départements français ne possèdent plus aucun lit de pédopsychiatrie.
◦ En Loire-Atlantique, il n'y a que 14 lits pour plus de 320 000 mineurs.
• Manque de Personnel :
◦ Seulement 600 pédopsychiatres exercent encore dans le service public sur tout le territoire.
◦ Les conditions de travail exténuantes provoquent un épuisement professionnel et des démissions, comme en témoigne un médecin :
"En moins de 6 mois, ce sont deux de mes collègues pédopsychiatres excellents [...] qui sont partis [...] sinon ils allaient y laisser leur peau."
• Surcharge des Structures Ambulatoires : Les Centres Médico-Psychologiques (CMP), devenus le pilier du soin, sont submergés.
Dans certaines régions, les délais d'attente pour un rendez-vous peuvent atteindre deux ans.
Le "manque de soin est abyssal", forçant les familles à un véritable "parcours du combattant".
| Problème Systémique | Conséquences Directes | | --- | --- | | Manque de lits et de places | Tri des patients suicidaires : Les médecins doivent choisir qui hospitaliser. Un médecin de l'hôpital Kremlin-Bicêtre explique : "On avait à manager trois. Ben, on prend le plus grave." | | Saturation des urgences | Renvois à domicile de cas critiques : Au CHU de Nantes, 162 enfants ont été renvoyés chez eux en 2024, bien que leur état ait été jugé comme nécessitant une hospitalisation. | | Absence de structures adaptées | Hospitalisations inappropriées : Des mineurs sont placés dans des services de psychiatrie pour adultes, une pratique traumatisante et désormais illégale mais toujours en cours. Une jeune fille témoigne : "J'étais avec des personnes qui criaient la nuit, qui se cognent la tête contre les vitres." | | Désengagement de l'État | Isolement et détresse des familles : Laissés sans solution, les parents vivent dans une peur constante. "On a peur d'ouvrir la porte \[de la chambre de notre enfant\]", confie un père. Certains sont contraints d'arrêter de travailler, s'endettant pour tenter de sauver leur enfant. Ils créent des groupes de soutien sur les réseaux sociaux pour briser l'isolement. |
Les professionnels de santé sont en première ligne, confrontés à l'impossibilité d'accomplir leur mission.
• Souffrance Morale : Un psychiatre déclare : "J'ai affaire tous les jours à des collègues qui pleurent régulièrement parce que [...] on fait de la merde au quotidien."
• Sentiment d'Impuissance : La seule réponse souvent possible est : "Nous n'avons rien à vous proposer."
• Actions de Protestation : À Nantes, des soignants ont saisi symboliquement la justice pour "non-assistance à personne en danger".
Des manifestations et des alertes publiques se multiplient depuis deux décennies, sans résultats concrets.
--------------------------------------------------------------------------------
Face à la défaillance du public, diverses réponses émergent, allant de la sur-médicamentation à des initiatives gouvernementales jugées insuffisantes, jusqu'à une privatisation croissante du secteur.
Le manque de temps et de moyens pour des suivis psychologiques pousse à un recours massif aux traitements médicamenteux.
• Explosion des Prescriptions : La prescription d'antidépresseurs chez les jeunes a plus que doublé en seulement 7 ans.
• Une Pratique Douteuse : Des médecins avouent prescrire massivement, à l'encontre de leurs pratiques passées.
"Avant, j'avais l'impression de soigner et maintenant je prescris", affirme une professionnelle.
Ces prescriptions sont souvent faites dès la première consultation, sans accompagnement psychologique, ce qui est contraire aux recommandations officielles.
• Effets Secondaires Graves :
◦ Les antidépresseurs peuvent aggraver les pulsions suicidaires dans les premières semaines de traitement.
Une jeune fille témoigne avoir fait une tentative de suicide avec les médicaments prescrits par un psychiatre qui l'avait laissée sans suivi.
◦ Le cas de Romain, 16 ans, est emblématique. Après la prescription de paroxétine, il a développé des comportements désinhibés et euphoriques avant de se suicider.
• Mise en Cause des Laboratoires : Les parents de Romain ont découvert que les essais cliniques de la paroxétine (laboratoire GSK) sur les enfants avaient été faussés.
GSK a été condamné à une amende de 3 milliards de dollars aux États-Unis pour ces faits.
Les autorités tentent de répondre à la crise, mais les mesures mises en place sont critiquées pour leur superficialité.
• "Premiers Secours en Santé Mentale" : Une formation de 14 heures importée d'Australie et massivement déployée.
Une chercheuse ayant analysé 46 études internationales conclut que rien ne prouve l'efficacité de ce programme pour inciter les personnes en souffrance à se faire soigner.
L'argent investi (plus de 12 millions d'euros) serait mieux utilisé ailleurs.
• Le Système des "Appels à Projet" : Le gouvernement finance des projets "innovants" pour une durée limitée (3 ans).
◦ Exemple du CAP d'Amiens : Ce centre d'accueil post-crise a montré des résultats probants (80% des jeunes n'ont pas été ré-hospitalisés dans les 6 mois).
◦ Problème de Pérennité : Malgré son succès, son financement n'a pas été pérennisé, au motif qu'il n'avait pas dépensé tout son budget, illustrant une logique comptable déconnectée des besoins de soin à long terme.
• Thérapies Virtuelles et Chatbots : Une tendance venue des États-Unis, où des start-ups développent des IA pour remplacer les thérapeutes.
Des experts alertent sur le danger de ces outils, qui peuvent créer une dépendance, aggraver l'isolement et ont été reliés à une augmentation des actes suicidaires chez les 10-14 ans.
Le vide laissé par le service public est de plus en plus comblé par des acteurs privés à but lucratif.
• Le Dernier Recours des Familles : Des familles se tournent vers des cliniques privées, souvent à des centaines de kilomètres de chez elles et à des coûts prohibitifs (ex: 210 € par jour).
• Le Cas d'Éméis à Strasbourg : Ce groupe (anciennement Orpea) prévoit de construire une clinique psychiatrique de 80 lits.
◦ Controverse : Le projet est critiqué car il risque de "dépouiller" l'hôpital public de ses professionnels et de ne prendre en charge que les cas les moins complexes, laissant les situations les plus dramatiques au public.
◦ Rôle Ambigu de l'ARS : L'Agence Régionale de Santé a approuvé ce projet privé tout en refusant la création d'un hôpital de jour public au même endroit, soulevant des questions sur l'influence du lobbying.
◦ Interrogations : Le délégué ministériel à la santé mentale s'étonne lui-même d'un tel projet, le jugeant à contre-courant des recommandations qui privilégient les prises en charge ambulatoires.
Document d'information : La mouvance du "mâle alpha"
Synthèse
Ce document d'information synthétise les thèmes, les figures clés et les impacts de la mouvance du "mâle alpha", un phénomène social émanant principalement des réseaux sociaux.
Porté par des influenceurs comme Andrew Tate à l'international et des figures québécoises telles que Julien Bournival, ce mouvement prône un retour aux valeurs traditionnelles et à des rôles de genre strictement définis, où l'homme est le pourvoyeur et le leader, et la femme, plus soumise, se consacre au foyer.
L'idéologie fondamentale repose sur une forme de déterminisme biologique, affirmant que les hommes et les femmes possèdent des caractéristiques innées et distinctes qui les destinent à des rôles différents.
Ce discours trouve un écho particulier auprès de jeunes hommes en quête de repères, attirés par un message mêlant développement personnel (discipline, forme physique, succès entrepreneurial) et une rhétorique de rébellion contre un establishment perçu comme hostile.
Les experts analysent cette mouvance comme une manifestation contemporaine d'un discours antiféministe récurrent, intrinsèquement misogyne, qui exprime une crainte de la perte des privilèges masculins face à l'avancée de l'égalité des genres.
Ce phénomène est étroitement lié à une méfiance généralisée envers les institutions (gouvernement, médias, science), à l'adhésion à des théories du complot concernant une "élite" manipulatrice, et à une convergence avec les idéologies de la droite conservatrice, incluant un retour à la religion chrétienne.
Socialement, cette mouvance contribue à une polarisation idéologique croissante entre les jeunes hommes, qui tendent à devenir plus conservateurs, et les jeunes femmes, de plus en plus progressistes.
Son influence est désormais palpable jusque dans les salles de classe, où des discours rétrogrades et masculinistes refont surface, témoignant de la nécessité d'une vigilance continue face à la remise en question des acquis en matière d'égalité.
--------------------------------------------------------------------------------
1. Définition et idéologie du mouvement "mâle alpha"
Le mouvement "mâle alpha" est défini comme un phénomène émanant d'influenceurs du web et des réseaux sociaux qui prônent un retour à certaines valeurs traditionnelles. Son idéologie repose sur plusieurs piliers fondamentaux.
Principes fondamentaux :
• Rôles de genre traditionnels : L'homme assume le rôle de leader et de pourvoyeur ("provider", "chef à la maison"), tandis que la femme est plus soumise et se consacre au foyer et à la famille ("nurture").
Un influenceur affirme : "La règle c'est que l'homme est un homme puis est masculin puis il doit être le chef à la maison puis c'est lui le provider."
• Force et responsabilité masculine : L'homme "alpha" doit être fort physiquement et mentalement, prendre ses responsabilités, protéger et subvenir aux besoins de sa famille.
• Contrôle dans la relation : Certains discours promeuvent un contrôle sur la partenaire féminine. Un extrait viral stipule : "Quand tu es en couple, tu laisses pas ta blonde sortir d'un club.
Tu laisses pas ta blonde aller dans un festival. Tu laisses pas ta blonde de mettre des photos de ses fesses en Gstring sur Instagram."
Justification par le déterminisme biologique :
• Différences innées : Les partisans soutiennent que les hommes et les femmes sont biologiquement différents, ce qui détermine leurs traits de caractère. L'homme serait naturellement "assertif", "direct" et "fonceur", tandis que la femme serait dotée d'une "sensibilité" et d'une "intuition" supérieures.
• Rejet de l'égalité des compétences : L'idée que les hommes et les femmes sont égaux en aptitudes et en compétences est jugée "complètement ridicule" par Julien Bournival.
• Hypergamie : Un coach en dating du mouvement affirme que les femmes sont biologiquement attirées par des hommes qui leur sont supérieurs en termes de confiance, charisme, salaire, grandeur et force, un concept qu'il nomme "hypergamie".
La "crise de la masculinité" :
• Les influenceurs du mouvement estiment qu'il existe une "crise de la masculinité" causée par une société qui perçoit la masculinité comme "toxique" et tente d' "émasculiner" les hommes.
• Cette perception est partagée par de jeunes hommes qui se sentent attaqués ou dévalorisés. Une jeune femme observe : "À force de se faire dire qu'on est méchant, qu'on est pas bon, qu'on est un problème, mais je pense que leur réaction c'est la colère."
2. Figures clés et leurs discours
Plusieurs influenceurs sont identifiés comme des figures centrales de ce mouvement, chacun avec un style et une portée distincts.
Andrew Tate : La figure de proue internationale
• Profil : Influenceur britanno-américain, ancien champion de kickboxing, décrit comme une "méga star" et l'une des personnes les plus recherchées sur Google. Il a été arrêté en Roumanie pour trafic d'êtres humains, viol et formation d'un gang criminel.
• Message double : Son discours est un mélange de développement personnel (discipline, détermination, prise de responsabilité) et de propos jugés "irrespectueux, misagènes [sic] envers la femme".
• Défense de ses partisans : Ses adeptes, comme Julien Bournival, défendent "l'essence de son message" tout en minimisant ses controverses, les qualifiant de "jokes déplacés" ou d'actes d'un "personnage" destiné à provoquer. Un jeune homme affirme : "si m'aide à faire de l'argent. Je vois pas pourquoi je veux dire c'est une mauvaise personne".
Julien Bournival : Le modèle québécois en Floride
• Profil : Entrepreneur québécois installé en Floride, il se décrit comme faisant partie du "1 % en terme de revenu" et du "1 % en terme de fitness". Il a quitté le Québec, qu'il qualifiait de "République socialiste" durant la pandémie.
• Discours : Il prône un retour aux valeurs traditionnelles, se définit comme un "pourvoyeur" et vit une relation où sa femme s'occupe de la maison et de la famille. Il lie de plus en plus ses valeurs à sa foi chrétienne.
• Activité entrepreneuriale : Il dirige une entreprise (Global) dans le domaine de l'amélioration énergétique, mais utilise ses réunions d'employés comme des séances de "croissance personnelle" où il promeut sa vision du monde, affirmant que les entrepreneurs ont une "responsabilité morale" de bâtir un peuple fort contre les "dirigeants" qui veulent un peuple faible et contrôlable.
Louis Rassico : L'influenceur repenti
• Parcours : Jeune entraîneur québécois, il a été l'une des premières figures "mâle alpha" au Québec. Il admet avoir été influencé par Andrew Tate et avoir copié son style "intense" ("Ferme ta gueule") pour gagner en popularité, ce qui a fonctionné.
• Prise de distance : Il a depuis changé de discours, qualifiant Tate de "manipulateur" et décrivant son propre parcours comme une "déprogrammation" ou une "déradicalisation". Il a réalisé qu'il "perdai[t] contact avec la vraie réalité des choses".
Chloé Roma : La défenseure des droits des hommes
• Position : Canadienne connaissant un grand succès en défendant les droits des hommes. Elle soutient que les hommes sont en crise, manquent de modèles positifs et sont toujours soumis à l'attente d'être "protecteur et pourvoyeur", contrairement aux femmes qui sont maintenant perçues comme capables de multiples rôles.
• Analyse sur Tate : Elle pense que le succès de Tate s'explique par le fait qu'il a touché une audience d'hommes sans figure paternelle ou modèle masculin positif, mais critique le fait que son message renforce les attentes négatives déjà pesantes sur les hommes.
3. Analyse critique et impacts sociétaux
Des experts et des acteurs de la société civile offrent une analyse critique de ce mouvement et de ses conséquences.
Perspective sociologique (Francis Dupuis-Déri) :
• Discours récurrent : La "crise de la masculinité" n'est pas un phénomène nouveau. Des discours similaires existent depuis l'Antiquité romaine et à chaque siècle depuis, quel que soit le contexte politique ou culturel.
• Nature misogyne : Le discours de la crise est "nécessairement misogyne" car il postule que (1) les hommes vont mal, (2) c'est à cause des femmes, et (3) la solution est un retour à une masculinité traditionnelle.
• Réponse à l'égalité : Ce mouvement est une forme d'antiféminisme porté par des hommes qui "ne veulent pas de l'égalité" et voient le progrès des droits des femmes comme une "menace" à leurs privilèges.
• Réfutation du déterminisme : L'idée de rôles biologiquement définis est contredite par l'histoire de l'humanité, qui montre une grande diversité de rôles assumés par les hommes et les femmes. La différence des rôles est avant tout liée à la "socialisation et des éducations différentes".
Impact en milieu scolaire (Véronique Guitras, enseignante) :
• Retour de discours rétrogrades : L'enseignante a constaté un "clash de discours" dans sa classe après un congé de maternité. Des élèves masculins tiennent désormais des propos "conservateurs, traditionnels, masculinistes".
• Exemples concrets : Un élève lui a affirmé que l'aspiration de toutes les femmes est d'être "invité sur un yat à Dubaï", et qu'elles ne sont pas des "bâtisseuses" comme les hommes. Elle décrit ce phénomène comme un retour "60 ans en arrière".
Polarisation idéologique croissante :
• Fossé de genre : Un fossé idéologique se creuse chez les jeunes en Occident : les jeunes femmes deviennent de plus en plus progressistes et féministes, tandis que les jeunes hommes deviennent de plus en plus conservateurs.
• Débat "l'homme ou l'ours" : Ce débat viral illustre la méfiance des femmes envers les hommes.
Une jeune femme explique préférer rencontrer un ours dans la forêt, car "l'ours quand il va m'attaquer, on va pas me demander comment j'étais habillée avant".
Une autre affirme qu'il est "nécessaire pour nous de se méfier de tous les hommes" pour leur propre sécurité.
4. Liens avec le conservatisme et les théories du complot
Le discours "mâle alpha" est intrinsèquement lié à une méfiance envers les institutions et à une adhésion à des idéologies conservatrices et conspirationnistes.
Méfiance envers les institutions :
• Rejet de l'autorité : Il existe une perte de confiance généralisée envers la science, la médecine, le gouvernement et surtout les médias, qualifiés d' "agence de publicité du gouvernement".
Ce phénomène a été "considérablement accéléré" par la pandémie.
• Sentiment d'abandon : Selon l'anthropologue Samuel Viger, ce rejet peut provenir d'un sentiment d'abandon par le système (crises du logement, de la santé, inégalités croissantes), poussant certains individus vers des discours marginaux.
Rhétorique conspirationniste :
• L'élite manipulatrice : Les influenceurs de la mouvance véhiculent l'idée qu'une "élite" satanique contrôle le monde et cherche à affaiblir la population en s'attaquant à la famille traditionnelle, en "brainwashant" les enfants et en promouvant une société de "weak person".
• La posture de rébellion : Adopter les valeurs "mâle alpha" est présenté comme "l'ultime rébellion" contre ce système de contrôle.
Convergence avec la droite et la religion :
• Idéologie de droite : Le mouvement s'aligne sur des valeurs conservatrices. Julien Bournival admire Donald Trump et s'est installé en Floride pour le mode de vie républicain promu par Ron DeSantis.
• Retour à la foi chrétienne : Plusieurs figures du mouvement, dont Bournival, se tournent vers la Bible pour justifier les valeurs traditionnelles.
Le passage biblique sur la soumission de la femme à l'homme (Éphésiens 5:22-33) est cité comme un "code d'éthique". La foi est présentée comme une garantie morale pour la soumission de la femme.
Hostilité envers les minorités de genre :
• Vision rigide des genres : L'existence de personnes transgenres et de drag queens est perçue comme une attaque directe à leur conception "biologisante" et naturelle de l'homme et de la femme.
• Accusations de "grooming" : Les drag queens qui lisent des contes aux enfants sont accusées de "grooming" et de faire partie d'un "agenda satanique".
Cette rhétorique escalade jusqu'à des comparaisons avec la pédophilie : "c'est quoi la prochaine affaire [...] c'est on va accepter les pédophiles".
5. Citations marquantes
| Thème | Citation | Locuteur | | --- | --- | --- | | Idéologie Mâle Alpha | "Chris, allez au gym, arrêtez de faire vos couches de guilleir." | Extrait audio d'influenceur | | Rôles Traditionnels | "La règle c'est que l'homme est un homme puis est masculin puis il doit être le chef à la maison puis c'est lui le provider." | Julien Bournival | | Soumission féminine | "Moi j'aime mieux être dans le shadow, m'occuper de notre maison \[...\] Va à la guerre, va au front, moi je reste derrière." | Partenaire de Julien Bournival | | Critique d'Andrew Tate | "On s'entend que Andw Tate a des propos irrespectueux, misagène envers la femme en général." | Journaliste | | Défense d'Andrew Tate | "L'essence de son message \[...\] c'est respecte-toi, respecte les autres, prends soin de toi. Assure-toi que quand tu dis de quoi, ta parole vaut de quoi." | Julien Bournival | | Impact scolaire | "Je me retrouve devant des jeunes qui ont des discours conservateurs, traditionnels, masculinistes \[...\] A on est revenu 60 ans en arrière." | Véronique Guitras, enseignante | | Analyse sociologique | "Le discours de crise \[...\] il dit les hommes vont mal. Ils vont mal à cause de qui ? Ils vont mal à cause des femmes." | Francis Dupuis-Déri, sociologue | | Polarisation | "L'ours quand il va m'attaquer, on va pas me demander comment j'étais habillée avant." | Jeune femme | | Théorie du complot | "Ceux qui contrôlent le monde sont satanique. Ils contrôlent les gouvernements." | Julien Bournival | | Repentir | "\[Andrew Tate\] est manipulateur clairement. \[...\] Moi-même je me suis fait influencer par lui \[...\] Je me suis déprogrammé." | Louis Rassico, entraîneur | | Vigilance | "J'ai deux filles. J'ai pas envie qu'elle vivent dans un monde inégalitaire. J'ai pas envie qu'elle soit soumise à quiconque. \[...\] il y a rien de gagner pour toujours." | Journaliste |
Synthèse sur le Harcèlement Scolaire : Causes, Conséquences et Stratégies de Prévention
Ce document de synthèse analyse en profondeur la problématique du harcèlement scolaire en France, en s'appuyant sur des témoignages et des études de cas poignants.
Il met en lumière les conséquences tragiques du harcèlement à travers les suicides de Dina et Lucas, deux adolescents de 13 ans, tout en explorant les mécanismes sous-jacents, les défaillances institutionnelles et les stratégies de prévention émergentes.
Les principaux points à retenir sont les suivants :
1. Les Visages de la Tragédie : Les cas de Dina et Lucas illustrent la violence extrême du harcèlement. Les motifs sont multiples et ciblent la différence :
Ces agressions répétées, verbales et physiques, créent un sentiment insupportable de honte et d'isolement menant à des actes désespérés.
2. Défaillances Systémiques : Les témoignages révèlent de graves lacunes dans la réponse des institutions scolaires et judiciaires.
Les collèges ont souvent minimisé les faits, tardé à agir ou adopté des approches inefficaces qui ont aggravé la souffrance des victimes.
Le système judiciaire a initialement classé sans suite l'affaire de Dina et annulé en appel la condamnation des harceleurs de Lucas, niant le lien entre le harcèlement et le suicide, et laissant les familles dans un profond désarroi.
3. Un Changement de Paradigme : Face à ces échecs, de nouvelles stratégies proactives sont mises en œuvre.
Le programme national Phare et la méthode de la préoccupation partagée, adaptée par Jean-Pierre Bélon, marquent une rupture avec l'approche punitive traditionnelle.
Cette méthode non-accusatoire vise à responsabiliser les intimidateurs en les impliquant dans la recherche de solutions pour le bien-être de la victime, transformant ainsi leur comportement par l'empathie.
4. Prévention et Reconstruction : La prévention commence dès l'école primaire, avec des programmes axés sur l'intelligence émotionnelle, la communication non-violente ("messages clairs") et le développement de la confiance en soi.
Pour les victimes, la reconstruction est un long processus impliquant des thérapies (comme celles de l'association Marion la main tendue) pour surmonter des traumatismes profonds tels que la phobie scolaire et la perte d'estime de soi, qui peuvent persister des décennies plus tard.
En conclusion, si le harcèlement scolaire a longtemps été banalisé, une prise de conscience sociétale, catalysée par des drames comme celui de Dina, a conduit à une évolution législative et à l'adoption de méthodes préventives prometteuses.
Celles-ci reposent sur une approche systémique, éducative et empathique, visant à transformer le climat scolaire pour garantir la sécurité et le bien-être de chaque élève.
--------------------------------------------------------------------------------
Dina, 13 ans, est décrite par son frère, Ryan Gontier, comme une jeune fille "en avance sur son temps", intelligente, curieuse de la politique et de l'actualité, ce qui a suscité la jalousie de ses amies.
• Facteurs Déclencheurs : Le harcèlement a commencé en 4ème (2019) lorsque ses amies ont commencé à lui reprocher son intelligence et sa manière de s'exprimer : "tu es toujours en train de nous corriger parce qu'on parle pas bien français par rapport à toi." Le harcèlement s'est intensifié lorsque Dina a commencé à s'intéresser au courant LGBT et à évoquer la possibilité d'aimer aussi bien les filles que les garçons, menant à son exclusion du groupe.
• La Trahison : Un tournant tragique a eu lieu lorsqu'une de ses amies a prétendu être lesbienne pour sortir avec elle.
Après une vingtaine de jours, elle a rompu brutalement en révélant la supercherie : "Mais moi je t'aime pas, c'est pas vrai. Je tiens à inventer cette histoire."
• L'Escalade du Harcèlement : La nouvelle a été propagée dans la cour du collège, déclenchant des insultes homophobes ("guine", "lesbienne") et des violences physiques.
Le harcèlement s'est ensuite étendu à son physique ("trop grosse") et à ses vêtements.
Sa mère témoigne : "Elle pouvait porter n'importe quoi. C'était prétexte à se faire insulter."
• Première Tentative de Suicide : En mars 2021, profondément blessée, Dina fait une première tentative de suicide par ingestion de médicaments.
Hospitalisée, elle explique ne plus vouloir vivre pour ne pas affronter les moqueries à son retour au collège.
• Le Retour Impossible : Son retour au collège est un calvaire. Sa mère raconte recevoir des appels de détresse : "Maman, je suis aux toilettes. Maman, je vais mourir. Maman, il faut venir me chercher."
• Le Suicide : Malgré un changement de lycée en septembre 2021, une rencontre fortuite avec ses anciennes harceleuses à la cantine un mois plus tard a ravivé son traumatisme. "Je pense qu'elle s'est dit ça va recommencer", analyse son frère.
Une semaine après, Dina met fin à ses jours en se pendant dans son armoire.
Lucas, 13 ans, s'est suicidé en janvier 2023 après avoir été harcelé en raison de son homosexualité et de sa réussite scolaire au collège Louis Armand de Golbey.
• Affirmation de Soi : Lucas avait fait son coming-out à sa mère, qui l'avait pleinement soutenu : "Sois heureux mon fils parce que je le savais déjà en fait."
Il est décrit comme un très bon élève, assidu et participatif, ce qui aurait provoqué la jalousie d'autres élèves.
• Harcèlement Continu : Dès son arrivée au collège, Lucas subit des insultes sur son physique, sa manière de s'habiller et de parler, et son orientation sexuelle. Sa mère explique : "Ça a été crescendo avec les quatre élèves dont il m'avait donné les noms déjà."
• Un Refuge dans la Danse : Lucas trouvait un exutoire et un espace d'acceptation dans un club de danse hip-hop, basé sur des valeurs de diversité et d'unité.
• L'Acte Final : Le harcèlement s'est poursuivi jusqu'à la veille de sa mort.
Sa mère pense que les insultes du vendredi 6 janvier ont été "la goutte de trop."
Il a été retrouvé pendu par sa petite sœur de 5 ans et son ex-conjoint.
Sa mère interprète son geste : "Je pense que c'était pour couper sa voix en fait. C'était pour dire stop."
Dans les deux cas, la réponse des institutions scolaires est présentée comme largement insuffisante.
• Pour Dina : Les parents ont rencontré la Conseillère Principale d'Éducation (CPE) à plusieurs reprises.
Au lieu de confronter les harceleuses, la CPE a demandé à Dina d'écrire leurs noms sur un papier, une tâche que l'adolescente, tremblante, n'a pas pu accomplir.
Cette approche a mis le fardeau de la preuve et de la dénonciation sur la victime déjà fragilisée.
• Pour Lucas : Sa mère a signalé les faits et les noms des harceleurs.
Seul un professeur a réagi en envoyant un communiqué à ses collègues, mais sans suite. "Il y a pas eu de convocation des parents, il y a rien eu." Les sanctions n'ont été prises qu'après le drame : les quatre élèves responsables ont été exclus 14 jours après le décès de Lucas. "C'est avant qu'il aurait fallu le protéger."
• Banalisation du Harcèlement : Un expert souligne une tendance historique en France à banaliser les brimades, considérées à tort comme "formatrices".
Or, "on sait aujourd'hui que ces brimades répétées, ces insultes à répétition, elles sont dévastatrices."
Les familles ont également dû faire face à un système judiciaire qui a, dans un premier temps, nié la gravité des faits.
• Affaire Dina : L'enquête a été initialement classée sans suite par la procureure. La famille a appris cette décision par la presse.
Le procureur a suggéré que Dina s'était suicidée en raison de sa "fragilité psychologique" et que "rien ne s'était passé dans le collège".
La famille a dû se constituer partie civile pour que l'enquête reprenne finalement en novembre 2023, sur la base de chefs d'accusation incluant harcèlement, provocation au suicide et homicide involontaire.
• Affaire Lucas : En juin 2023, les quatre harceleurs ont été reconnus coupables de harcèlement, mais le tribunal a refusé d'établir un lien avec le suicide.
En novembre 2023, la condamnation a été annulée par la cour d'appel de Nancy, qui a estimé que le harcèlement n'était pas prouvé, ni son effet sur la santé mentale de Lucas.
Sa mère a annoncé un pourvoi en cassation. Les harceleurs, se sentant acquittés, continueraient de rire en parlant de Lucas.
L'affaire Dina a cependant eu un impact législatif majeur, conduisant au vote en mars 2022 d'une nouvelle loi créant le délit de harcèlement scolaire, passible de peines allant jusqu'à 10 ans de prison et 150 000 € d'amende en cas de tentative de suicide de la victime.
Face à l'échec des approches traditionnelles, des méthodes alternatives axées sur la prévention et l'empathie sont mises en place dans certains établissements, notamment dans le cadre du programme national Phare.
Adaptée en France par Jean-Pierre Bélon, cette méthode vise à résoudre les situations de harcèlement sans passer par l'accusation et la sanction, qui se révèlent souvent contre-productives.
• Principe Clé : Au lieu de confronter l'intimidateur, l'équipe éducative le convoque en lui exprimant son inquiétude pour la victime.
L'objectif est de le transformer en acteur de la solution. On lui demande : "qu'est-ce qu'il pourrait mettre en place pour cet élève ?"
• Posture de l'Adulte : L'entretien doit être court, direct et ferme, mais courtois.
L'adulte ne doit pas entrer dans un débat argumentatif ("c'est elle qui a commencé") mais maintenir le cap sur le mal-être de la victime.
L'autorité est incarnée par la certitude que les brimades doivent cesser.
• Efficacité : Cette méthode montre des résultats très positifs.
Elle permet de "casser ce cercle vicieux" et de créer une nouvelle dynamique. Un principal de collège, Philippe Weis, témoigne que grâce à cette approche, de nombreuses situations (46 en avril) sont réglées avant de devenir graves.
Le programme Phare prévoit la formation d'élèves ambassadeurs pour jouer un rôle de "sentinelle".
• Rôle : Ces élèves sont formés pour détecter les situations de harcèlement, écouter leurs camarades et alerter les adultes.
Ils ne sont pas des "balances" mais des relais de confiance. Comme l'explique un élève : "Nous, on est des enfants et eux aussi et ils se sentent plus peut-être plus en sécurité."
• Motivation : Beaucoup d'ambassadeurs, comme Charlotte, ont eux-mêmes été victimes de harcèlement, ce qui renforce leur engagement. Dans un collège, 30 élèves se sont portés volontaires pour 12 places initialement prévues.
La lutte contre le harcèlement commence dès le plus jeune âge par le développement de compétences psychosociales.
• Intelligence Émotionnelle : Une école primaire de la banlieue parisienne a mis en place des outils pour aider les enfants à identifier et nommer leurs émotions (par exemple, un système de "souris" de différentes couleurs à l'entrée de la classe).
• Méthode des "Messages Clairs" : Les élèves de CM2 apprennent à gérer les conflits en exprimant leur ressenti de manière structurée et non-violente, à l'écart des autres.
Un élève dit à un autre : "Quand tu m'as déplacé mon manteau, je me suis senti mal parce que tu fais ça tout le temps. J'aimerais que tu arrêtes s'il te plaît."
• Confiance en Soi : La directrice de l'école insiste sur l'importance de la confiance en soi, qui permet à un enfant de "réagir face à des brimades" et de "solliciter l'adulte" si besoin.
Le harcèlement laisse des cicatrices psychologiques profondes et durables.
• Savana : Harcelée pour ses bonnes notes, elle a développé une phobie scolaire et sociale qui l'a contrainte à arrêter ses activités extrascolaires. "Ils ont complètement gâché ma vie en fait."
Grâce à l'association Marion la main tendue, elle participe à des groupes de parole et des séances de thérapie où elle apprend à "mettre des mots sur ses maux (m-a-u-x)".
• Julien Masquino : Harcelé 20 ans avant Lucas dans le même collège pour son "côté un peu efféminé", son "embonpoint" et son "langage châtié", il a souffert de l'effet de meute.
Le harcèlement a détruit son estime de soi : "Vous vous dites qu'un moment peut-être que si je suis victime c'est que je le mérite."
Il a repris confiance en lui grâce au sport et enseigne aujourd'hui le self-défense à des adolescents.
Pour les familles des victimes, le deuil est inextricablement lié à la reconnaissance du harcèlement comme cause du décès.
• Le frère de Dina déclare : "Je pense pas que mes parents et moi on puisse faire notre deuil sans que son harcèlement scolaire soit reconnu comme étant la cause de son suicide."
• La douleur est constante, comme en témoigne le texte lu à la fin du document :
Ton visage, ton sourire me hante, tes câlins, tes mots doux me manquent. [...] J'aimerais tellement savoir si de là-haut tu pouvais me voir, si de là où tu pouvais comprendre que sans toi plus rien n'a de sens.
Synthèse sur les Auteurs Mineurs de Violences Sexuelles
Ce document de synthèse analyse les témoignages et expertises concernant des mineurs auteurs de violences sexuelles.
L'analyse révèle une corrélation quasi systématique entre le passage à l'acte et un historique de victimisation durant l'enfance.
Ces jeunes, loin d'être des "monstres", sont souvent des individus au psychisme "cabossé" par des traumatismes précoces, notamment des abus sexuels, des dysfonctionnements familiaux profonds (abandon, négligence, secrets) et une exposition précoce à une pornographie violente.
Le passage à l'acte est mû par des mécanismes psychologiques complexes tels que la répétition traumatique, l'identification à l'agresseur, la vengeance ou une dépendance compulsive.
Face à cette complexité, la prise en charge psychiatrique et psychologique est présentée comme un levier fondamental et efficace.
Elle vise à la fois la responsabilisation de l'auteur et la compréhension des racines de son acte, permettant une évolution positive et un faible taux de récidive.
L'impact sur les familles, qualifiées de "victimes collatérales", est immense, marqué par la culpabilité, la honte et un besoin crucial de soutien.
Enfin, le document souligne un manque criant de moyens dédiés à la santé mentale des jeunes et l'urgence de renforcer la prévention, arguant que prendre en charge les auteurs est une forme essentielle de protection des futures victimes.
--------------------------------------------------------------------------------
L'un des constats les plus saillants émergeant des sources est le lien direct entre le statut de victime dans l'enfance et celui d'agresseur à l'adolescence.
La quasi-totalité des parcours examinés débute par une expérience traumatisante de violence sexuelle subie.
• Traumatisme Précoce comme Racine du Comportement :
Un expert psychiatre souligne qu'un jeune homme consommateur de pédopornographie "a subi des violences sexuelles lorsqu'il était lui-même enfant et qui a marqué son cerveau de cette expérience".
Cette expérience, même "fugace", a été "extrêmement choquante" et a "traumatisé" son psychisme.
• Reproduction de Schémas Subis : Un homme, qui a agressé deux mineurs à 14 ans, avait été lui-même violé par son frère aîné dès l'âge de 8 ans.
Il explique que son frère lui a appris ces actes "sous forme de jeu".
Plus tard, son propre passage à l'acte visait à "assouvir la pulsion pour retrouver le bien-être" qu'il associait à la fin de la relation abusive avec son frère, percevant cette dynamique comme "la normalité".
• De la Victimisation à l'Agression au sein de la Fratrie : Un autre témoignage relate un homme abusé par son beau-père dès l'âge de 3 ans, forcé de tourner dans des films pornographiques et d'abuser de sa propre petite sœur.
Il exprime son incapacité à se pardonner, le beau-père lui ayant martelé "Tu vas me ressembler, tu vas me ressembler".
Le passage à l'acte chez les mineurs s'inscrit dans un contexte de vulnérabilités personnelles et de dynamiques familiales complexes, catalysé par des mécanismes psychologiques spécifiques.
Les témoignages mettent en lumière des environnements familiaux profondément insécurisants qui constituent un terreau fertile pour le développement de comportements déviants.
• Rupture des Liens Affectifs : Une jeune femme explique son passage à l'acte sur son petit frère par le divorce de ses parents, son sentiment d'abandon par un père avec qui elle était "fusionnelle" et la dépression de sa mère.
Elle se sentait seule, sans "place", et nourrissait des "envies de mourir".
• Le Poids des Secrets de Famille : Dans un cas, le fils passe à l'acte alors qu'il est révélé plus tard que l'ex-compagnon de la mère était lui-même auteur de violences sexuelles sur d'autres enfants de la famille.
Le passage à l'acte du fils est interprété par une thérapeute comme une manière inconsciente de "faire exploser tout ça".
• La Négligence Parentale : Un agresseur exprime de la "colère envers mes parents qui n'ont rien vu", soulignant que le manque de surveillance et de protection est un facteur aggravant.
L'environnement familial est décrit comme "un système de toutes les sécurités mais aussi de tous les dangers".
Plusieurs logiques psychologiques distinctes semblent présider au passage à l'acte.
| Mécanisme | Description | Exemples et Citations | | --- | --- | --- | | La Dépendance | Le comportement devient une compulsion, une addiction qu'il faut nourrir pour apaiser une angoisse ou un manque. | Un consommateur de pédopornographie décrit son envie comme une "faim" ou une "soif" qu'il doit "nourrir \[...\] quotidiennement". Il note que "à force de consommer, on se satisfait plus de ce qu'on a en fait et on cherche toujours plus en fait plus de sensation". | | La Vengeance | L'agression est une forme d'agressivité déplacée, dirigée vers une cible de substitution pour punir une injustice perçue. | Une jeune femme ayant agressé son petit frère explique : "C'était de la haine, de l'injustice. Mon petit frère a pris ma place \[...\] C'était une vengeance avec le recul d'aujourd'hui. C'était pour le punir". | | La Répétition Traumatique | L'individu rejoue activement le trauma subi, passant du rôle de victime passive à celui d'agresseur actif, dans une tentative inconsciente de maîtriser l'expérience. | Un homme abusé par son beau-père explique qu'il a reproduit les actes car il a été "démoli psychologiquement". Un autre, abusé par son frère, n'avait "pas la conscience de faire mal" car pour lui, c'était la "normalité". | | Théorie du "Foutu pour Foutu" | L'enfant internalise un sentiment de dévalorisation profonde et agit de manière à confirmer cette mauvaise image de lui-même. | Un psychiatre explique ce mécanisme : "puisque je suis pas bon, autant que je sois vraiment pas bon. Et une fois que j'ai fait quelque chose \[...\] là je mérite qu'on ne s'occupe plus de moi". |
Face à la gravité des actes, les experts et les témoignages insistent unanimement sur le rôle crucial du soin et de l'accompagnement psychologique pour prévenir la récidive et permettre la reconstruction.
La prise en charge est un processus structuré et multifacette.
• Évaluation et Responsabilisation : La première étape consiste en une "évaluation" pour cerner "le trouble du jeune" et son niveau de "dangerosité".
Le but n'est pas de "minimiser ou le banaliser" l'acte, mais de mettre les jeunes "face à leur responsabilité".
• Approches Thérapeutiques : Le soin est principalement "psychothérapeutique", en groupe ou en individuel, et peut s'accompagner d'une "prise en charge médicamenteuse". L'objectif est de trouver la racine du mal pour "le soigner depuis la racine".
• Briser l'Isolement : Un psychiatre identifie le problème central comme "la question de la solitude et l'isolement". La thérapie offre un espace pour parler et ne plus "rester tout seul".
Les experts se montrent optimistes quant aux perspectives d'évolution positive des mineurs pris en charge.
• Évolution Positive : Une mère témoigne que son fils, après sa condamnation et son suivi, a "littéralement changé", a "pris en maturité" et en "réflexion".
• Faible Taux de Récidive : Un professionnel affirme que "dans les faits, il y a peu de récidives".
Prendre en charge un jeune "tôt" permet une intervention "active, précoce" et de "l'orienter vers le mieux".
• Une Vision Humaniste : La prise en charge repose sur le postulat que "Ce ne sont pas des monstres, ce sont des jeunes qui commettent fait monstrueux".
Un psychiatre affirme : "je ne renoncerai jamais à accompagner un patient dans sa quête de ne plus recommencer".
• Protéger les Futures Victimes : L'argument est clairement posé : "mieux on va prendre en charge les auteurs, moins il y aura de victimes. Donc, on a tout intérêt à travailler ensemble."
Les familles des jeunes auteurs sont profondément et durablement affectées, portant un fardeau de douleur, de culpabilité et de questionnements.
• Les Parents, "Victimes Collatérales" : Une mère décrit l'onde de choc de la révélation : "c'est tout votre monde s'écroule".
Les émotions ressenties incluent "colère, de honte, de culpabilité, de jugement". Beaucoup se demandent "qu'est-ce qu'elles ont fait pour en arriver là".
La culpabilité est omniprésente : "si j'avais fait ce qu'il fallait, peut-être ça serait jamais arrivé".
• La Gestion du Secret : La question de la parole est centrale. Un couple en thérapie s'interroge sur le moment et la manière d'expliquer le passé du père (victime et auteur) à leurs filles.
L'enjeu est de transmettre la vérité sans créer de jugement ou de confusion, reconnaissant que "quand un enfant pose une question, il faut lui répondre".
• La Reconstruction Familiale : Malgré le tsunami, la thérapie familiale aide à "analyser la situation et à voir les choses autrement".
Une mère explique comment, après la révélation des secrets, la famille "reconstruit" et que ses "enfants se parlent".
Les témoignages convergent vers un constat alarmant sur l'état des ressources allouées à la jeunesse et un appel pressant à l'action.
• Manque de Moyens : Un constat est dressé sur le "manque criant de moyens à la disposition de leur santé mentale, physique et sexuelle" des enfants.
• Urgence de la Prévention : La prévention est jugée "indispensable" mais "pas encore assez présente" dans les mentalités.
Son développement est considéré comme "bénéfique pour tous les mineurs".
• Un Appel à l'Action : La conclusion est sans appel : "La situation est très urgente".
Il est impératif que la société dans son ensemble gagne à "prendre soin de ses enfants même quand ils ont commis des faits aussi graves".
Synthèse du débat sur la santé mentale et la schizophrénie
Résumé Exécutif
Ce document synthétise les échanges d'un débat entre experts, soignants, représentants d'associations et une personne concernée, centré sur la schizophrénie et les troubles psychiques en France.
Les discussions mettent en lumière plusieurs constats critiques : la stigmatisation profondément ancrée autour des maladies psychiques sévères, qui engendre honte et isolement, reste un obstacle majeur.
Le parcours de soin est un véritable "labyrinthe", caractérisé par un délai de prise en charge moyen d'un an et demi après les premiers symptômes et des diagnostics initiaux souvent complexes et incertains.
Une révolution s'opère cependant dans l'approche des soins, passant d'un modèle paternaliste à une vision centrée sur le "rétablissement" de la personne, où le patient devient l'acteur principal de son projet de vie, soutenu par sa famille qui est désormais considérée comme un partenaire essentiel.
Enfin, le débat souligne les faiblesses structurelles du système psychiatrique français, marqué par un manque de moyens endémique, de fortes inégalités territoriales d'accès aux soins et un besoin crucial de décloisonnement entre les différents acteurs sanitaires, sociaux et professionnels.
L'espoir, porté par les pairs-aidants et une approche plus humaine, émerge comme le moteur fondamental de la reconstruction des parcours de vie.
--------------------------------------------------------------------------------
Introduction
Suite à la diffusion du documentaire "Nous, schizophrènes et combattants", un débat a réuni plusieurs acteurs clés du domaine de la santé mentale pour discuter des défis liés à la schizophrénie et aux troubles psychiques.
Les intervenants ont partagé leurs expertises et expériences sur la détection, la prise en charge et les perspectives de rétablissement, tout en abordant l'état du système psychiatrique en France.
Participants au débat :
• Léopole de Pomier : Patient et pair-aidant à l'association Père et danse Montpellier.
• Alexandre de Conor : Docteur en psychologie, responsable du centre de rétablissement et de réhabilitation Jean Mainviel à Montpellier.
• Étienne Verry : Praticien hospitalier au CHU de Toulouse et au centre expert schizophrénie.
• Michel Comte : Délégué régional de l'Unafam Occitanie (Union nationale de familles et amis de personnes malades et/ou handicapées psychiques).
--------------------------------------------------------------------------------
La perception sociale des troubles psychiques, et en particulier de la schizophrénie, reste un obstacle majeur au diagnostic, à la prise en charge et au rétablissement.
• Persistance des clichés : La schizophrénie est encore largement et à tort associée à la "double personnalité" dans les médias et l'imaginaire collectif.
Alexandre de Conor souligne que "c'est encore un mot qui est utilisé pour désigner un changement de comportement brusque".
• Honte et auto-stigmatisation : Les personnes concernées intériorisent cette image négative. Julien, dans le documentaire, se dit "rouge de honte", ce à quoi sa mère répond : "Un diabétique n'a pas honte d'être malade".
Cette stigmatisation a des conséquences concrètes : isolement, difficultés d'accès aux relations amicales, amoureuses, au logement.
• Vulnérabilité accrue : Contrairement à l'image du "fou dangereux", les chiffres montrent que les personnes souffrant de schizophrénie sont plus souvent victimes de personnes malveillantes que auteurs de violences. Alexandre de Conor insiste : "les chiffres nous montrent que c'est des gens qui sont plus victimes".
• Barrières culturelles et religieuses : Léopole de Pomier témoigne de l'influence de certaines croyances qui associent la maladie à une forme de possession : "on pense que c'est des esprits qui nous habitent et tout. Ça, je trouve que c'est une vraie bêtise".
L'accès aux soins est un processus long et complexe, souvent qualifié de "parcours du combattant" pour les personnes et leurs familles.
• Délai de prise en charge : En France, comme en Europe, la durée moyenne entre l'apparition des premiers symptômes psychotiques et la première prise en charge spécialisée est d'environ un an et demi.
Ce délai est un enjeu majeur sur lequel il est possible d'agir.
• Difficultés du repérage précoce : Les premiers signes apparaissent souvent à l'adolescence et peuvent être confondus avec une "crise d'adolescence un peu violente", retardant ainsi le début d'un accompagnement adapté.
• Un système de soins labyrinthique : Alexandre de Conor décrit le système comme "un labyrinthe en fait entre la psychiatrie, le médico-social".
Cette complexité et le manque de communication entre les structures peuvent décourager les familles et faire perdre un temps précieux.
• La prudence du diagnostic :
◦ Étienne Verry explique qu'un diagnostic posé trop rapidement lors d'un premier épisode psychotique se révèle erroné dans un cas sur deux à cinq ans.
La prudence est donc de mise, en parlant initialement de "premier épisode psychotique" plutôt que de schizophrénie.
◦ Alexandre de Conor ajoute que des diagnostics hâtifs peuvent être dangereux, notamment pour les minorités ethniques ou les populations défavorisées, et mener à des propositions de soins inadaptées (ex: prescription de neuroleptiques non justifiée).
Une transformation profonde de l'approche des soins est en cours, axée sur la personne, son projet de vie et son rétablissement.
• L'hospitalisation sous contrainte : Souvent redoutée, elle est décrite par la mère de Julien comme "la pire décision de ma vie".
Michel Comte la qualifie d'expérience "violente" et "terrible" pour une famille. Les intervenants s'accordent sur la nécessité de l'éviter au maximum grâce à une intervention précoce et des équipes mobiles, tout en reconnaissant sa nécessité dans certaines situations de perte de contact avec la réalité.
• Du soin à la guérison, au rétablissement : La schizophrénie étant une maladie chronique, on ne parle pas de guérison mais de "rétablissement".
Il s'agit de "vivre une vie satisfaisante et qui a du sens pour la personne malgré cette présence de la maladie" (Alexandre de Conor).
• L'approche centrée sur la personne :
◦ Cette approche constitue une "petite révolution" face à une médecine historiquement "patriarcale et très autoritaire" (Étienne Verry).
◦ Elle implique de ne plus parler des personnes sans leur présence et de partir de leurs projets (emploi, logement) pour proposer un accompagnement.
◦ Exemple concret : Si un jeune veut reprendre un emploi mais est gêné par des voix, on lui propose une aide pour gérer ce symptôme au service de son objectif professionnel.
◦ Cela implique d'accepter une prise de risque accompagnée, par exemple en soutenant un jeune qui souhaite essayer d'arrêter son traitement, car "s'il a décidé de le faire, si on lui dit non, il le fera sans nous" (Alexandre de Conor).
La famille, longtemps tenue à l'écart ou culpabilisée par la psychiatrie, est aujourd'hui reconnue comme un pilier du rétablissement.
• De la culpabilité à la solution : Michel Comte décrit le parcours des familles, qui passent souvent par le déni, la sidération et un sentiment de culpabilité ("Qu'est-ce que j'ai loupé ?") avant de comprendre qu'elles ne sont "pas le problème" mais "la solution".
• L'impact du soutien familial : Les chiffres confirment que lorsque les familles comprennent la maladie et sont soutenantes, "clairement ça a un impact très fort sur le rétablissement".
• L'intégration des familles aux soins : Des programmes de psychoéducation, comme le programme BREF, sont mis en place pour intégrer les familles, les personnes concernées et les soignants dès le début de la maladie.
• Soutien par les pairs-aidants familiaux : Des associations comme l'Unafam, composées de proches et d'aidants, offrent un espace d'écoute, de partage et de "reconstruction" pour les familles qui se sentent "en miettes".
Le débat a mis en exergue les failles structurelles du système de santé mentale français, qui freinent l'accès à des soins de qualité pour tous.
• Manque de moyens et de personnel : Le secteur souffre d'un "manque de moyen endémique". Une grande proportion des postes de psychiatres dans les établissements publics ne sont pas pourvus.
• Inégalités territoriales : L'accès aux soins est très inégal. Des départements comme le Gers ou l'Ariège comptent moins de 6 psychiatres pour 100 000 habitants.
Les Centres Médico-Psychologiques (CMP), essentiels dans la psychiatrie de secteur, connaissent des dysfonctionnements majeurs dans certains territoires, avec des délais de rendez-vous de plusieurs mois.
• Nécessité de décloisonnement : Il y a un manque critique de coordination entre la psychiatrie, les autres spécialités médicales (pour les maladies somatiques comme l'obésité liée aux traitements) et les secteurs social et professionnel. La fonction de "case manager" est présentée comme un outil pour orchestrer le parcours du jeune.
• Nouveaux modèles à développer : L'importance de l'approche "aller vers", qui consiste à se déplacer pour rencontrer les jeunes là où ils sont, est soulignée.
Ce modèle est efficace mais coûteux car il requiert d'importantes ressources humaines.
Malgré les difficultés, un message d'espoir traverse l'ensemble du débat, incarné par de nouvelles approches et la valorisation de l'expérience vécue.
• Le pouvoir de l'espoir : Il est crucial de lutter contre la représentation fataliste de la schizophrénie. Étienne Verry rappelle que 20% des patients connaissent un rétablissement complet, parfois même sans traitement, et que le pronostic est donc extrêmement variable. La maladie ne doit pas "tuer l'ambition, le rêve".
• La pair-aidance : Le rôle de Léopole de Pomier est emblématique.
En tant que pair-aidant, il utilise son propre parcours pour aider les autres : "Si j'ai le contrôle sur ma maladie, je peux aider les autres". Cette transmission d'expérience donne de l'espoir et des outils concrets.
• La force du collectif : Les groupes de parole, pour les personnes concernées comme pour les proches, sont des lieux d'enrichissement mutuel où les expériences et les stratégies sont partagées.
• Le combat pour l'inclusion : Le mot "combattant" du titre du documentaire est validé par tous les participants.
C'est un combat pour le rétablissement personnel, mais aussi un combat sociétal pour "abattre les stéréotypes" et pour l'inclusion.
Comme le conclut Étienne Verry, améliorer le pronostic des jeunes est "une affaire de tous. C'est pas juste une affaire de la santé".
Dossier d'Information : Le Groupe de Protection des Mineurs
Ce document de synthèse analyse le fonctionnement, les défis et les succès d'un Groupe de protection des mineurs (GPM) au sein de la gendarmerie, basé sur des extraits d'enregistrements.
Il met en lumière une problématique de violences sur mineurs d'une ampleur alarmante sur le territoire du Plateau Picard, avec une fréquence d'un viol tous les six jours et trois nouveaux dossiers par semaine, un constat qui a motivé la création de cette unité spécialisée.
Le groupe a été formé pour rationaliser et professionnaliser le traitement de ces affaires complexes et urgentes, souvent mal gérées par des militaires non formés.
Les résultats sont probants, avec une réduction drastique des délais de traitement des procédures de plusieurs mois à seulement trois ou quatre mois.
La méthodologie du groupe repose sur deux piliers : une prise en charge immédiate et bienveillante des victimes pour éviter les rétractations, et l'application d'un protocole d'audition judiciaire rigoureux pour les enfants, visant à recueillir un témoignage précis et non-induit, essentiel pour caractériser les infractions.
Parallèlement, les interrogatoires des mis en cause (gardes à vue) sont menés avec une stratégie mêlant pression psychologique, analyse de preuves numériques et recherche de rapport humain pour obtenir des aveux.
Le travail des enquêteurs est psychologiquement éprouvant, les confrontant à des "actes de barbarie" et à une misère humaine intense.
Pour y faire face, ils développent une "carapace" et s'appuient sur une cohésion de groupe exceptionnelle, décrite comme une relation amicale fondamentale à leur équilibre et à l'efficacité de l'unité.
Cette solidarité, combinée à une forte conscience de leur mission de protection de l'enfance, constitue le moteur de leur engagement.
--------------------------------------------------------------------------------
À son arrivée, un responsable a rapidement constaté que la priorité de la lutte contre la délinquance (cambriolages, stupéfiants) masquait un problème plus profond et plus grave : l'ampleur des violences, en particulier celles commises sur les mineurs.
• Volume des affaires : La compagnie enregistrait environ trois nouveaux dossiers par semaine concernant des violences sur mineurs.
• Gravité des faits : Les statistiques révélaient un viol tous les six jours sur le territoire de la compagnie, une fréquence jugée effrayante.
• Lieux des violences : Ces actes se produisaient dans divers contextes : le milieu familial, les foyers et les écoles.
Avant la création du groupe, le traitement de ces affaires présentait de graves lacunes :
• Manque de formation : Certains militaires ne se sentaient pas capables de traiter ces dossiers sensibles.
• Prise en charge inadaptée : Les victimes n'étaient pas prises en charge correctement, ce qui compromettait le recueil de la parole.
• Lenteur des procédures : Les dossiers "traînaient sur les bureaux", accumulant des mois de retard, ce qui nuisait à l'efficacité de la réponse pénale.
Face à ce constat, la décision a été prise de "rationaliser ce travail" en créant un groupe d'enquêteurs spécialisés et dédiés, afin de concentrer les compétences et de traiter ces affaires complexes en urgence.
Malgré un scepticisme initial ("Au mois de septembre, le groupe il est mort, il existera pas"), le groupe a rapidement prouvé son efficacité :
• Réduction des délais : Le temps de traitement des procédures a été réduit à une moyenne de trois à quatre mois, contre des retards de plusieurs mois auparavant.
• Professionnalisation : L'unité permet une gestion centralisée et experte des dossiers, garantissant que les enquêtes sont menées par du personnel formé.
L'un des principes cardinaux du groupe est l'intervention rapide auprès des victimes.
• L'urgence de l'écoute : "Le plus important, c'est la prise en compte immédiate des victimes. [...] si on attend des fois peut-être deux jours, c'est suffisant pour qu'elle se rétracte parce que ils vont penser aux conséquences."
• Le rôle proactif : Les enquêteurs se déplacent immédiatement pour rassurer les victimes et leur signifier leur soutien ("maintenant on est là, on va vous aider").
L'audition d'un enfant victime est une étape cruciale et encadrée par un protocole strict.
• Objectif judiciaire : L'audition vise à recueillir des éléments permettant de "caractériser l'infraction" et d'éviter un "classement sans suite".
Le témoignage de l'enfant est souvent la pièce maîtresse du dossier.
• Le protocole comme guide : Un protocole d'audition filmée est utilisé pour rassurer l'enquêteur et l'enfant.
Il fournit des outils pour ramener l'enfant sur le sujet de la discussion et instaure un climat de confiance.
• Le danger de la suggestion : La principale difficulté est de ne jamais induire les réponses. "Il faut surtout pas suggérer à l'enfant quand on fait les auditions quoi que ce soit en fait."
Des erreurs, comme des questions fermées ou suggestives, peuvent être "préjudiciables" à la procédure.
• La gestion du stress : Le stress de l'enquêteur peut le faire "perdre pied". Il est conseillé de faire des pauses pour se recentrer.
Les enregistrements détaillent une garde à vue de 48 heures, illustrant la stratégie des enquêteurs.
| Étape | Description | | --- | --- | | Interpellation | L'opération est menée à 6h du matin pour créer un effet de surprise. Le dispositif est sécurisé pour parer à un risque de fuite, même si l'individu n'est pas connu comme violent. | | Perquisition | Une fouille minutieuse du domicile est effectuée, avec saisie de tout le matériel informatique et multimédia ("Tout nous intéresse clairement"). | | Exploitation Numérique | Les enquêteurs s'appuient sur la fiabilité de la "preuve numérique" (journaux d'appels, localisation, etc.), car "on laisse toujours une trace". Un logiciel spécialisé extrait toutes les données des appareils saisis. | | Auditions | Les auditions progressent d'un "CV" général à l'abord des faits. La stratégie consiste à alterner des moments de tension et de relâchement ("C'est important dans une garde à vue qu'il y a des moments \[...\] pour souffler, pour réfléchir"). L'enquêteur confronte le suspect à ses contradictions ("vous êtes en train de vous tirer une balle dans le pied comme un con") pour briser le déni. | | Les Aveux | Les aveux sont obtenus progressivement. Le suspect passe de la négation à la reconnaissance de consultations de sites, puis à des aveux partiels sur des attouchements, et enfin à une description précise des faits, incluant une tentative de pénétration. L'enquêteur doit "mouliner" dès que le suspect "ferre le poisson" et est "prêt à parler". | | Gestion Juridique | Le procureur est tenu informé en permanence et autorise la prolongation de la garde à vue pour mener toutes les investigations nécessaires. | | Défèrement | À l'issue des 48 heures, le suspect est déféré devant le substitut du procureur, qui lui notifie les faits reprochés et saisit le juge en vue d'une détention provisoire. |
Le quotidien des enquêteurs est marqué par l'exposition à des faits d'une violence extrême.
• L'horreur des récits : "La plupart de la population pourrait pas entendre ce que nous on entend. Il y a des choses horribles. On peut aller jusqu'à des actes de barbarie."
• La nécessité d'une "carapace" : Pour se protéger, les enquêteurs doivent se détacher émotionnellement. "On se crée une carapace, on est obligé. [...] tu rentres chez toi, il faut que tu penses à autre chose."
L'un des gendarmes trouve son équilibre dans le jardinage, une activité qui "soigne le corps" et "l'esprit".
• L'impact persistant : Malgré cette protection, le travail les poursuit parfois. "Ça m'arrive hein des fois le soir d'aller me coucher, de penser aux procédures."
La principale motivation des membres du groupe est un sentiment d'utilité et la conviction de mener une mission essentielle.
• Protéger les enfants : L'objectif premier est clair : "Mon but c'est ça en fait, protéger les enfants."
La "première victoire, c'est quand l'enfant arrive à dire les choses et que on voit à la fin qui est ce soulagement chez l'enfant."
• Un travail sur le long terme : Les enquêteurs ont conscience de l'impact durable de leur action. "Je fais un travail dans le temps, je fais pas un travail dans l'immédiat. Je travaille sur des dizaines d'années. [...] on va le construire en tant qu'adulte."
• Un lien avec les victimes : Un contact direct et un "affect" se développent avec les familles, qui ont leurs numéros de téléphone et peuvent appeler même en dehors des heures de service.
La solidarité au sein de l'équipe est présentée comme la clé de voûte de leur résilience et de leur succès.
• Plus que des collègues : "On n'est pas que des collègues, on est des amis quoi.
Maintenant, c'est c'est magique quoi."
Ils se décrivent comme "quatre enquêteurs mais aussi quatre copains."
• Un soutien mutuel indispensable : "Si on avait pas ce groupe là, ça serait beaucoup plus compliqué de passer autre chose le soir quand tu rentres chez toi."
Le groupe se relance mutuellement en cas de "fatigue mentale".
• Condition de fonctionnement : "Je pense que s'il y avait pas cette cohésion entre nous quatre, le groupe ne pourrait pas fonctionner comme il fonctionne actuellement."
"Le plus important, c'est la prise en compte immédiate des victimes. [...] si on attend [...] c'est suffisant pour qu'elle se rétracte."
"Redonner le sourire à un enfant, l'aider à se reconstruire, c'est ça ça te nourrit en fait."
"Je fais un travail dans le temps, je fais pas un travail dans l'immédiat. Je travaille sur des dizaines d'années."
"La plupart de la population pourrait pas entendre ce que nous on entend. Il y a des choses horribles. On peut aller jusqu'à des actes de barbarie."
"On se crée une carapace, on est obligé. [...] tu rentres chez toi, il faut que tu penses à autre chose."
"Il faut surtout pas suggérer à l'enfant quand on fait les auditions quoi que ce soit en fait."
"Si on avait pas ce groupe là, ça serait beaucoup plus compliqué de passer autre chose le soir quand tu rentres chez toi."
"On s'appelle groupe d'atteinte aux personnes mais c'est vraiment ça, on est un groupe de quatre enquêteurs mais aussi de quatre quatre copains maintenant."
"Il faut que des groupes comme les nôtres se créent partout en France. C'est super important la prise en charge de la victime."
Synthèse sur la Prostitution des Mineurs au Sein de l'Aide Sociale à l'Enfance
Ce document de synthèse analyse une enquête approfondie sur le phénomène systémique de la prostitution des mineurs placés sous la protection de l'Aide Sociale à l'Enfance (ASE) en France.
L'enquête révèle une faille profonde dans le système censé protéger les enfants les plus vulnérables.
Le constat est accablant : une commission d'enquête parlementaire a établi que sur les 20 000 mineurs prostitués en France, 80 % sont issus des dispositifs de l'ASE.
Les foyers de l'ASE, loin d'être des sanctuaires, sont décrits comme des "zones de non-droit" où les jeunes, souvent en fugue, deviennent des proies faciles pour les réseaux d'exploitation sexuelle.
Le phénomène est alimenté par plusieurs facteurs : la précarité matérielle des jeunes (parfois 20€ d'argent de poche par mois), l'impuissance ou l'inaction des équipes éducatives face aux fugues, et des protocoles administratifs qui permettent à l'institution de se déresponsabiliser.
Des témoignages poignants de jeunes filles, dont certaines ont été exploitées dès l'âge de 11 ans, illustrent des parcours de traumatismes répétés, incluant séquestration, violences et proxénétisme au sein même des foyers.
L'enquête met également en lumière l'impunité relative des clients, comme le démontre un procès à Albi où 18 hommes ont été condamnés à de simples amendes pour avoir eu des relations avec une jeune fille de 15 ans.
Face à ce scandale, les responsables politiques des départements, qui ont la tutelle de l'ASE, tendent à minimiser leur responsabilité, invoquant une problématique de société qui les dépasse.
Face à ce tableau sombre, des familles se mobilisent et engagent des poursuites judiciaires contre les départements pour "faute lourde".
En parallèle, une initiative unique, la Maison Gaia près de Lille, démontre qu'une prise en charge spécialisée, sécurisée et bienveillante peut offrir une voie de reconstruction à ces jeunes victimes. Cependant, cette structure reste une exception dans un système en crise profonde.
Le reportage expose une réalité alarmante qualifiée de "pandémie" et de "raz de marée" par les acteurs du secteur.
La prostitution des mineurs placés n'est pas un fait isolé mais un problème structurel et national, touchant des villes comme Paris, Marseille et Albi.
• Statistiques Choc : Une commission d'enquête parlementaire d'avril 2025 révèle que 80 % des 20 000 mineurs prostitués en France sont placés sous la responsabilité de l'ASE.
• Explosion du Phénomène : Le nombre de cas a été multiplié par 10 en 10 ans.
• Des Foyers Ciblés : Les proxénètes connaissent les adresses des foyers et les ciblent délibérément, attendant à l'extérieur que les jeunes sortent ou fuguent.
Une éducatrice à Marseille confirme : "Vous venez 21h, 22h, il y a plein de proxos devant les portes."
Les foyers, censés être des lieux de protection, sont décrits comme des environnements favorisant l'exploitation.
• Une "Zone de Non-Droit" : Une mère de famille qualifie l'ASE de "zone de non-droit où les jeunes sont livrés à eux-mêmes".
Les éducateurs ne peuvent légalement retenir les adolescents qui souhaitent sortir, facilitant ainsi les fugues et l'emprise des réseaux.
• Précarité Matérielle : Aïana, une ancienne pensionnaire, témoigne avoir reçu 20 € d'argent de poche par mois, la poussant à se prostituer à 13 ans pour acheter des produits de première nécessité (produits d'hygiène, vêtements, nourriture).
• Inaction des Équipes : Si certains éducateurs sont désabusés, d'autres semblent faire preuve d'une passivité coupable.
Une éducatrice aurait dit à une jeune fille se prostituant : "Je sais que tu as des clients ce soir mais rentre pas tard quand même."
• Déresponsabilisation Administrative : L'enquête menée en caméra cachée révèle un protocole bien rodé : lorsqu'une jeune fugue, les éducateurs remplissent une "déclaration de fugue" transmise à la brigade des mineurs.
À partir de là, l'ASE n'est "plus tenue pour responsable du sort de ces jeunes filles".
• Placements Inadaptés : Le cas d'Alice, placée à 16 ans dans un hôtel meublé pendant 6 mois (alors que la loi l'interdit au-delà de 2 mois), montre un placement dans un environnement non sécurisé, au milieu d'adultes et de résidents de passage, où la prostitution a également lieu.
Les témoignages des jeunes filles constituent le cœur de l'enquête, révélant la profondeur de la souffrance et la faillite du système.
• Témoignage de la mère d'une fille de 14 ans (Paris) : Après une fugue et des accusations de violence parentale non vérifiées, sa fille est placée.
Les parents découvrent via un détective privé (coût : 35 000 €) qu'elle sort la nuit pour se prostituer. La juge maintient le placement malgré les preuves.
• Aïana (18 ans) : A commencé à se prostituer à 13 ans dans son foyer à Paris par nécessité.
Elle affirme que les éducateurs étaient au courant mais n'offraient aucune alternative.
• Lila (16 ans, Marseille) : Victime d'exploitation dès 11 ans. Placée pour fuir des violences paternelles, elle est forcée de se prostituer par une autre jeune fille du foyer.
Elle passera par 15 foyers différents, se prostituant dans plusieurs d'entre eux.
Elle a contracté des MST (Chlamydia) sans jamais voir un médecin.
• Alice (Essonne) : Placée depuis 6 ans, elle est kidnappée à 14 ans devant son foyer, séquestrée à Toulon et forcée à se prostituer.
Elle affirme avoir alerté ses éducateurs en vain. Après avoir été libérée par la police, elle est replacée dans un autre foyer gangréné par la prostitution, puis dans un hôtel.
L'enquête identifie clairement les deux maillons de la chaîne d'exploitation.
• Le Rôle des Proxénètes :
◦ Proxénétisme Interne : Un schéma récurrent est celui où les pensionnaires plus âgées ("les grandes") deviennent les proxénètes des plus jeunes.
◦ Réseaux Structurés : Les proxénètes externes sont décrits comme "beaucoup plus structurés, beaucoup plus dangereux" et utilisent des méthodes de manipulation et de menace pour contrôler les jeunes filles et leur famille.
◦ Exploitation Financière : Les jeunes filles ne tirent quasiment aucun profit de leur exploitation.
Un éducateur explique le mécanisme : "Finalement tiens, repart avec 20 €."
• Le Profil et l'Impunité des Clients :
◦ Des Profils Variés : Lila témoigne avoir eu des clients de tous âges et de toutes professions : "des policiers comme des pompiers, des ambulanciers comme des avocats".
◦ Le Cas du Tribunal d'Albi : Un procès emblématique a eu lieu en septembre 2025. 18 hommes, clients d'une jeune fille de 15 ans placée en foyer et séquestrée, comparaissaient. Ils ont tous plaidé l'ignorance de sa minorité, bien qu'elle "paraissait mineure".
La justice les a crus, les jugeant devant un tribunal de police et les condamnant à des amendes de 500 à 700 €.
Les responsables politiques et institutionnels, directement mis en cause, peinent à assumer leurs responsabilités.
• Présidents de Départements :
◦ Christophe Ramon (Tarn, PS) : Répond par écrit en parlant de "fléau national" et de "responsabilité collective et partagée".
◦ François Durovray (Essonne, LR) : Affirme que ses services ont "correctement fait leur travail" et que la responsabilité incombe aux "voyous", à la police et à la justice.
Il nie tout problème de moyens financiers (budget de 245 millions d'euros pour l'ASE en Essonne en 2024).
◦ Martine Vassal (Bouches-du-Rhône, LR) : Refuse de commenter l'affaire judiciaire en cours, soulignant la difficulté de l'accompagnement de ces jeunes.
• Le Gouvernement : La ministre de la Santé, Stéphanie Rist, a annulé une interview prévue en réaction au reportage après que son équipe l'ait visionné.
En contraste avec l'échec généralisé, une structure se distingue.
• Un Refuge Spécialisé : Près de Lille, la Maison Gaia est un foyer unique en France, à l'emplacement secret, qui accueille 10 jeunes filles victimes de prostitution.
• Une Prise en Charge Holistique : L'approche est centrée sur la reconstruction de l'estime de soi (ateliers, repas partagés, soins esthétiques) et la reconnexion à leur corps.
L'objectif est de ne jamais couper le lien, même en cas de fugue, pour permettre un retour.
Face à l'inertie du système, les familles des victimes s'organisent pour obtenir justice.
• Procédures Judiciaires : Les mères d'Alice et de Lila ont décidé d'assigner en justice les départements de l'Essonne et des Bouches-du-Rhône pour "faute lourde".
• Action Collective : Maître Michel Hamas représente 49 familles dans des procédures similaires contre sept départements.
| Donnée | Source / Contexte | | --- | --- | | 80% | Pourcentage des mineurs prostitués en France issus de l'ASE. (Commission d'enquête parlementaire) | | 20 000 | Nombre total estimé de mineurs prostitués en France. | | 10 fois | Multiplication du phénomène de prostitution des mineurs en 10 ans. | | 11 ans | Âge de Lila lors de sa première exploitation sexuelle. | | 20 € / mois | Argent de poche d'Aïana au foyer, la poussant à se prostituer. | | 35 000 € | Somme dépensée par une famille pour un détective privé afin de prouver la prostitution de leur fille. | | 500 - 700 € | Montant des amendes infligées à 18 clients d'une mineure de 15 ans à Albi. | | 245 M€ | Budget de l'ASE pour le département de l'Essonne en 2024. | | 66 M€ | Budget de l'ASE pour le département du Tarn en 2024. |
--------------------------------------------------------------------------------
Citations Marquantes :
• Une mère de famille : "L'ASE, c'est une zone de non-droit en fait. C'est une zone où les jeunes sont livrés à eux-mêmes."
• Une juge des enfants à Marseille : "Le tribunal de Marseille, comme beaucoup de tribunaux en France, connaît une explosion de ce phénomène. (...) Nous sommes devant un raz de marée."
• Alice, victime : "La loi, c'est de la merde. Sortez tous les jeunes de là-bas. (...) Faut arrêter de faire semblant."
• Une éducatrice à Marseille : "Les clients se garent devant, l'éducateur le savait. Ma copine quand elle le faisait, l'éducatrice elle disait 'bon, je sais que tu as des clients ce soir mais rentre pas tard quand même'."
• François Durovray, Président du département de l'Essonne : "Les services du département ont correctement fait leur travail, même si effectivement il y a une situation d'exploitation sexuelle."
• Lila, victime, à propos de l'ASE : "Ils doivent répondre parce que, en soit, ils ont tué nos vies un peu."
62226
DOI: 10.1007/s00253-025-13703-y
Resource: RRID:Addgene_62226
Curator: @olekpark
SciCrunch record: RRID:Addgene_62226
62225
DOI: 10.1007/s00253-025-13703-y
Resource: RRID:Addgene_62225
Curator: @olekpark
SciCrunch record: RRID:Addgene_62225
La fuente es demasiado grande en tamaño 16. La fuente es poco convencional. En la información del ensayo en la parte superior izquierda, se omite el título de la clase. La numeración de páginas en la parte superior derecha tiene el apellido del profesor, no el del estudiante. El título “Revisión del ensayo n.º 1” es genérico, no creativo y no despierta el interés del lector. Cuando se presenta la novela, también es necesario mencionar el autor. El título de la novela está entre comillas cuando debería estar en cursiva. El personaje principal se conoce con diferentes apodos informales que no se usan en el texto, y uno está mal escrito. Siempre sea preciso y coherente con los nombres de los personajes y del autor, y asegúrese de que estén bien escritos. Hay un espacio extra después del primer párrafo y el segundo párrafo necesita sangría. Los márgenes del lado izquierdo no miden una pulgada.
In the first page of the essay, there are several MLA formatting errors. The header “Lachmayr 1” is incorrectly placed on the left instead of being right-aligned and ½ inch from the top margin, and it uses the professor’s last name instead of the student’s, which should read “Bell 1.” The date is written in the wrong format, as MLA requires “21 May 2013.” The title is not properly centered, is incorrectly capitalized, and uses improper styling, since MLA titles should be in plain text without bold, italics, or underlining. The abbreviation “n.°” in the title is not MLA style and should be written as “No. 1” or avoided. Additionally, the book title within the paragraph is incorrectly placed in quotation marks instead of italics, and there is an unnecessary space before the closing quotation mark and comma.
P = Point. This is the point of the paragraph, or the topic sentence. I = Illustration. This is where you illustrate your point with evidence E = Explanation. This is where you explain how that evidence supports your point. This is y
Point, Illistraton, Explanation
Seleccionar y colocar:
Orden Acción 1 Create a blank Logic app
2 Add a logic app trigger that fires when one or more messages arrive in the queue
3 Add an action that reads IoT temperature data from the Service Bus queue
4 Add a condition that compares the temperature against the upper and lower thresholds
5 Add an action that sends an email if temperature is outside thresholds
Este articulo surge en el contexto de mis estudios de doctorado en Comunicación, Lenguaje e Información en la Pontificia Universidad Javeriana. Trata sobre el tema del racismo en Colombia y como éste asume muchas formas; desde el mas cotidiano y vulgar, hasta el mas sutil. Fue elaborado para la asignatura de Teorías Contemporáneas de corte decolonial.
: los nietos están involucrados
Considero que es un una creencia muy arraigada en la cultura tener la posibilidad de criar nietos, compartir con ellos y que trasmiten mucha alegría, sobre todo para esa etapa de la vida donde los adultos mayores están mas solos. La pregunta que se puede dejar planteada es Considerando la tendencia de la baja natalidad ¿Como sería el involucramiento de los nietos? o ¿Como mantener esa agudeza mental o en qué otro mecanismo pensar para mantener esa agudeza mental? como el mejor entorno para asegurar una calidad de vida y la longevidad.
Los investigadores descubrieron que aquellos que asistían a los pequeños obtuvieron mejores resultados en las pruebas de memoria y fluidez verbal que los que no lo hacían
Básicamente se establece que las actividades intergeneracionales permiten múltiples beneficios al adulto mayor porque se estimula no solamente la actividad física, sino también la mental. Además del componente emocional que es muy importante.
Otras acciones como cocinar, recoger a los menores de la escuela y estar disponible cuando se necesita se relacionaron positivamente con la fluidez verbal.
Esto se relaciona mucho con las neurociencias y particularmente con la neuroplasticidad, porque diversos estudios han demostrado que la actividad continua, ejercicio físico, buena alimentación y constante estimulación mental permite que las células cerebrales hagan nuevas conexiones.
su participación en actividades específicas de ocio con los pequeños o la ayuda con los deberes ya se asocia positivamente a un mejor funcionamiento cognitivo, especialmente en relación con la memoria episódica y la fluidez verbal.
Esto me recuerda de un estudio sobre la longevidad en distintas poblaciones a lo largo del mundo (Japón, Italia, California), que hablaba de la importancia de familias multigeneracionales con miembros mayores activos y respetados en la vida cotidiana.
NOTA: Cada respuesta correcta vale un punto.
A los usuarios no autenticados se les solicita autenticarse con GitHub.
Un archivo inexistente en la carpeta /images/ generará un código de respuesta 404.
Las solicitudes HTTP GET de usuarios autenticados con el rol llamado registeredusers se envían a la carpeta API.
Los usuarios autenticados que no pertenecen al rol registeredusers y los usuarios no autenticados reciben un error HTTP 401 al acceder a la carpeta API.
Seleccionar y colocar:
Delegar el acceso a recursos en uno o más de los servicios de almacenamiento.
Delegar el acceso a un recurso en un único servicio de almacenamiento.
Proteger un recurso mediante credenciales de Azure AD.
Seleccionar y colocar:
Generar una clave de intercambio de claves (KEK).
Recuperar la clave pública de la clave de intercambio de claves (KEK).
Generar un archivo blob de transferencia de claves usando la herramienta proporcionada por el proveedor del HSM.
Ejecutar el comando az keyvault key import.
y make the
This brings up my concern for the big data, and it's extensive abundance of it.
État des Lieux du Secteur Périscolaire à Paris : Dysfonctionnements et Dérives
Ce document de synthèse expose les défaillances systémiques au sein des structures périscolaires de la Ville de Paris, telles que révélées par une enquête en immersion.
Le constat met en lumière une gestion de crise permanente caractérisée par un recrutement fondé sur la simple disponibilité plutôt que sur les compétences, une absence de formation réelle et des violations récurrentes des taux d'encadrement légaux.
L'analyse révèle un environnement où la sécurité affective et physique des enfants est compromise par des violences verbales, un désinvestissement de certains agents et une impunité institutionnalisée pour les titulaires problématiques via un système de "chaises musicales".
Le manque de contrôle et d'exigence de la hiérarchie favorise l'émergence de dérives graves, allant de la négligence à des signalements d'attouchements sexuels.
--------------------------------------------------------------------------------
Le recrutement des animateurs vacataires semble dicté par une nécessité de combler les effectifs plutôt que par une évaluation des aptitudes pédagogiques.
• Critères de sélection minimaux : La mairie exige uniquement d'avoir 18 ans, d'être motivé, d'avoir un casier judiciaire vierge (vérification du FIJAIS) et des vaccins à jour.
• Absence d'évaluation des compétences : Les entretiens ne comportent aucune question sur la gestion des enfants ou l'expérience éducative. L'atout majeur retenu est la disponibilité du candidat.
• Le dogme du "bon sens" : À défaut de directives claires, le recrutement repose sur deux notions vagues : la "bienveillance" et le "bon sens", y compris pour prodiguer des soins en l'absence d'infirmière.
• Profils à risque : Le manque d'exigence conduit au recrutement de profils inadaptés.
Un témoignage interne (Karim, responsable éducatif ville) rapporte l'envoi de remplaçants arrivant en état d'ébriété ou issus de parcours de réinsertion sans évaluation préalable suffisante, malgré des avis de recrutement signalant une instabilité.
L'immersion démontre un décalage profond entre les ambitions affichées par la Ville et la réalité du terrain.
• L'inexistence du parcours d'intégration : La formation se résume à un "briefing express" (chronométré à 6 minutes et 42 secondes dans un cas précis) avant une mise en poste immédiate.
• La Charte de l'animateur ignorée : Bien que ce document définisse les missions éducatives et proscrive les comportements ambigus, il n'est souvent ni présenté ni signé par les nouveaux arrivants.
• Improvisation pédagogique : Alors que le temps périscolaire est censé être éducatif, aucune consigne ne soutient les projets pédagogiques.
Les animateurs sont invités à "faire des dessins" ou à improviser des jeux sur leur temps personnel.
La gestion des effectifs se heurte à une pénurie chronique de personnel qualifié, entraînant des entorses régulières à la réglementation.
| Norme Légale (moins de 6 ans) | Réalité constatée sur le terrain | | --- | --- | | 1 animateur pour 14 enfants | Jusqu'à 1 animateur pour 23 enfants | | Surveillance active requise | Sous-effectifs fréquents (ex: 2 animateurs pour 70 enfants) |
• Précarité et rotation : Les postes de vacataires (payés 15 € brut de l'heure) servent à "boucher les trous" sans continuité éducative, les remplaçants changeant de groupe quotidiennement sans présentation préalable.
• Difficulté de recrutement : La mairie peine à trouver des profils compétents en raison des plannings morcelés et des temps partiels, ne parvenant à compléter ses équipes qu'en période de fin d'études universitaires.
Le manque de cadre et de formation génère des comportements abusifs au sein des écoles.
• Violences verbales systématiques : L'usage des cris, des menaces ("vous allez rien manger") et des humiliations est une pratique quotidienne pour obtenir le silence ou le respect des règles à la cantine.
• Négligence et désinvestissement : De nombreux animateurs privilégient l'usage personnel de leur smartphone au détriment de la surveillance active des enfants, en violation directe de la charte professionnelle.
• Absence de limites physiques : L'immersion a révélé des gestes inappropriés, tels que des baisers forcés sur la bouche imposés aux enfants par certains membres du personnel sous couvert d'affection.
Le système de contrôle interne semble incapable de réguler ou d'écarter les profils dangereux.
• Pilotage à distance : La hiérarchie supérieure se rend rarement sur le terrain (environ trois fois par an), adoptant une posture de "no news good news".
• Le système des "chaises musicales" : Pour les agents titulaires (fonctionnaires) faisant l'objet de signalements pour maltraitance (fessées, secousses par les oreilles), la Ville privilégie le déplacement géographique plutôt que la sanction disciplinaire ou l'exclusion.
Cela permet à des individus problématiques de poursuivre leur carrière en changeant simplement d'établissement.
• Gravité des faits signalés : L'enquête mentionne une plainte pour attouchements sexuels sur une enfant pendant la sieste, ayant entraîné la suspension d'un agent au nom du principe de précaution.
« Si un enfant se blesse, elle fait comment ? [...] Voilà, c'est votre bon sens. » — Recruteuse de la Ville de Paris.
« On forme sur le tas. [...] Allez, bienvenue à bord du briefing express. » — Responsable Éducatif Ville (REV).
« Si ça te fait de la peine [que les enfants pleurent], c'est pas fait pour toi ce travail. Parce que sinon tu vas te faire bouffer. » — Animatrice à une nouvelle recrue.
« On peut faire une carrière entière en fait en étant déplacé tout le temps, ça il n'y a aucun problème. » — Karim, responsable périscolaire anonyme.
Note: This response was posted by the corresponding author to Review Commons. The content has not been altered except for formatting.
Learn more at Review Commons
Reviewer #1 Reviewer 1 Point 1- The authors describe cortical neuronal counts across several mammalian species, which is quite impressive, but the information on the methods of counting is lacking: how representative are the data used / shown; how many individuals / brains / sections were used for each species considered? Much more detailed description of the quantifications should be provided to judge the validity of this first conclusion.
Response: We sincerely thank the reviewer for this insightful and constructive suggestion. We agree that the methodological description of our comparative histological analysis, which is the fundamental basis of this study, was insufficient in the original manuscript. Following the reviewer’s advice, we have extensively revised the Materials and Methods section entitled “Nissl staining and neuronal cell number count” (Page 32, Line 15).
Reviewer 1 Point 2- The authors use several markers of cortical neuron identity to confirm their neuron number measurements, but from the data shown in Figure 1D,E it seems that only some markers (Satb2) show species-differences while others do not (CTIP2 / Tbr1). How do the authors explain this discrepancy - does this mean that it is mainly Satb2 neurons that are increased in number? But if so how to explain the relative increase in subcortical projections shown in Figure S7?
Response: We appreciate the reviewer’s insightful comments regarding the marker expression patterns. Upon re-evaluating our data in light of your feedback, we agree that the species differences in deep-layer (DL) markers such as Ctip2 and Tbr1 in the adult stage appear relatively modest compared to the robust differences observed in Satb2 and the projection data shown in Figure S8.
To address this point, we have incorporated a comparison between the adult data (Figure 1) and our findings from P7 (Figure S2). As shown in the revised manuscript, the species differences for all markers are significantly more pronounced at P7 than in the adult. Notably, in the lower layers, rats exhibit a significantly higher number of marker-positive cells across all markers, including those newly added in this revision, compared to mice.
We offer the following interpretation regarding these temporal differences:
While we have kept the discussion in the main text concise to maintain focus for the general reader, we have provided comprehensive data in Figure 1 and Figure S2. This ensures that the necessary evidence is readily available for specialists interested in these developmental dynamics.
Reviewer 1 Point 3- The authors focus their study almost exclusively on somatosensory cortex, but can they comment on other areas (motor, visual for instance)? It would be nice to provide additional comparative data on other areas, at least for some of the parameters examined across mouse and rat. Alternatively the authors should be more explicit in the abstract and description of the study that it is limited to a single area.
Response: We sincerely appreciate the reviewer’s insightful comment. As suggested, we have revised the Abstract to explicitly state that our current analysis is focused on the somatosensory cortex. Furthermore, as demonstrated in Figure 1B, we have added a discussion regarding the possibility that the species differences observed in the primary somatosensory cortex may be a general feature shared across the entire cerebral cortex, as follows: “This DL-biased thickening in rats was evident in the primary somatosensory area, but is consistently observed throughout the rostral-caudal cortical regions. (Page 19, Lines 29-31)“
Reviewer 1 Point 4- The authors provide convincing evidence of increased Wnt signaling pathway in the rat. They should show more explicitly how other classical pathways of neurogenic balance / temporal patterning are expressed in their mouse and rat transcriptome data sets. These would include Notch, FGF, BMP, for which all the data should be available to provide meaningful species comparison.
Response: We sincerely thank the reviewer for this insightful suggestion. Following your advice, we have newly included comparative data on key signaling pathways essential for cortical development—namely Wnt, FGF, NOTCH, mTOR, SHH, and BMP—across different species. These results are now presented in Figure S17. Rat progenitors show comparable patterns to other species for FGF, mTOR, and Notch signaling, but elevated Wnt and BMP expression, especially at early stages. A detailed heatmap of raw Wnt pathway gene expression across species is also included in the same supplementary figure. We believe these additions provide a more comprehensive evolutionary perspective and significantly strengthen our findings.
Reviewer 1 Point 5- The alignment of mouse and rat trajectories is very nicely showing a delay at early-mid-corticogenesis. But there is also heterochronic transcriptome at latest stages (end of 5). How can this be interpreted? Does this mean potentially prolonged astrogliogenesis in the rat cortex?
Response: We sincerely appreciate the reviewer’s insightful comment and the meticulous attention given to our data. Regarding the heterochronic shift observed at Day 5, we agree that this point was not sufficiently addressed in the original manuscript.
We would like to clarify the two primary reasons for this omission, which are inherent to the current study’s design:
We believe these changes more faithfully represent the biological scope of our data while maintaining the scientific integrity of our primary conclusions.
Reviewer 1 Point 6- Figure 7: description implies that module 3 is a subset of module 4, but this is not obvious at all from the panels shown. Please clarify.
Response: We sincerely appreciate the reviewer’s careful reading of our manuscript. As suggested, we have revised Figure 7 to clarify the hierarchical relationship between Module 3 and Module 4, ensuring that their inclusion is now explicitly presented.
Reviewer #2 Reviewer 2 Point 1. The introduction lacks sufficient background and fails to convey the significance of the study. Specifically, why the research was undertaken, what knowledge gap it addresses, and how the findings could be applied. Addressing these questions already in the introduction would enhance the impact of the work and broaden its readership.
Response: We sincerely appreciate the reviewer’s insightful comment on this point. Our study reports evolutionary insights gained through an unconventional approach: a single-cell level comparison between mice and rats. We agree that clarifying the necessity of this specific approach is crucial for the manuscript. Accordingly, we have added the following two points to the Introduction:
Reviewer 2 Point 2. In figure 5 the authors conclude that "differences in cell cycle kinetics and indirect neurogenesis are unlikely to be the primary factors driving the species-specific variation in DL neuron production. Instead, the temporal regulation of progenitor neurogenic competence, which determines the duration of the DL production phase, provides a more plausible explanation for the greater number of DL subtypes observed in rats". It is not clear to this reviewer how the authors come to this conclusion. Authors observe a significant proportion of mitotic cells in rat VZ from day 1, and a higher constant proportion of mitotic progenitors in SVZ rats compared to mouse (Figure 5C). This points to an early difference in mitotic progenitors that may also lead to increased IP numbers, and potentially an increased number in DL cells, even before day 1. In addition, the higher abundance of IPs in the G2/S phase (statistically significant in 4 of the 7 time points) (Figure 5F), would suggest that this difference might play a role in the species-specific variation of DL neuron production. The authors should estimate cell cycle length instead of just measuring proportions to conclude something about cell cycle kinetics. They can then model growth curves to predict the effect caused if there were differences in cell cycle length between equivalent cell types across species.
Response: We sincerely thank the reviewer for their careful reading of our manuscript and for pointing out the overstatements in our original descriptions. We agree that a more nuanced interpretation of the data was necessary. In response to these constructive suggestions, we have made the following revisions:
Reviewer 2 Point 3. In Figure 6 the authors focus only on the mouse and rat datasets. Given the availability of datasets from primates that the author used already for Figure 7, it would give the reader a broader prospective if also these datasets would be integrated in the analysis done for Figure 6, particularly it would be interesting to integrate them in the pseudotime alignment of cortical progenitor. How do human and/or macaque early and late neurogenic phase would compare to mouse and rat in this model?
Response: We sincerely appreciate the reviewer’s insightful suggestion. In accordance with this comment, we have now incorporated pseudotime alignments of cortical progenitors between primates (human, macaque) and rodents (mouse, rat), presented as pairwise gene expression distance matrices with dynamic time warping in Figure S13. These heatmaps illustrate temporal compression or stretching in progenitor gene expression progression across species. Notably, macaque progenitors show no definitive deviations from rodents, whereas human progenitors exhibit distinct protraction relative to rats and even more so to mice. These additions provide a more comprehensive cross-species perspective without altering the study's core conclusions.
Reviewer 2 Point 4. In Figures 6C and 6D, the authors distinguish between cycling and non-cycling NECs and RGCs. Could the authors clarify the rationale behind making this distinction? Could the authors comment on how they interpret the impact of cycling versus non-cycling states on species-specific non-uniform scaling? Do they consider the observed non-linear correspondences to be driven by differences in cell cycle activity?
Response: We are grateful to the reviewer for their insightful observation. We agree that our initial classification of neural progenitor cell (NPC) populations based on proliferation marker expression levels followed a convention used in other studies but was, in the context of this work, unnecessary and potentially misleading. To avoid further confusion and focus on the core biological question, we have re-organized the data by pooling these populations into a single group. Regarding the concern about species differences in cell cycle kinetics, we believe there is no significant divergence between mice and rats that could explain the observed developmental patterns in temporal progression of neurogenesis. This is supported by two lines of evidence:
Reviewer 2 Point 5. For the non-uniform scaling in Figure 6F, the authors identify critical inflection points and mention that "the largest delay in rat progenitors occurring where Day 1 and Day 3 progenitors overlapped". It would be good if the authors could discuss what they think all the inflection points represents. How much can it be explained by the heterogeneity within progenitors per time point? There is a clear higher spread of histograms at days 3 and 5, and the histogram at day 5 almost overlaps with day 1. I wonder if the same conclusion about non-uniform scaling would be detected if the distance matrix was built separately for specific cell types, for example only looking at NECs or RGCs.
Response: We sincerely appreciate the reviewer’s insightful perspective on this point. In alignment with the suggestions from both this reviewer and Reviewer 1 (Point 5), we have updated the manuscript to discuss all identified inflection points. Specifically, we have clarified why our discussion focuses on the correspondence between Mouse D1 and Rat Day 3.
A recognized limitation of our current analytical approach is that it identifies the closest matching expression profiles within the specific timeframes sampled for each species. For stages at the beginning or end of our sampling window, the "true" corresponding stage in the other species may lie outside our sampled range, which naturally limits the strength of any conclusions regarding those boundary points. Consequently, while we can confidently confirm the correspondence between Mouse Day 1 and Rat Day 3—both of which sit centrally within our sampled window—we have intentionally avoided over-interpreting data near the temporal boundaries.
Regarding the cell types analyzed, this specific analysis was conducted exclusively on NECs and RGs (now shown in Figure 6F). Extensive prior research (Susan McConnell lab, Sally Temple lab, Fumio Matsuzaki lab, Dennis Jabaudon lab, and more) has established that the time-dependent mechanisms governing the fate determination of cortical excitatory neuron subtypes are encoded within RGs. Therefore, we focused our investigation on these lineages and did not include other cell types in this study. We believe this focused approach maintains the highest degree of biological relevance for our conclusions.
Reviewer 2 Point 6. The authors conclude that the elevated and prolonged expression of Wnt-ligand genes in rat RGs extend the DL neurogenic window and contribute to rat-specific expansion of deep cortical layer. In order to validate this finding it would be good for the authors to perform a perturbation experiment and reduce Wnt signalling/ Axin 2 levels in rats or depleted the Lmx1a and Lhx2 double-positive population. Response: __We thank the reviewer for this insightful suggestion. We agree that providing direct experimental evidence is crucial to demonstrating that elevated Wnt signaling in RG progenitors drives the production of DL subtype neurons in rats. To address this, we performed a functional intervention on Day 3, a stage when Wnt signaling (indicated by Axin2 expression) is significantly higher in rats than in mice (__Figure 7C, D). By introducing a dominant-negative form of TCF7L2 (dnTCF7L2) to inhibit Wnt signaling specifically in RG progenitors, we tracked the fate of the resulting neurons (Figure 7I, J). Our results showed a clear reduction in the proportion of DL neurons, accompanied by a reciprocal increase in upper-layer (UL) neurons. These findings demonstrate that maintained high levels of Wnt signaling are essential for the prolonged neurogenic capacity for DL neurons in rats. This new data has been incorporated into Figure 7.
Reviewer 2 Point 7. The authors conclude that Wnt signaling is a rat specific effect since they did not observe any clear temporal change in wnt receptors in gyrencephalic species, and only a subset of RG in rats co-express Lmx1a and Lhx2. However, specific Wntligands and receptors (Wnt5a, Fzd and Lrp6) seem to be upregulated in human as well (Fig 7G), non RG cells could act as wnt ligand inducers in other species, and it has not been demonstrated that Lmx1a and Lhx2 are the source for Wntligand production. I wonder if the authors can completely rule out a role for Wnt in the protracted neurogenesis of other species.
Response: We sincerely appreciate the reviewer’s insightful and broad perspective regarding Wnt signaling dynamics across diverse species. In this study, our primary focus was to elucidate the specific mechanisms underlying the differences between mice and rats. Consequently, we did not initially explore Wnt dynamics in other species or their roles in developmental timing in great depth in the original manuscript. We fully acknowledge that lineage-specific adaptations occur at the individual gene level; for instance, Silver and colleagues have reported that human-specific upregulation of Wnt receptor gene FZD8 modulates neural progenitor behavior (Boyd et al., Current Biology 2008, Liu et al., Nature 2025). However, our comparative analysis of five mammalian species—carefully aligned by developmental stage—reveals a distinct global trend. While individual gene variations exist like human FZD8, the expression levels of multiple Wnt-related genes, particularly ligands, are markedly higher in rats than in the other four species.
Following the reviewer’s insightful suggestion, we examined the potential role of Lmx1a in activating Wnt ligand transcription in rat cortical progenitors by analyzing their expression correlation at the single-cell level. Our analysis revealed that several Wnt ligand genes are co-expressed with Lmx1a with a remarkably strong positive correlation. While we have not yet experimentally demonstrated the direct transcriptional activation of Wnt ligands by Lmx1a in these cells, this robust correlation at single-cell resolution strongly suggests that Lmx1a regulates Wnt ligand expression. These new findings are now included in Figure 7 and Figure S16, and the corresponding results section (Page 15, Lines 42-44) has been revised accordingly.
__Reviewer 2 Point 8 __Minor comments: The RNAscope experiment is currently qualitative. Is it the mRNA copy number per cell equal in both species but more cells are positive in rat, or are there differences in number of mRNA molecules as well? It is not indicated if the RNAscopeprobes are the same for mouse and rat.
Response: We sincerely thank the reviewer for this insightful suggestion. Following the comment, we performed RNAscope analysis for Axin2 in both mice and rats and quantified the results (now included in Figure 7D). The new data successfully validate the species differences initially observed in our scRNAseq analysis: specifically, the period of high-level Axin2 expression is significantly extended in rats compared to mice. These findings provide histological evidence that reinforces our conclusions regarding the distinct temporal dynamics between the two species.
Regarding probe design, the Axin2 RNAscope probes target conserved and corresponding sequences between mouse and rat, with species-specific probes optimized for each organism to ensure maximal specificity and sensitivity. We have updated the Methods section ("Fluorescent in situ hybridization with RNAscope") to include these details.
Reviewer #3
Reviewer 3 Point 1. Satb2 is also widely recognized as a deep layer marker. The authors need to perform analysis and quantification in Figs 1 and 4 with other II/III and IV markers such as Cux1 and Rorb.
Response: We thank the reviewer for their insightful comments regarding the marker specificity. We fully agree that while Satb2 is a robust marker for callosal projection identity, its broad distribution across both deep and upper layers limits its utility as a layer-specific marker. As the reviewer suggested, Cux1 (Layers 2/3) and Rorb (Layer 4) are indeed superior markers for defining laminar identity.
To address this, we have incorporated new immunohistochemical data for these markers in both the quantification of somatosensory cortical neurons (Figure S2) and the birth-dating analysis (Figure 4).
Our new findings are as follows:
Reviewer 3 Point 2. Rats have larger cortices. Therefore, quantification of neurons should also be normalized to cortical thickness in Fig 1E and also represented with individual data points.
Response: We sincerely appreciate the reviewer’s constructive suggestion. We agree that normalizing the number of cortical neurons by thickness provides a more rigorous comparison. Accordingly, we have calculated the neuronal density (cell count per unit thickness) for Tbr1- and Ctip2-positive cells and included these data in Figure S2C. Our analysis confirms that these populations are distributed at a significantly higher density in mice compared to rats.
Furthermore, we have updated the visualization in Figure 1E to display individual data points, ensuring full transparency of the underlying distribution. We believe these revisions, prompted by the reviewer’s insight, have substantially strengthened the clarity and persuasiveness of our manuscript.
Reviewer 3 Point 3. The clonal analysis in Figs 2 and 3 quantifies GFP and RFP and reports these as neurons. However, without using cell-specific markers, it seems the authors cannot exclude that some progeny are also glia derived from a radial glial progeny. I don't expect all experiments to have this but they must have some measures of both populations to address this possibility. This needs to be addressed to build confidence in the conclusion that there is clonal production of neurons.
Related to this, the relationship between position and fate is not always 1 to 1. The data summarized in Fig 2G are based on position and not using subtype markers. They should include assessment of markers as they do in Fig 4.
Response: We sincerely thank the reviewer for this insightful comment. We agree that a clear definition of cell types is essential for the accuracy of clonal analysis.
In this study, we primarily identified neurons based on their distinct morphological characteristics and performed measurements specifically on these cells. To validate this approach, we confirmed that the vast majority of cells identified as neurons were positive for NeuN and cortical excitatory neuron markers, while remaining negative for glial markers such as Olig2 and SOX9. (Notably, at postnatal day 7, most cells in the glial lineage exist as undifferentiated Olig2-positive progenitors). These observations support our conclusion that the cells analyzed based on morphology are indeed cortical excitatory neurons.
As the reviewer rightly pointed out, evaluating cell composition using fate-specific marker expression is the ideal approach. However, our current experimental setup required multiple fluorescence channels for DAPI staining (to assess tissue architecture) and immunostaining for GFP and RFP (to identify labeled clones). Due to these technical constraints regarding available detection channels and host species compatibility, we relied on morphological criteria for the primary analysis.
To address this concern and ensure the reliability of our findings, we performed additional analyses using a subset of samples. By co-staining retrovirally labeled neurons with cell-fate markers, we obtained results consistent with our other data (Figures 1 and 4) regarding laminar position and marker expression. Based on this consistency, we are confident that our classification based on morphology and laminar position does not alter the fundamental conclusions of this study.
Reviewer 3 Point 4. In Fig 5, the authors use PH3 as well as EdU to measure differences in indirect neurogenesis. Using EdU and Tbr2 they report more dividing IPs. However they need to measure this over the total number of Tbr2 cells as it is not normalized to differences in Tbr2 cells between species. Are there total differences in Tbr2+ cells when normalized to DAPI as well? Moreover, little analyses is performed to measure any impact on radial glia. As no striking differences were observed in IPs this leaves the cellular mechanism a bit unclear and begs the impact on radial glia. Measuring PH3+ cells in VZ and SVZ is not cell specific nor does it yield information to support the prolonged neurogenesis.
Response: We sincerely thank the reviewer for this insightful suggestion. We agree that quantifying Tbr2+/EdU+ double-positive cells alone was insufficient to fully capture the IP dynamics. Following the reviewer’s advice, we have now quantified the total population of Tbr2+ cells, normalized to the number of DAPI-stained nuclei. This new analysis reveals that mice and rats exhibit nearly indistinguishable temporal dynamics (Figure S10). When integrated with the original Tbr2+/EdU+ data in Figure 5, these findings suggest that rats maintain a slightly higher IP pool throughout the neurogenic period. This implies that the increased neuronal production in rats is not restricted to a specific phase, but rather occurs consistently across all developmental stages. We believe these additional data significantly strengthen our conclusions.
Reviewer 3 Point 5. The sc-seq is done in rat and compared to published mouse data from corresponding stages. They conclude species specific differences in progenitor gene expression. I am unsure how appropriate this is. Are similar sequencing platforms used? Can they find similar results if using multiple dataset? There are other datasets that may be used to validate these findings beyond DiBella et al.
Response: We sincerely thank the reviewer for this insightful comment. We agree that establishing the validity of our analytical approach is crucial for the reader’s confidence in our findings. To address this, we have explicitly stated in the revised manuscript that both our rat scRNAseq data and the publicly available datasets were generated using consistent experimental platforms. This ensures that the integration process is technically sound.
Revised text (Page 13, Lines 16-18): “After quality control, we integrated these profiles with previously published mouse cortical cell data from corresponding neurogenic stages, which is prepared using the consistent platform with ours (35) (Figure S11).”
Furthermore, to ensure the robustness of our comparative analysis, we have incorporated an additional independent dataset (Ruan et al., PNAS 2021) in addition to the Di Bella et al. Nature 2021 data used in the original manuscript. We confirmed that the results obtained using this second dataset are highly consistent with our initial findings, further validating our conclusions across different studies (Figure S13A).
Reviewer 3 Point 6. Wnt ligand analysis requires validation in situ across developmental stages, to support their conclusions. Ideally they might consider doing some manipulations to provide context to this observation.
Response: We sincerely thank the reviewer for these insightful suggestions. We agree that validating the spatial expression patterns of Wnt ligands and confirming their expression in rat-specific RG, as suggested by our scRNAseq data, is crucial for strengthening our conclusions.
Regarding the expression of Wnt3a, a key ligand in cortical development: although immunohistochemical analysis clearly identified Wnt3a expression in the cortical hem, the expression levels in RG within the cortical area were substantially lower than those in the hem, making definitive visualization challenging. To complement these findings and provide more robust evidence, we performed the following additional experiments:
__Reviewer 3 Point 7 __Minor concerns-1
Please separate images in Fig 1D it is very strange to have them all on top of each other.
Response: We sincerely thank the reviewer for this suggestion. As requested, we have provided individual channel images alongside the merged multicolor panels. We agree that this modification significantly enhances the clarity of our data and makes the results much easier to interpret.
__Reviewer 3 Point 8 __Minor concerns-2
Are data in Fig 4E Edu+Tbr1+EdU+? This should be clarified and would be most accurate.
Response: We appreciate the reviewer’s suggestion. We added the label of Y axes of the plots in Figure 4E-K. The procedure of cell count in these analyses are documented in the caption of Figure 4E-K, “Normalized counts of neurons colabeled for EdU and projection-specific markers, relative to the peak of EdU+ and marker+ cells.”.
__Reviewer 3 Point 9 __Minor concerns-3
Fig 4 graphs only have titles without Y axis. Please adjust location of title or repeat for clarity.
Response: We thank the reviewer for this helpful suggestion. To clarify the definition of the Y-axis, we have now added a descriptive label to the axis in the revised figure.
__Reviewer 3 Point 10 __Minor concerns-4
Fig 4A implies cumulative incorporation which I don't think is being performed here. They should clarify this in the figure.
Response: We appreciate the reviewer’s insightful comment. To avoid any potential misunderstanding regarding the additivity of the effect, we have revised the illustration in Figure 4A for greater clarity.
__Reviewer 3 Point 11 __Minor concerns-5
Fig 5 needs labels for the actual stages assayed, as illustrated in Fig 4A.
Response: We thank the reviewer for this helpful suggestion. Following your comment, we have added the developmental stage information (expressed as embryonic days) for both mice and rats in the revised manuscript.
Note: This preprint has been reviewed by subject experts for Review Commons. Content has not been altered except for formatting.
Learn more at Review Commons
In this study the authors investigate differences between two closely related species, rats and mice, in terms of cortical development and neuronal composition. They first perform comparative analysis of cortical layers which revealed the density and markers of deep layer neurons of rats is disproportionately larger compared to adult mice. They then use retroviruses for lineage analysis from embryonic stages to P7. They find in general that there are temporal differences in when mice and rats produce upper versus deep layer neurons, with the process being protracted in rats. EdU injections were used to report differences in the timing of cortical neuron generation between species and they note no striking differences in IPs. Sc-sequencing of rat cortices at different stages was then used to measure temporal changes in gene expression and compared to published mouse data. They note that rats have sustained Wnt ligand expression in radial glia highlighting that as a potential mechanism of action.
Major concerns 1. Satb2 is also widely recognized as a deep layer marker. The authors need to perform analysis and quantification in Figs 1 and 4 with other II/III and IV markers such as Cux1 and Rorb. 2. Rats have larger cortices. Therefore, quantification of neurons should also be normalized to cortical thickness in Fig 1E and also represented with individual data points. 3. The clonal analysis in Figs 2 and 3 quantifies GFP and RFP and reports these as neurons. However, without using cell-specific markers, it seems the authors cannot exclude that some progeny are also glia derived from a radial glial progney. I don't expect all experiments to have this but they must have some measures of both populations to address this possibility. This needs to be addressed to build confidence in the conclusion that there is clonal production of neurons. Related to this, the relationship between position and fate is not always 1 to 1. The data summarized in Fig 2G are based on position and not using subtype markers. They should include assessment of markers as they do in Fig 4. 4. In Fig 5, the authors use PH3 as well as EdU to measure differences in indirect neurogenesis. Using EdU and Tbr2 they report more dividing IPs. However they need to measure this over the total number of Tbr2 cells as it is not normalized to differences in Tbr2 cells between species. Are there total differences in Tbr2+ cells when normalized to DAPI as well? Moreover, little analyses is performed to measure any impact on radial glia. As no striking differences were observed in IPs this leaves the cellular mechanism a bit unclear and begs the impact on radial glia. Measuring PH3+ cells in VZ and SVZ is not cell specific nor does it yield information to support the prolonged neurogenesis. 5. The sc-seq is done in rat and compared to published mouse data from corresponding stages. They conclude species specific differences in progenitor gene expression. I am unsure how appropriate this is. Are similar sequencing platforms used? Can they find similar results if using multiple dataset? There are other datasets that may be used to validate these findings beyond DiBella et al. 6. Wnt ligand analysis requires validation in situ across developmental stages, to support their conclusions. Ideally they might consider doing some manipulations to provide context to this observation.
Minor concerns 1. Please separate images in Fig 1D it is very strange to have them all on top of each other. 2. Are data in Fig 4E Edu+Tbr1+EdU+? This should be clarified and would be most accurate. 3. Fig 4 graphs only have titles without Y axis. Please adjust location of title or repeat for clarity. 4. Fig 4A implies cumulative incorporation which I don't think is being performed here. They should clarify this in the figure. 5. Fig 5 needs labels for the actual stages assayed, as illustrated in Fig 4A.
Strengths:
The finding that there are differences in cortical composition between rats and mice and that this is linked to prolonged neurogenesis in rats Use of careful and detailed lineage analysis to define differences in temporal production of neurons Inclusion of single cell sequencing
Limitations:
Largely descriptive Requires additional investigation to support some conclusions about neurons Concerns about inferring too much from single cell sequencing done by the authors but compared to publication
Advance: Finding that there are differences in neurogenesis between closely related species is interesting and provides insight into mechanisms of cortical evolution.
Audience: Evolution, cortical development
Expertise: Cortical development, evolution
NOTA: Cada respuesta correcta vale un punto.
Buscar y filtrar por identificador de cliente.
Buscar información dentro de los documentos.
NOTA: Cada respuesta correcta vale un punto.
Los blobs de tipo block con el prefijo transactions moverán automáticamente a almacenamiento cool aquellos blobs que no hayan sido modificados en más de 60 días, y eliminarán los blobs que no hayan sido modificados en 365 días.
Los blobs se moverán al nivel de almacenamiento cool si no han sido accedidos durante 60 días.
La regla de la política moverá a la capa cool las versiones anteriores dentro de un contenedor llamado transactions que tengan 60 días o más, y eliminará las versiones anteriores que tengan 365 días o más.
Los blobs se volverán a mover automáticamente de cool a hot si se acceden nuevamente después de haber sido movidos a cool.
NOTA: Cada respuesta correcta vale un punto.
SaveScore funcionará con Cosmos DB.
SaveScore actualizará y reemplazará un registro si ya existe uno con el mismo playerId y gameId.
Los datos del leaderboard del juego se particionarán automáticamente usando gameId.
SaveScore almacenará en la base de datos los valores de los parámetros gameId y playerId.
Seleccionar y colocar:
Si ningún servidor edge en el POP tiene la imagen en caché, el POP solicita el archivo al servidor de origen.
Un usuario solicita la imagen desde la URL del CDN. El DNS dirige la solicitud al POP con mejor rendimiento.
Las solicitudes posteriores del archivo pueden dirigirse al mismo POP usando la URL de la imagen del logo del CDN. El servidor edge del POP devuelve el archivo desde la caché si el TTL no ha expirado.
El servidor de origen devuelve la imagen del logo a un servidor edge en el POP. Un servidor edge en el POP almacena la imagen del logo en caché y devuelve la imagen al cliente.
Interaction Agent
solo falta confirmacion de amit, y lo muevo
Consulta: ante request, resolver SIM y retornar provider_id / integration_id vigentes. Actualización: si llega un cambio válido de binding (típicamente desde CAP-01), persistir el nuevo provider_id / integration_id. Si el binding cambió, emitir evento SimBindingInvalidated para que provider-service invalide caché. No ejecutar acciones técnicas.
esto esta mal, sim tiene provider_id / integracion_id? me parece que no
lver SIM administrativa por iccid/sim_id y validar ownership.
no va esto
estado, customer, alias
ver que filtros, recoerdmos que cliente y alias no tenemos
Validar permisos y scope de visibilidad (Vendor vs Cliente).
no va porque no entra vendor ni cliente
compuesta con datos técnicos observados y metadata externa solo para visualización.
esto no va en sim
ncola y ejecuta la operación técnica (interno)
cuando lo decimos los cambios en service_profile? sim_profile_change
Provider Integration Registry (read-only): consulta a provider-service el registro de integraciones habilitadas y capacidades soportadas, para ejecutar la importación.
me parece que esto salio
Synthèse du Documentaire : « Didier, moi et les autres... les enfants du silence »
Ce document synthétise les témoignages et les analyses issus du documentaire de LCP consacré aux victimes masculines de violences sexuelles durant l'enfance.
Le récit s'articule autour de quatre hommes — Nicolas, Didier, Arnaud et Adrien — qui, après des décennies de silence, tentent de reconstruire leur identité fracturée.
Les thèmes centraux incluent le mécanisme de l'amnésie traumatique, l'impact dévastateur du déni familial, et l'utilisation de l'image ou du militantisme comme outils de résilience.
Le document souligne une réalité systémique : 160 000 enfants sont victimes de violences sexuelles chaque année en France, soit un enfant toutes les trois minutes, souvent dans une indifférence ou une impuissance collective.
--------------------------------------------------------------------------------
Le documentaire explore comment le silence devient une stratégie de survie pour l'enfant victime, se transformant en une « expertise » qui dure parfois des décennies.
L'amnésie traumatique est présentée non comme un oubli volontaire, mais comme une réponse biologique à une horreur indicible.
• Processus biologique : Face à une charge insupportable d'adrénaline et de cortisol sécrétée par l'amygdale, le cerveau « disjoncte » pour protéger l'individu d'une mort potentielle par peur.
• Conséquences : Cette déconnexion empêche la mémoire d'encoder l'événement.
La victime est alors incapable de faire le récit de l'agression, ce qui peut être interprété à tort par l'entourage comme du mensonge ou de l'indifférence.
• La Réviviscence : Le retour des souvenirs est décrit comme un séisme.
Pour Adrien, cela s'est manifesté par des douleurs somatiques (« des fourmis sous la peau ») avant que les images ne se recomposent comme une mosaïque 19 ans plus tard.
La question du plaisir physiologique durant l'agression est abordée comme un « tabou dans le tabou ».
• Réaction somatique vs Consentement : Les victimes clarifient qu'une réaction physique à une stimulation n'est pas du désir.
• Outil de destruction : Cette confusion est souvent utilisée par l'agresseur pour silencer la victime ou par la victime elle-même pour s'auto-accuser, renforçant la conviction d'avoir été « consentant ».
--------------------------------------------------------------------------------
La réaction des parents et de la famille constitue souvent une « double peine » pour la victime.
| Type de Réaction | Description et Citations Clés | | --- | --- | | Le Déni Total | La mère de Nicolas refuse de croire les faits : « Si ce que tu as vécu est vrai, tu me l'aurais dit quand tu avais neuf ans. Donc c'est pas vrai. » | | La Minimisation | La mère de Didier, bien que croyante, incite à l'oubli : « Didier, allez, c'est bon... il faut oublier. » | | L'Incapacité d'Agir | Les parents de Nicolas expliquent leur silence par la prescription légale : « On ne pouvait plus rien faire parce qu'il y a péremption. » | | L'Exclusion | Arnaud relate avoir été exclu des réunions familiales au profit de ses agresseurs (ses cousins) : « Ils préféraient avoir mes cousins agresseurs à la table, plutôt que moi. » |
--------------------------------------------------------------------------------
Chaque victime développe sa propre méthode pour « recoller les morceaux » de son identité lézardée.
Pour Didier et Nicolas, devenir caméraman ou photographe n'est pas un hasard.
C'est une manière de « cadrer le monde » pour y mettre de l'ordre face au chaos intérieur.
• Le Cadre : « Un truc qui borne, qui contient, qui arrête un peu le bordel. »
• Le Négatif et la Lumière : Didier utilise la métaphore photographique : faire émerger la lumière à partir du noir pour « recoller le trou noir » de sa vie.
Arnaud a transformé sa souffrance en un combat public et tranchant.
• La Voix des Victimes : Il dénonce les institutions (notamment l'Église et l'enseignement catholique) et réclame « Vérité, Justice, Réparation, Prévention ».
• La Grenade Dégoupillée : Nicolas décrit les victimes qui parlent comme des « grenades dégoupillées » que la société préfère éviter car elles sont « radioactives ».
--------------------------------------------------------------------------------
Le documentaire souligne le besoin de reconnaissance, même lorsque l'action judiciaire est entravée par la prescription.
• La Traque de l'Agresseur : Didier a passé des années à traquer son agresseur, le filmant à son insu comme un « exutoire ».
Son but ultime était qu'il sache qu'une plainte existait, même pour des faits prescrits depuis 50 ans.
• L'Échec de la Confrontation Physique : Une tentative de Didier pour confronter son agresseur se solde par une méprise sur l'identité de l'homme, illustrant l'obsession de « faire cesser le cirque » et le besoin désespéré de conclusion.
• L'Évolution Judiciaire : Le Garde des Sceaux a sollicité les procureurs pour enquêter sur des faits prescrits afin de permettre une forme de reconnaissance officielle, bien que l'accès à ces enquêtes reste difficile pour les victimes.
--------------------------------------------------------------------------------
Le traumatisme des violences sexuelles est décrit comme une « effraction à vie ». La guérison ne signifie pas l'effacement du souvenir, mais l'apprentissage d'une vie avec la cicatrice.
• L'Importance de la Parole : Témoigner permet de briser le cycle de l'abandon et d'aider d'autres hommes à sortir du silence.
• Un Enjeu Collectif : Le documentaire conclut que la protection des enfants n'est pas seulement une affaire privée mais un devoir sociétal. Comme le souligne Adrien, il s'agit de sortir du « cadre limitant » du passé pour retrouver une place saine dans la société.
« On ne tourne jamais la page. Je pense qu'on vit avec. » — Didier
Masculinité en crise : la fin d’Homo Virilus ?
Ce document de synthèse analyse les fondements, l'évolution historique et la remise en question contemporaine de l'archétype de la virilité, désigné sous le terme d'« Homo Virilus ».
À travers un prisme historique, sociologique et personnel, il explore comment ce modèle de domination, longtemps hégémonique, fait face à une crise profonde et à une nécessité de redéfinition.
--------------------------------------------------------------------------------
L’idéal de l'« Homo Virilus » repose sur un triptyque de puissance, de courage et de domination.
Historiquement ancré dans l'héroïsme guerrier, ce modèle a subi des chocs successifs : la déshumanisation par la guerre industrielle en 1914, l'autonomisation des femmes lors des conflits mondiaux, et les révolutions féministes des années 1970.
Aujourd'hui, la masculinité est à la croisée des chemins. D'un côté, une réaction masculiniste et « viriliste » s'intensifie, portée par la manosphère et des discours réactionnaires.
De l'autre, des mouvements de déconstruction émergent, portés par de nouvelles formes de paternité et une distinction claire entre masculinité et domination.
Le coût social de la virilité obligatoire est désormais quantifié (environ 100 milliards d'euros par an en France), soulignant l'urgence d'une transition vers des modèles plus équitables.
--------------------------------------------------------------------------------
Le concept d'Homo Virilus n'est pas une donnée biologique, mais une construction culturelle héritée de l'Antiquité gréco-romaine.
• Les piliers de la virilité : Ce modèle exige puissance, courage et domination. Il impose une maîtrise de soi constante, tout en justifiant une violence explosive si nécessaire.
• Une hiérarchie sociale : La vertu virile justifie la domination des femmes et des enfants, mais aussi celle des hommes jugés « non virils ».
• Une fragilité intrinsèque : Contrairement à l'apparence de force, la virilité est décrite comme une « insoutenable fragilité » car elle doit être prouvée et maintenue en permanence. On ne naît pas Homo Virilus, on le devient par des rites de passage, souvent liés au combat.
--------------------------------------------------------------------------------
Le XXe siècle a marqué le début du déclin de l'héroïsme viril traditionnel.
L'épreuve de la Grande Guerre (1914-1918)
• La fin du romantisme militaire : La guerre industrielle, avec son « orage d'acier », a rendu le courage individuel obsolète face aux obus.
• Le traumatisme et la « dévirilisation » : Les survivants sont revenus démembrés ou atteints de blessures invisibles (« l'obusite » ou syndrome post-traumatique). À l'époque, la psychiatrie associait ces troubles nerveux à une forme de féminisation ou de lâcheté.
• Inversion des rôles : Pendant que les hommes étaient au front, les femmes (« munitionnettes », conductrices, postières) ont prouvé leur capacité à faire fonctionner la société, brisant le mythe de leur infériorité physique et morale.
• Le fascisme comme rempart : Face à la fluidité de la République de Weimar, les régimes totalitaires (Hitler, Mussolini) ont prôné un retour à une virilité antique et implacable.
• Idéologie et exclusion : La virilité nazie était indissociable de l'antisémitisme et de l'homophobie. Les homosexuels, perçus comme des « hommes-femmes » incapables de combattre, ont été persécutés et envoyés en camps (marqués du triangle rose).
• Relégation des femmes : Le modèle « Kinder, Kuche, Kirche » (Enfant, Cuisine, Église) visait à supprimer les droits politiques des femmes pour les cantonner au rôle d'épouse-mère du guerrier.
--------------------------------------------------------------------------------
À partir des années 1960, l'hégémonie virile est attaquée de front par les mouvements sociaux.
• L'ère des luttes LGBT et féministes : La dépénalisation de l'homosexualité (1982 en France) et les victoires législatives (contraception, IVG avec la loi Veil) ont dissocié la sexualité de la reproduction.
• La fin du Pater Familias : Le passage de l'autorité paternelle à l'autorité parentale conjointe a mis fin à la domination juridique absolue du père dans le foyer.
• Le sentiment d'humiliation : Pour les nostalgiques de la domination, ces changements sont vécus comme une dépossession de pouvoir et une « féminisation » de la société.
--------------------------------------------------------------------------------
La puissance masculine reste souvent indexée sur des attributs physiques et des performances quantifiables.
• Le Phallus comme sceptre : La puissance virile est fréquemment réduite à la puissance phallique, créant une obsession pour la taille, la durée et le nombre de conquêtes.
• La culture du vestiaire : Dès l'adolescence, la pression des pairs impose un masque de dureté. La sensibilité est assimilée à une défaillance.
• La domination économique : Au travail, Homo Virilus adopte l'uniforme du cadre ou du manager performant. Les « broligarches » (contraction de brothers et oligarques) utilisent des codes de guerre pour écraser la concurrence.
• La détresse silencieuse : L'échec professionnel est vécu comme une perte de valeur sociale totale. Le tabou de la santé mentale masculine mène à une « épidémie silencieuse » de suicides et de consommations excessives de drogues.
--------------------------------------------------------------------------------
La dénonciation des violences sexistes et sexuelles remet en cause le « droit de cuissage » implicite de l'Homo Virilus.
• De la culture du viol au consentement : Des procès historiques (menés par Gisèle Halimi) à l'affaire Mazan, la société prend conscience que le viol n'est pas le fait de marginaux, mais d'hommes « ordinaires » issus de tous les milieux.
• Prise de conscience masculine : Le mouvement MeToo a forcé certains hommes à réévaluer leurs comportements passés, notamment sur la notion de rapport forcé ou de pression exercée sur les femmes.
• Le coût de la virilité : Les statistiques révèlent que les hommes sont responsables de :
◦ 91 % des tentatives d'homicides. ◦ 99 % des incendies volontaires. ◦ 84 % des accidents de la route mortels. ◦ Coût total : Près de 100 milliards d'euros par an en France.
--------------------------------------------------------------------------------
En réaction à ces évolutions, un courant réactionnaire puissant s'organise, notamment sur les réseaux sociaux.
• Le discours du déclin : Des personnalités politiques et médiatiques prédisent l'effondrement de la civilisation face à la « castration » de l'homme blanc.
• L'influence de TikTok : La « manosphère » attire les jeunes hommes avec des conseils de drague et de fitness qui cachent un agenda antiféministe radical. Les femmes y sont souvent désignées comme des « féminazis ».
• Le mouvement Incel : Les « célibataires involontaires » développent une haine profonde des femmes, allant parfois jusqu'à l'apologie du terrorisme ou au passage à l'acte meurtrier (Montréal, Californie).
--------------------------------------------------------------------------------
Des alternatives à l'Homo Virilus émergent, cherchant à dissocier la masculinité de la domination.
• La paternité active : Des ateliers de préparation à la paternité aident les hommes à s'approprier les gestes du soin et de l'éducation, sortant du rôle binaire « autorité et finance ».
• La masculinité au pluriel : Les sociologues et les personnes trans (comme Léon) soulignent que la testostérone ne crée pas le comportement dominateur ; c'est l'éducation qui façonne la virilité toxique.
• Distinction clé :
Les hommes se trouvent aujourd'hui à la croisée des chemins : perpétuer un stéréotype obsolète et coûteux, ou explorer des formes de masculinité fondées sur l'équité, la sensibilité et le partage des responsabilités.
Dan
Il y a écrit "Résumé" sous la vidéo mais vous ne proposez finalement pas de résumé ? uniquement la transcription ?
RRID:SCR_016479
DOI: 10.1007/s00520-025-09697-y
Resource: IBM SPSS Statistics (RRID:SCR_016479)
Curator: @areedewitt04
SciCrunch record: RRID:SCR_016479
RRID:Addgene_8453
DOI: 10.1038/s41467-025-67817-y
Resource: RRID:Addgene_8453
Curator: @scibot
SciCrunch record: RRID:Addgene_8453
RRID:AB_10900261
DOI: 10.1016/j.celrep.2026.116939
Resource: (BioLegend Cat# 117331, RRID:AB_10900261)
Curator: @scibot
SciCrunch record: RRID:AB_10900261
¿Cuáles son las tres acciones que debe realizar en secuencia? Para responder, mueva las acciones correspondientes de la lista de acciones al área de respuestas y ordénelas correctamente.
azcontainerapp env create
azcontainerapp job create
azcontainerapp job start
NOTA: Cada selección correcta vale un punto.
Determinar si las plantillas siguen las prácticas recomendadas.
Probar y validar los cambios que las plantillas realizarán en el entorno.
Seleccionar y colocar:
Export a Resource Manager template (Exportar una plantilla de Azure Resource Manager desde la cuenta de almacenamiento existente)
Modify the template by changing the storage account name and region (Modificar la plantilla para usar un nuevo nombre de cuenta y la región de destino)
Create a new template deployment (Crear una nueva implementación usando la plantilla modificada)
Deploy the template to create a new storage account in the target region (Implementar la plantilla para crear la nueva cuenta de almacenamiento en la región destino)
Use AzCopy to copy the data to the new storage account (Copiar los datos directamente entre cuentas usando AzCopy, servidor-a-servidor)
NOTA: Cada selección correcta vale un punto.
1.- Devuelva el estado más reciente del paciente.
2.- Devuelva los datos de supervisión de la salud que no estén retrasados más de una versión.
3.- Después de que el paciente sea dado de alta y se hayan evaluado todos los cargos, recupere los datos de facturación correctos con los cargos finales.
NOTA: Cada respuesta correcta vale un punto.
1.- El código registrará la hora en la que el pedido fue procesado desde la cola.
2.- Cuando la función ProcessOrders falla, la función se reintentará hasta cinco veces para un pedido determinado, incluyendo el primer intento.
3.- Cuando hay varios pedidos en la cola, se recuperará un lote de pedidos desde la cola y la función ProcessOrders ejecutará múltiples instancias de forma concurrente para procesar los pedidos.
4.- La función ProcessOrders enviará el pedido como salida a una tabla Orders en Azure Table Storage.
uras 4.16: Coeficientes del modelo de regresión (FACSO 2021 - 2024)
y un coef plot tipo cleaveland x carrera?
sumamente distinto
ojo, explicar razón de esto: tema reprobados, y tema cursos obligatorios y sin datos de titulación, así que se están comparando peras con manzanas De hecho, no estaría demás hacer un gráfico comparativo entre las dos bases de datos como inicio
Las cohortes apuntan al año de ingreso del estudiante, consecuentemente, los estudiantes de cohortes más antiguas tienen mayor información disponible, debido a que han cursado más semestres y, por tanto, más ramos
mucha coma
de
faltan artículos a todas las tablas y figuras
resultados.
TAmbién acá: todos los códigos de generación de bases y libros de códigos se encuentran en el repo ....
Resumen ejecutivo del estudio.
abajo también en un párrafo (o call out) sobre temas de apertura y reproducibilidad del reporte
y también el gráfico de la estructura del repo comentado (o su link al readme. Mejor, que el readme sea idéntico al resumen ejecutivo
El rendimiento académico ha representado históricamente uno de los elementos constitutivos de la educación superior, siendo el mejor indicador para medir el logro de los aprendizajes de los estudiantes (Garbanzo Vargas, 2013). En este sentido, las calificaciones otorgan un tipo de credencial a quienes cursan una carrera universitaria al demostrar empíricamente si los contenidos impartidos fueron o no aprehendidos.
esto lo incorporaría al párrafo 3 actual, y partiría con el 2 actual
Construcción inicial de estado observado
algunas cosas son de esto y otras de provider, reanalizar. hoy getsim trae varios icc paginado.
n evento técnico desde la telco vía webhook.
sms recibido y iniciar y terminar sesion hoy se esta tomando con movistar.
sesión
tampoco es por webhook pero si existe inicio y fin de sesion en algunos proveedores ->no entra en esta fase las sesiones
1 Introduction
pasar todo el paper por grammarly, muchos errores de redacción y gramaticales que no voy a corregir
nuanced pattern
contaría esto de otra forma con tal de enfatizar que las desigualdades de género persisten en entornos digitales, y así no aludir a una matización de las disparidades
Author response:
Global answer about the ATP analogs (concerns the 3 reviewers)
We use ATP-Vanadate essentially for detecting the FRET efficiency for the closed state. But these data are not included in our theoretical model. Thus, even if the comments of the reviewers on the observation of a non-negligible fraction of proteins in the open state in the presence of ATP-vanadate are justified, this has no consequence on our conclusions on the effect of curvature on BmrA on the conformational changes with ATP or AMP-PNP.
We agree with the comments of the reviewers that the binding of vanadate is not irreversible, but the reported lifetime of the closed state is very long compared to our experimental conditions (see (Urbatsch et al. JBC (1995)) on PgP).
Nevertheless, we will perform new experiments independent of ATP analogs using the E504A BmrA mutant. It has been shown structurally and enzymatically to bind and not hydrolyze ATP and to be 100% in a closed conformation at 5 mM ATP (A. Gobet et al., Nat. Commun. 16, 1745 (2025)). It will clear up all doubts about our experiments.
We will also add new references:
I. L. Urbatsch, B. Sankaran, J. Weber, A. E. Senior, J. Biol. Chem. 270, 19383 (1995)
T. Baukrowitz, T.-C. Hwang, A. C. Nairn, D. C. Gadsby, Neuron 12, 473 (1994)
A. Gobet et al., Nat. Commun. 16, 1745 (2025)
Y. Liu, M. Liao, Sci. Adv. 11, eadv9721 (2025) (on the effect of vanadate and temperature on a plant ABC)
Public Reviews:
Reviewer #1 (Public review):
(1) An important aspect of this paper is the difference in mechanism between inhibitors AMP-PNP (a substrate analog) and vanadate (together with ADP, forms a transition state analog inhibitor). The mechanisms and inhibitory constants/binding affinities of these inhibitors are not very well-supported in the current form of the manuscript, either through citations or through experiments. Related to this, the interpretation of the different curvature response of BmrA in the presence of vanadate vs AMPPNP is not very clear.
See the global answer about ATP-analogs (above)
(2) Overall, the energetic contribution of the membrane curvature is subtle (less than a kT), so while the principles seem generalizable among membrane proteins, whether these principles impact transport or cell physiology remains to be established.
This is correct that the effect is limited to high curvature in the case of BmrA. Our theoretical model allows predictions for different protein parameters. The effect is particularly dependent on the protein size and on protein conicity, which can vary over a wide range. We show that larger proteins, such as piezo 1 are in principle expected to display a much stronger curvature dependence than BmrA. But testing our predictions on other proteins and on their physiological function is indeed an exciting perspective but beyond the objective of the current manuscript.
Reviewer #2 (Public review):
(1) Although this study may be considered as a purely biophysical investigation of the sensitivity of an ABC transporter to mechanical perturbation of the membrane, the impact would be strengthened if a physiological rationale for this mode of regulation were discussed. Many factors, including temperature, pH, ionic strength, or membrane potential, are likely to affect flux through the transport cycle to some extent, without justifying describing BmrA as a sensor for changes in any of these. Indeed, a much stronger dependence on temperature than on membrane curvature was measured. It is not clear what radii of curvature BmrA would normally be exposed to, and whether this range of curvatures corresponds to the range at which modulation of transport activity could occur. Similarly, it is not clear what biological condition would involve a substantial change to membrane curvature or tension that would necessitate altered BmrA activity.
Reviewers 1 and 2 both stressed that we showed that activity and conformational changes are mechanosensitive, not that the function of the protein is to be a mechanosensor. This will be corrected.
Regarding the physiological relevance of the mechanosensitivity of BmrA, we have addressed this point in the manuscript (bottom of page 10 and top of page 11). This discussion was positively appreciated by Reviewer #3. We stress that we have used BmrA as a model system, but considering our results and the theoretical model, we can predict the parameters that are relevant for future studies on the sensitivity of other transmembrane proteins to membrane mechanical properties. And, as stated by the reviewer, "mechanosensitivity of proteins is an understudied phenomenon".
(2) The size distributions of vesicles were estimated by cryoEM. However, grid blotting leaves a very thin layer of vitreous ice that could sterically exclude large vesicles, leading to a systematic underestimation of the vesicle size distribution.
We used Lacey carbon grids with large mesh size ranges for our cryoEM images, and we blot on the backside, precisely to measure the largest size range accessible to cryoEM. In our hands, this was not the case when using Quantifoil or C-Flat grids with uniform hole sizes and a large fraction of carbon where the vesicles adhere. With our grids, we are able to image vesicles from 20 to 200 nm diameter and the precision on the diameter is high, but the statistics might not be as good as with DLS or other diffusion-based methods. DLS is an indirect method (as compared to cryoEM) to measure vesicle size distribution, that may overestimate the fraction of large objects and underestimate the small ones. We will perform DLS experiments for comparison purpose.
(3) The relative difference in ATP turnover rates for BmrA in small versus large vesicles is modest (~2-fold) and could arise from different success rates of functional reconstitution with the different protocols.
The ATPase activity is sensitive to several parameters. We thus carefully characterized our reconstituted samples, including ATPase activity, yield of incorporation and orientation of proteins that are often reported. In addition, we showed by cryo-EM the unilamellarity of the proteoliposomes and their stability during the experiments, which were never reported. The ATPase activity of our samples reconstituted in liposomes at 20 ° and at 4°C are high, among the highest reported for BmrA, and less sensitive to errors as compared to the low activities in micelles of detergent.
We would also like to stress that with our protocol, we have prepared the same batch of lipid/protein mixture that we have split it 2 for the reconstitution at 4°C and 20°C conversely. Both preparations contain the same amount of detergent. The only difference is that we include more BioBeads for the preparation at 4°C to account for the difference of absorption of the detergent on the beads at low temperature (D. Lévy, A. Bluzat, M. Seigneuret, J.L. Rigaud Biochim. Biophys. Acta. 179 (1990)), but we also showed that the proteins do not adsorb on the BioBeads (J.-L. Rigaud, B. Pitard, D. Levy, Biochim. Biophys. Acta 1231, 223 (1995)). In addition, the activity of the protein at 37°C is high and comparable to those reported in the literature (E. Steinfels et al., Biochemistry 43, 7491 (2004)., W. Mi et al., Nature 549, 233 (2017).), which speaks for a good functional reconstitution. Finally, our results are consistent between the smFRET where we have only one protein maximum per vesicle and the activity measurements where the amount of protein is higher.
We also performed reconstitution from molar LPR= 1:13600 to 1:1700 and found the same activity per protein, confirming that the proteins are functional, independently of their surface fraction. We will add these data in the revision.
Altogether, these data suggest that we correctly estimate the rate of functional reconstitution in our experiments.
Nevertheless, we will design additional experiments to further compare the activity of the proteins before and after reconstitution.
(4) The conformational state of the NBDs of BmrA was measured by smFRET imaging. Several aspects of these investigations could be improved or clarified. Firstly, the inclusion and exclusion criteria for individual molecules should be more quantitatively described in the methods. Secondly, errors were estimated by bootstrapping. Given the small differences in state occupancies between conditions, true replicates and statistical tests would better establish confidence in their significance. Thirdly, it is concerning that very few convincing dynamic transitions between states were observed. This may in part be due to fast photobleaching compared to the rate of isomerization, but this could be overcome by reducing the imaging frequency and illumination power. Alternatively, several labs have established the ability to exchange solution during imaging to thereby monitor the change in FRET distribution as a ligand is delivered or removed. Visualizing dynamic and reversible responses to ligands would greatly bolster confidence in the condition-dependent changes in FRET distributions. Such pre-steady state experiments would also allow direct comparison of the kinetics of isomerization from the inward-facing to the outward-facing conformation on delivery of ATP between small and large vesicles.
(a) We will better detail the inclusion and exclusion criteria.
(b) For the smFRET, we have performed N=3 true replicates. We will add statistical tests on our graphs.
(c) We will detail more how we have optimized our illumination protocol, considering the signal to noise ratio and the photobleaching. Practically, we cannot add ATP to our sealed observation chamber on our TIRF system to detect dynamical changes on our immobilized liposomes. The experiment suggested by the reviewer would imply to build a flow chamber to exchange the medium around immobilized liposomes, compatible with TIRF microscopy. This is an excellent idea, which has been achieved only recently (S. N. Lefebvre, M. Nijland, I. Maslov, D. J. Slotboom, Nat. Commun. 16, 4448 (2025)). It will require a full new study to optimize both the flow chamber and the dyes to track the smFRET changes over long periods of time.
Nevertheless, we would like to stress that our objective is not to study the dynamics of the conformational changes, and that we expect it to be slow for BmrA, even at 33°C.
(5) A key observation is that BmrA was more prone to isomerize ATP- or AMP-PNP-dependently to the outward-facing conformations in large vesicles. Surprisingly, the same was not observed with vanadate-trapping, although the sensitivity of state occupancy to membrane curvature would be predicted to be greatest when state occupancies of both inward- and outward-facing states are close to 50%. It is argued that this was due to irreversibility of vanadate-trapping, but both vanadate and AMP-PNP should work fully reversibly on ABC transporters (see e.g. PMID: 7512348 for vanadate). Further, if trapping were fully irreversible, a quantitative shift to the outward-facing condition would be predicted.
See the global answer about ATP-analogs (above)
Reviewer #3 (Public review):
(1) The authors say that the protein activity is irreversibly inhibited by orthovanadate, but 50% of the proteins are still in open conformation, while being accessible to the analogue (Table 2). It is unclear what this means in the context of activity vs. conformation.
See the global answer about ATP-analogs (above)
(2) The difference in the fraction of proteins in closed conformation is quite similar between LV and SV treated with AMP-PNP at 20 {degree sign}C (Figure 2B), and it is not clear if the difference is significant. The presence of a much higher FRET tail in the plots of smFRET experiment in SVs at 20 {degree sign}C or 33 {degree sign}C in the apo conformation of the protein (Figure 3A-B) is cause of some concern since one would not expect BmrA to access the closed states more frequently in the Apo conformation especially when incorporated in the SV. This is because the subtraction of the higher fraction of closed states in the Apo conformation contributes directly to enhancing the bias between the closed states in SV versus LV membrane bilayers.
We have consistently observed, both at 20°C and at 33°C, a fraction of proteins with a high FRET signal in our measurements, higher in SV (about 15% and 17%) than in LV (about 10% and 6%). We have quantified the fraction of proteins with NBDs facing inside the liposomes (page 5), 20% in LV and 23.85% in SV. Considering the inverted curvature of the membrane, this orientation could favor the closed conformation, even in the absence of ATP, more for SV than LV. The fraction with inverted orientation could explain our higher fraction of high FRET signal in SV.
Moreover, for part of it, it can be due to a fraction of proteins with a non-specific labeling that would produce a higher FRET signal. We will add data with Cys-less mutants showing that less than 4% are labeled.
Author response:
The following is the authors’ response to the current reviews.
Public Reviews:
Reviewer #1 (Public review):
The revised manuscript presents an interesting and technically competent set of experiments exploring the role of the infralimbic cortex (IL) in extinction learning. The inclusion of histological validation in the supplemental material improves the transparency and credibility of the results, and the overall presentation has been clarified. However, several key issues remain that limit the strength of the conclusions.
We thank the Reviewer for their positive assessment of our revised manuscript. We discussed the issues raised by the Reviewer below.
The behavioral effects reported are modest, as evident from the trial-by-trial data included in the supplemental figures. Although the authors interpret their findings as evidence that IL stimulation facilitates extinction only after prior inhibitory learning, this conclusion is not directly supported by their data. The experiments do not include a condition in which IL stimulation is delivered during extinction training alone, without prior inhibitory experience. Without this control, the claim that prior inhibitory memory is necessary for facilitation remains speculative.
The manuscript provides evidence across five experiments (Figures 2-6) that IL stimulation fails to facilitate extinction training in the absence of prior inhibitory experience. We therefore remain confident that the data support our conclusion: prior inhibitory learning enables IL stimulation to facilitate subsequent inhibitory learning.
The electrophysiological example provided shows that IL stimulation induces a sustained inhibition that outlasts the stimulation period. This prolonged suppression could potentially interfere with consolidation processes following tone presentation rather than facilitating them. The authors should consider and discuss this alternative interpretation in light of their behavioral data.
The possibility that IL stimulation exerted its effects by interfering with consolidation processes is inconsistent with the literature. Disrupting consolidation processes in the IL impairs extinction learning (1), even when animals have prior inhibitory learning experience (2). Yet our experiments found that IL stimulation failed to interfere with initial extinction learning but instead facilitated subsequent learning. Furthermore, the electrophysiological example demonstrates that the inhibitory effect is transient: the cell returned to firing properties similar to those observed pre-stimulation, making it unlikely that inhibition persists during the consolidation window.
It is unfortunate that several animals had to be excluded after histological verification, but the resulting mismatch between groups remains a concern. Without a power analysis indicating the number of subjects required to achieve reliable effects, it is difficult to determine whether the modest behavioral differences reflect genuine biological variability or insufficient statistical power. Additional animals may be needed to properly address this imbalance.
As noted in the revised manuscript, we are confident about the reliability of the findings reported. The manuscript provides evidence across five experiments that IL stimulation fails to facilitate brief extinction in the absence of prior inhibitory experience, replicating previous findings (3, 4). The manuscript also replicates these prior studies by demonstrating that experience with either fear or appetitive extinction enables IL stimulation to facilitate subsequent fear extinction. Furthermore, the present experiments replicate the facilitative effects of IL stimulation following fear or appetitive backward conditioning.
Overall, while the manuscript is improved in clarity and methodological detail, the behavioral effects remain weak, and the mechanistic interpretation requires stronger experimental support and consideration of alternative explanations.
We respectfully disagree with the assertion that the reported results are weak. The manuscript replicates all main findings internally or reproduces findings from previously published studies. While alternative explanations cannot be entirely excluded, we are not aware of any competing account that predicts the pattern of results reported here.
Reviewer #2 (Public review):
Summary:
In this manuscript, the authors examine the mechanisms by which stimulation of the infralimbic cortex (IL) facilitates the retention and retrieval of inhibitory memories. Previous work has shown that optogenetic stimulation of the IL suppresses freezing during extinction but does not improve extinction recall when extinction memory is probed one day later. When stimulation occurs during a second extinction session (following a prior stimulation-free extinction session), freezing is suppressed during the second extinction as well as during the tone test the following day. The current study was designed to further explore the facilitatory role of the IL in inhibitory learning and memory recall. The authors conducted a series of experiments to determine whether recruitment of IL extends to other forms of inhibitory learning (e.g., backward conditioning) and to inhibitory learning involving appetitive conditioning. Further, they assessed whether their effects could be explained by stimulus familiarity. The results of their experiments show that backward conditioning, another form of inhibitory learning, also enabled IL stimulation to enhance fear extinction. This phenomenon was not specific to aversive learning as backward appetitive conditioning similarly allowed IL stimulation to facilitate extinction of aversive memories. Finally, the authors ruled out the possibility that IL facilitated extinction merely because of prior experience with the stimulus (e.g., reducing the novelty of the stimulus). These findings significantly advance our understanding of the contribution of IL to inhibitory learning. Namely, they show that the IL is recruited during various forms of inhibitory learning and its involvement is independent of the motivational value associated with the unconditioned stimulus.
We thank the Reviewer for their positive assessment.
Strengths to highlight:
(1) Transparency about the inclusion of both sexes and the representation of data from both sexes in figures
We thank the Reviewer for their positive assessment.
(2) Very clear representation of groups and experimental design for each figure
We thank the Reviewer for their positive assessment.
(3) The authors were very rigorous in determining the neurobehavioral basis for the effects of IL stimulation on extinction. They considered multiple interpretations and designed experiments to address these possible accounts of their data.
We thank the Reviewer for their positive assessment.
(4) The rationale for and the design of the experiments in this manuscript are clearly based on a wealth of knowledge about learning theory. The authors leveraged this expertise to narrow down how the IL encodes and retrieves inhibitory memories.
We thank the Reviewer for their positive assessment.
Reviewer #3 (Public review):
Summary:
This is a really nice manuscript with different lines of evidence to show that the IL encodes inhibitory memories that can then be manipulated by optogenetic stimulation of these neurons during extinction. The behavioral designs are excellent, with converging evidence using extinction/re-extinction, backwards/forwards aversive conditioning, and backwards appetitive/forwards aversive conditioning. Additional factors, such as nonassociative effects of the CS or US, also are considered, and the authors evaluate the inhibitory properties of the CS with tests of conditioned inhibition. The authors have addressed the prior reviews. I still think it is unfortunate that the groups were not properly balanced in some of the figures (as noted by the authors, they were matched appropriately in real time, but some animals had to be dropped after histology, which caused some balancing issues). I think the overall pattern of results is compelling enough that more subjects do not need to be added, but it would still be nice to see more acknowledgement and statistical analyses of how these pre-existing differences may have impacted test performance.
We thank the Reviewer for their positive assessment of our revised manuscript. We discussed the comments regarding group balancing below.
Strengths:
The experimental designs are very rigorous with an unusual level of behavioral sophistication.
We thank the Reviewer for their positive assessment
Weaknesses:
The various group differences in Figure 2 prior to any manipulation are still problematic. There was a reliable effect of subsequent group assignment in Figure 2 (p<0.05, described as "marginal" in multiple places). Then there are differences in extinction (nonsignificant at p=.07). The test difference between ReExt OFF/ON is identical to the difference at the end of extinction and the beginning of Forward 2, in terms of absolute size. I really don't think much can be made of the test result. The authors state in their response that this difference was not evident during the forward phase, but there clearly is a large ordinal difference on the first trial. I think it is appropriate to only focus on test differences when groups are appropriately matched, but when there are pre-existing differences (even when not statistically significant) then they really need to be incorporated into the statistical test somehow.
We carefully considered the Reviewer's suggestion, but it is not possible to adjust the statistical analyses at test because these analyses do not directly compare the two ReExt groups. Any scaling of performance would require including the two Ext groups, which is not feasible since these groups did not receive initial extinction. Moreover, the analyses provide no conclusive evidence of pre-existing differences between the two ReExt groups: the difference was not significant during initial extinction and was absent during the Forward 2 stage. We acknowledge that closer performance between the two ReExt groups during initial extinction would have been preferable. However, we remain confident in the results obtained because they replicate previous experiments in which the two ReExt groups displayed identical performance during initial extinction.
The same problem is evident in Figure 4B, but here the large differences in the Same groups are opposite to the test differences. It's hard to say how those large differences ultimately impacted the test results. I suppose it is good that the differences during Forward conditioning did not ultimately predict test differences, but this really should have been addressed with more subjects in these experiments. The authors explore the interactions appropriately but with n=6 in the various subgroups, it's not surprising that some of these effects were not detected statistically.
As the Reviewer noted, the unexpected differences in Figure 4B are opposite in direction to the test differences. Importantly, Figure 4B replicates the main findings from Figure 3, which did not show these unexpected differences.
It is useful to see the trial-by-trial test data now presented in the supplement. I think the discussion does a good job of addressing the issues of retrieval, but the ideas of Estes about session cues that the authors bring up in their response haven't really held up over the years (e.g., Robbins, 1990, who explicitly tested this; other demonstrations of within-session spontaneous recovery), for what it's worth.
We thank the Reviewer for bringing our attention to Robbins’ work on session cues. We understand that the issue of retrieval is important but as we noted before, our manuscript and its conclusions do not claim to differentiate retrieval from additional learning.
References
(1) K. E. Nett, R. T. LaLumiere, Infralimbic cortex functioning across motivated behaviors: Can the differences be reconciled Neurosci Biobehav Rev 131, 704–721 (2021).
(2) V. Laurent, R. F. Westbrook, Inactivation of the infralimbic but not the prelimbic cortex impairs consolidation and retrieval of fear extinction Learn Mem 16, 520–529 (2009).
(3) N. W. Lingawi, R. F. Westbrook, V. Laurent, Extinction and Latent Inhibition Involve a Similar Form of Inhibitory Learning that is Stored in and Retrieved from the Infralimbic Cortex Cereb Cortex 27, 5547–5556 (2017).
(4) N. W. Lingawi, N. M. Holmes, R. F. Westbrook, V. Laurent, The infralimbic cortex encodes inhibition irrespective of motivational significance Neurobiol Learn Mem 150, 64–74 (2018).
The following is the authors’ response to the original reviews.
Public Reviews:
Reviewer #1 (Public review):
Summary:
The manuscript reports a series of experiments designed to test whether optogenetic activation of infralimbic (IL) neurons facilitates extinction retrieval and whether this depends on animals' prior experience. In Experiment 1, rats underwent fear conditioning followed by either one or two extinction sessions, with IL stimulation given during the second extinction; stimulation facilitated extinction retrieval only in rats with prior extinction experience. Experiments 2 and 3 examined whether backward conditioning (CS presented after the US) could establish inhibitory properties that allowed IL stimulation to enhance extinction, and whether this effect was specific to the same stimulus or generalized to different stimuli. Experiments 5 - 7 extended this approach to appetitive learning: rats received backward or forward appetitive conditioning followed by extinction, and then fear conditioning, to determine whether IL stimulation could enhance extinction in contexts beyond aversive learning and across conditioning sequences. Across studies, the key claim is that IL activation facilitates extinction retrieval only when animals possess a prior inhibitory memory, and that this effect generalizes across aversive and appetitive paradigms.
Strengths:
(1) The design attempts to dissect the role of IL activity as a function of prior learning, which is conceptually valuable.
We thank the Reviewer for their positive assessment.
(2) The experimental design of probing different inhibitory learning approaches to probe how IL activation facilitates extinction learning was creative and innovative.
We thank the Reviewer for their positive assessment.
Weaknesses:
(1) Non-specific manipulation.
ChR2 was expressed in IL without distinction between glutamatergic and GABAergic populations. Without knowing the relative contribution of these cell types or the percentage of neurons affected, the circuit-level interpretation of the results is unclear.
ChR2 was intentionally expressed in the infralimbic cortex (IL) without distinction between local neuronal populations for two reasons. First, the primary aim of this was to uncover some of the features characterizing the encoding of inhibitory memories in the IL, and this encoding likely engages interactions among various neuronal populations within the IL. Second, the hypotheses tested in the manuscript derived from findings that indiscriminately stimulated the IL using the GABA<sub>A</sub> receptor antagonist picrotoxin, which is best mimicked by the approach taken. We agree that it is also important to determine the respective contributions of distinct IL neuronal populations to inhibitory encoding; however, the global approach implemented in the present experiments represents a necessary initial step. These matters have been incorporated in the Discussion of the revised manuscript.
(2) Extinction retrieval test conflates processes
The retrieval test included 8 tones. Averaging across this many tone presentations conflate extinction retrieval/expression (early tones) with further extinction learning (later tones). A more appropriate analysis would focus on the first 2-4 tones to capture retrieval only. As currently presented, the data do not isolate extinction retrieval.
It is unclear when retrieval of what has been learned across extinction ceases and additional extinction learning occurs. In fact, it is only the first stimulus presentation that unequivocally permits a distinction between retrieval and additional extinction learning, as the conditions for this additional learning have not been fulfilled at that presentation. However, confining evidence for retrieval to the first stimulus presentation introduces concerns that other factors could influence performance. For instance, processing of the stimulus present at the start of the session may differ from that present at the end of the previous session, thereby affecting what is retrieved. Such differences between the stimuli present at the start and end of an extinction session have been long recognized as a potential explanation for spontaneous recovery (Estes, 1955). More importantly, whether the test data presented confound retrieval and additional extinction learning or not, the interpretation remains the same with respect to the effects of a prior history of inhibitory learning on enabling the facilitative effects of IL stimulation. Finally, it is unclear how these facilitative effects could occur in the absence of the subjects retrieving the extinction memory formed under the stimulation. Nevertheless, the revised manuscript now provides the trial-by-trial performance (see Supplemental Figure 3) during the post-extinction retrieval tests and addresses this issue in the Discussion.
(3) Under-sampling and poor group matching.
Sample sizes appear small, which may explain why groups are not well matched in several figures (e.g., 2b, 3b, 6b, 6c) and why there are several instances of unexpected interactions (protocol, virus, and period). This baseline mismatch raises concerns about the reliability of group differences.
Efforts were made to match group performance upon completion of each training stage and before IL stimulation. Unfortunately, these efforts were not completely successful due to exclusions following post-mortem analyses. This has been made explicit in the revised manuscript (Materials and Methods, Subjects section). However, we acknowledge that the unexpected interactions deserve further discussion, and this has been incorporated into the revised manuscript (see also comment from Reviewer 2). Although we cannot exclude the possibility that sample sizes may have contributed to some of these interactions, we remain confident about the reliability of the main findings reported, especially given their replication across the various protocols. Overall, the manuscript provides evidence that IL stimulation does not facilitate brief extinction in the absence of prior inhibitory experience in five different experiments, replicating previous findings (Lingawi et al., 2018; Lingawi et al., 2017). It also replicates these previous findings by showing that prior experience with either fear or appetitive extinction enables IL stimulation to facilitate subsequent fear extinction. Furthermore, the facilitative effects of such stimulation following fear or appetitive backward conditioning are replicated in the present manuscript. This is discussed in the Discussion of the revised manuscript.
(4) Incomplete presentation of conditioning data
Figure 3 only shows a single conditioning session despite five days of training. Without the full dataset, it is difficult to evaluate learning dynamics or whether groups were equivalent before testing.
We apologize, as we incorrectly labeled the X axis for the backward conditioning data in Figures 3B, 4B, 4D and 5B. It should have indicated “Days” instead of “Trials”. This error has been corrected in the revised manuscript (see also second comment from Reviewer 2).
(5) Interpretation stronger than evidence.
The authors conclude that IL activation facilitates extinction retrieval only when an inhibitory memory has been formed. However, given the caveats above, the data are insufficient to support such a strong mechanistic claim. The results could reflect nonspecific facilitation or disruption of behavior by broad prefrontal activation. Moreover, there is compelling evidence that optogenetic activation of IL during fear extinction does facilitate subsequent extinction retrieval without prior extinction training (DoMonte et al 2015, Chen et al 2021), which the authors do not directly test in this study.
As noted above, the interpretations of the main findings stand whether the test data confounds retrieval with additional extinction learning or not. The revised manuscript also clarifies the plotting of the data for the backward conditioning stages. We do agree that further discussion of the unexpected interactions is necessary, and this has been incorporated into the revised manuscript. However, the various replications of the core findings provide strong evidence for their reliability and the interpretations advanced in the original manuscript. The proposal that the results reflect non-specific facilitation or disruption of behavior seems highly unlikely. Indeed, the present experiments and previous findings (Lingawi et al., 2018; Lingawi et al., 2017) provide multiple demonstrations that IL stimulation fails to produce any facilitation in the absence of prior inhibitory experience with the target stimulus. Although these demonstrations appear inconsistent with previous studies (Do-Monte et al., 2015; Chen et al., 2021), this inconsistency is likely explained by the fact that these studies manipulated activity in specific IL neuronal populations. Previous work has already revealed differences between manipulations targeting discrete IL neuronal populations as opposed to general IL activity (Kim et al., 2016). Importantly, as previously noted, the present manuscript aimed to generally explore inhibitory encoding in the IL that is likely to engage several neuronal populations within the IL. Adequate statements on these matters have been included in the Discussion of the revised manuscript.
Reviewer #2 (Public review):
Summary:
In this manuscript, the authors examine the mechanisms by which stimulation of the infralimbic cortex (IL) facilitates the retention and retrieval of inhibitory memories. Previous work has shown that optogenetic stimulation of the IL suppresses freezing during extinction but does not improve extinction recall when extinction memory is probed one day later. When stimulation occurs during a second extinction session (following a prior stimulation-free extinction session), freezing is suppressed during the second extinction as well as during the tone test the following day. The current study was designed to further explore the facilitatory role of the IL in inhibitory learning and memory recall. The authors conducted a series of experiments to determine whether recruitment of IL extends to other forms of inhibitory learning (e.g., backward conditioning) and to inhibitory learning involving appetitive conditioning. Further, they assessed whether their effects could be explained by stimulus familiarity. The results of their experiments show that backward conditioning, another form of inhibitory learning, also enabled IL stimulation to enhance fear extinction. This phenomenon was not specific to aversive learning, as backward appetitive conditioning similarly allowed IL stimulation to facilitate extinction of aversive memories. Finally, the authors ruled out the possibility that IL facilitated extinction merely because of prior experience with the stimulus (e.g., reducing the novelty of the stimulus). These findings significantly advance our understanding of the contribution of IL to inhibitory learning. Namely, they show that the IL is recruited during various forms of inhibitory learning, and its involvement is independent of the motivational value associated with the unconditioned stimulus.
Strengths:
(1) Transparency about the inclusion of both sexes and the representation of data from both sexes in figures.
We thank the Reviewer for their positive assessment.
(2) Very clear representation of groups and experimental design for each figure.
We thank the Reviewer for their positive assessment.
(3) The authors were very rigorous in determining the neurobehavioral basis for the effects of IL stimulation on extinction. They considered multiple interpretations and designed experiments to address these possible accounts of their data.
We thank the Reviewer for their positive assessment.
(4) The rationale for and the design of the experiments in this manuscript are clearly based on a wealth of knowledge about learning theory. The authors leveraged this expertise to narrow down how the IL encodes and retrieves inhibitory memories.
We thank the Reviewer for their positive assessment.
Weaknesses:
(1) In Experiment 1, although not statistically significant, it does appear as though the stimulation groups (OFF and ON) differ during Extinction 1. It seems like this may be due to a difference between these groups after the first forward conditioning. Could the authors have prevented this potential group difference in Extinction 1 by re-balancing group assignment after the first forward conditioning session to minimize the differences in fear acquisition (the authors do report a marginally significant effect between the groups that would undergo one vs. two extinction sessions in their freezing during the first conditioning session)?
Efforts were made daily to match group performance across the training stages, but these efforts were ultimately hampered by the necessary exclusions following postmortem analyses. This has been made explicit in the revised manuscript (Materials and Methods, Subjects section). Regarding freezing during Extinction 1, as noted by the Reviewer, the difference, which was not statistically significant, was absent across trials during the subsequent forward fear conditioning stage. Likewise, the protocol difference observed during the initial forward fear conditioning was absent in subsequent stages. We are therefore confident that these initial differences (significant or not) did not impact the main findings at test. Importantly, these findings replicate previous work using identical protocols in which no differences were present during the training stages. These considerations have been addressed in the revised manuscript (see Results for Experiment 1).
(2) Across all experiments (except for Experiment 1), the authors state that freezing during the initial conditioning increased across "days". The figures that correspond to this text, however, show that freezing changes across trials. In the methods, the authors report that backward conditioning occurred over 5 days. It would be helpful to understand how these data were analyzed and collated to create the final figures. Was the freezing averaged across the five days for each trial for analyses and figures?
We apologize, as noted above, for having incorrectly labeled the X axis across the backward conditioning data sets in Figures 3B, 4B, 4D and 5B. It should have indicated “Days” instead of “Trials”. The data shown in these Figures use the average of all trials on a given day. This has been clarified in the methods section of the revised manuscript (Statistical Analyses section). The labeling errors on the Figures have been corrected.
(3) In Experiment 3, the authors report a significant Protocol X Virus interaction. It would be useful if the authors could conduct post-hoc analyses to determine the source of this interaction. Inspection of Figure 4B suggests that freezing during the two different variants of backward conditioning differs between the virus groups. Did the authors expect to see a difference in backward conditioning depending on the stimulus used in the conditioning procedure (light vs. tone)? The authors don't really address this confounding interaction, but I do think a discussion is warranted.
We agree with the Reviewer that further discussion of the Protocol x Virus interaction that emerged during the backward conditioning and forward conditioning stages of Experiment 3 is warranted. This discussion has been provided in the revised manuscript (see Results section). Briefly, during both stages, follow-up analyses did not reveal any differences (main effects or interactions) between the two groups trained with the light stimulus (Diff-EYFP and Diff-ChR2). By contrast, the ChR2 group trained with the tone (Back-ChR2) froze more overall than the EYFP group (Back-EYFP), but there were no other significant differences between the two groups. Based on these analyses, the Protocol x Virus interaction appears to be driven by greater freezing in the ChR2 group trained with the tone rather than a difference in the backward conditioning performance based on stimulus identity. Consistent with this, the statistical analyses did not reveal a main effect of Protocol during either the backward conditioning stage or the stimulus trials during the forward conditioning stage. Nevertheless, during this latter stage, a main effect of Protocol emerged during baseline performance, but once again, this seems to be driven by the Back-ChR2 group. Critically, it is unclear how greater stimulus freezing in the Back-ChR2 group during forward conditioning would lead to lower freezing during the post-extinction retrieval test.
We note that an unexpected Protocol x Period interaction was found during appetitive backward conditioning in Experiment 5. For consistency, we conducted additional analyses to determine the source of this interaction (see Results section). As previously noted, performance during appetitive backward conditioning is noisy and cannot be taken as a failure to generate inhibitory learning. It is therefore unlikely that this interaction implied a difference in such learning.
(4) In this same experiment, the authors state that freezing decreased during extinction; however, freezing in the Diff-EYFP group at the start of extinction (first bin of trials) doesn't look appreciably different than their freezing at the end of the session. Did this group actually extinguish their fear? Freezing on the tone test day also does not look too different from freezing during the last block of extinction trials.
We confirm that overall, there was a significant decline in freezing across the extinction session shown in Figure 4B. The Reviewer is correct to point out that this decline was modest (if not negligible) in the Diff-EYFP group, which was receiving its first inhibitory training with the target tone stimulus. It is worth noting that across all experiments, most groups that did not receive infralimbic stimulation displayed a modest decline in freezing during the extinction session since it was relatively brief, involving only 6 or 8 tone alone presentations. This was intentional, as we aimed for the brief extinction session to generate minimal inhibitory learning and thereby to detect any facilitatory effect of infralimbic stimulation. This has been clarified and explained in the revised version of the manuscript (see Results section, description of Experiment 1).
(5) The Discussion explored the outcomes of the experiments in detail, but it would be useful for the authors to discuss the implications of their findings for our understanding of circuits in which the IL is embedded that are involved in inhibitory learning and memory. It would also be useful for the authors to acknowledge in the Discussion that although they did not have the statistical power to detect sex differences, future work is needed to explore whether IL functions similarly in both sexes.
In line with the Reviewer’s suggestion (see also Reviewer 3), the Discussion section has been substantially altered in the revised manuscript. Among other things, it does mention that future studies will need to examine the role of additional brain regions in the effects reported and it acknowledges the need to further explore sex differences and IL functions.
Reviewer #3 (Public review):
Summary:
This is a really nice manuscript with different lines of evidence to show that the IL encodes inhibitory memories that can then be manipulated by optogenetic stimulation of these neurons during extinction. The behavioral designs are excellent, with converging evidence using extinction/re-extinction, backwards/forwards aversive conditioning, and backwards appetitive/forwards aversive conditioning. Additional factors, such as nonassociative effects of the CS or US, are also considered, and the authors evaluate the inhibitory properties of the CS with tests of conditioned inhibition.
Strengths:
The experimental designs are very rigorous with an unusual level of behavioral sophistication.
We thank the Reviewer for their positive assessment
Weaknesses:
(1) More justification for parametric choices (number of days of backwards vs forwards conditioning) could be provided.
All experimental parameters were based on previously published experiments showing the capacity of the backward conditioning protocols to generate inhibitory learning and the forward conditioning protocols to produce excitatory learning. Although this was mentioned in the methods section, we acknowledge that further explanation was required to justify the need for multiple days of backward training. This has been provided in the revised manuscript (see Results section and description of the backward parameters.
(2) The current discussion could be condensed and could focus on broader implications for the literature.
The discussion has been severely condensed and broader implications have been discussed with respect to the existing literature looking at the neural circuitry underlying inhibitory learning.
Recommendations for the authors:
Reviewer #1 (Recommendations for the authors):
(1) Re-analyze extinction retrieval, focusing only on the first 2-4 tones to capture extinction expression.
This recommendation corresponds to the second public comment made by the Reviewer, and we have replied to this comment.
(2) Directly test whether activation of IL during fear extinction is insufficient to facilitate extinction retrieval without prior extinction training.
The manuscript provides five separate demonstrations that the optogenetic approach to stimulate IL activity did not facilitate the initial brief extinction session. This reproduces what had been found with indiscriminate pharmacological stimulation in our previous research (Lingawi et al., 2018; Lingawi et al., 2017). We appreciate that other work that stimulated specific IL neuronal populations has observed facilitation of extinction but, the present manuscript focuses on the role of all IL neuronal populations in encoding inhibitory memories. The Reviewer’s request would imply contrasting the role of various neuronal populations, which is beyond the scope of this manuscript. Nevertheless, we have modified our discussion to indicate that future research should establish which IL neuronal population(s) contribute to the effects reported here.
(3) Show the percentage of neurons that exhibit excitatory or inhibitory responses in IL after non-specific optogenetic activation to better understand how this manipulation is affecting IL circuitry.
All electrophysiological recordings (n = 10 cells) are presented in Figure 1C. ChR2 excitation was substantial and overwhelming. Based on the physiological and morphological characteristics of the recorded cells, one was non-pyramidal and was excited by LED light delivery. The remaining 9 cells were pyramidal. One did not respond to LED delivery, but we cannot exclude the possibility that this was due to a lack of ChR2 expression in the somatic compartment. Another cell showed a mild reduction in activity following LED stimulation, while the remaining 7 cells displayed clear excitation upon LED stimulation. We have modified our manuscript to reflect these observations. We did not include percentages since only 10 recordings are shown.
(4) Present data from all five conditioning sessions, not just one, to allow evaluation of learning history.
This recommendation corresponds to the fourth public comment made by the Reviewer, and we have replied to this comment.
(5) Address the issue of small and poorly matched groups, particularly in Figures 2b, 3b, 6b, and 6c.
This recommendation corresponds to the third public comment made by the Reviewer, and we have replied to this comment.
(6) Temper the conclusions to reflect the limitations of sampling, group matching, and the lack of specificity in the manipulation.
We have modified our Discussion to address potential issues related to sampling and group matching. However, we are unsure how the lack of specificity of the IL stimulation has any impact on the interpretations made, since no statement is made about neuronal specificity. That said, as noted above, “we have modified our discussion to indicate that future research should establish which IL neuronal population(s) contribute to the effects reported here”.
Reviewer #2 (Recommendations for the authors):
Nothing additional to include beyond what is written for public view.
Reviewer #3 (Recommendations for the authors):
This is a really nice manuscript with different lines of evidence to show that the IL encodes inhibitory memories that can then be manipulated by optogenetic stimulation of these neurons during extinction. The behavioral designs are excellent, with converging evidence using extinction/re-extinction, backwards/forwards aversive conditioning, and backwards appetitive/forwards aversive conditioning. Additional factors, such as nonassociative effects of the CS or US, are also considered, and the authors evaluate the inhibitory properties of the CS with tests of conditioned inhibition. I only have a couple of comments that the authors may want to consider.
We thank the Reviewer for their positive assessment.
First, in Figure 2, it is unfortunate that there is a general effect of the LED assignment before the LED experience (p=.07 during that first extinction session). This is in the same direction as the difference during the test, so it is not clear that the test difference really reflects differences due to Extinction 2 treatment or to preexisting differences based on group assignments.
The Reviewer’s comment is identical to the first public comment of Reviewer 2, which has been addressed.
Second, it is notable that the backwards fear conditioning phase was conducted over 5 days, but the forward conditioning phase was conducted over one day. The rationale for these differences should be presented. There is an old idea going back to Konorski that backwards conditioning may lead to excitation initially, and it is only after more extensive trials that inhibitory conditioning occurs (a finding supported by Heth, 1976). Some discussion of the potential biphasic nature of backwards conditioning would be useful, especially for people who want to run this type of experiment but with only a single session of backwards conditioning.
In line with the Reviewer’s suggestion, the revised manuscript (see results section) provide an explanation for conducting backward conditioning across multiple days.
Third, as written, each paragraph of the discussion is mostly a recapitulation of the findings from each experiment. This could be condensed significantly, and it would be nice to see more integration with the current literature and how these results challenge or suggest nuance in current thinking about IL function.
We have significantly condensed the recapitulation of our findings in the Discussion of the revised manuscript. The Discussion now dedicates space to address comments from the other Reviewers and integrate the present findings with the current literature.
References
Chen, Y.-H., Wu, J.-L., Hu, N.-Y., Zhuang, J.-P., Li, W.-P., Zhang, S.-R., Li, X.-W., Yang, J.-M., & Gao, T.-M. (2021). Distinct projections from the infralimbic cortex exert opposing effects in modulating anxiety and fear. J Clin Invest, 131(14), e145692. https://doi.org/10.1172/JCI145692
Do-Monte, F. H., Manzano-Nieves, G., Quiñones-Laracuente, K., Ramos-Medina, L., & Quirk, G. J. (2015). Revisiting the role of infralimbic cortex in fear extinction with optogenetics. J Neurosci, 35(8), 3607-3615. https://doi.org/10.1523/JNEUROSCI.3137-14.2015
Estes, W. K. (1955). Statistical theory of spontaneous recovery and regression. Psychol Rev, 62(3), 145-154. https://doi.org/10.1037/h0048509
Kim, H.-S., Cho, H.-Y., Augustine, G. J., & Han, J.-H. (2016). Selective Control of Fear Expression by Optogenetic Manipulation of Infralimbic Cortex after Extinction. Neuropsychopharmacology, 41(5), 1261-1273. https://doi.org/10.1038/npp.2015.276
Lingawi, N. W., Holmes, N. M., Westbrook, R. F., & Laurent, V. (2018). The infralimbic cortex encodes inhibition irrespective of motivational significance. Neurobiol Learn Mem, 150, 64-74. https://doi.org/10.1016/j.nlm.2018.03.001
Lingawi, N. W., Westbrook, R. F., & Laurent, V. (2017). Extinction and Latent Inhibition Involve a Similar Form of Inhibitory Learning that is Stored in and Retrieved from the Infralimbic Cortex. Cereb Cortex, 27(12), 5547-5556.
Author response:
The following is the authors’ response to the current reviews.
Reviewer #4 (Public review):
Summary:
The authors demonstrate a computational rational design approach for developing RNA aptamers with improved binding to the Receptor Binding Domain (RBD) of the SARS-CoV-2 spike protein. They demonstrate the ability of their approach to improve binding affinity using a previously identified RNA aptamer, RBD-PB6-Ta, which binds to the RBD. They also computationally estimate the binding energies of various RNA aptamers with the RBD and compare against RBD binding energies for a few neutralizing antibodies from the literature. Finally, experimental binding affinities are estimated by electrophoretic mobility shift assays (EMSA) for various RNA aptamers and a single commercially available neutralizing antibody to support the conclusions from computational studies on binding. The authors conclude that their computational framework, CAAMO, can provide reliable structure predictions and effectively support rational design of improved affinity for RNA aptamers towards target proteins. Additionally, they claim that their approach achieved design of high affinity RNA aptamer variants that bind to the RBD as well or better than a commercially available neutralizing antibody.
Strengths:
The thorough computational approaches employed in the study provide solid evidence of the value of their approach for computational design of high affinity RNA aptamers. The theoretical analysis using Free Energy Perturbation (FEP) to estimate relative binding energies supports the claimed improvement of affinity for RNA aptamers and provides valuable insight into the binding model for the tested RNA aptamers in comparison to previously studied neutralizing antibodies. The multimodal structure prediction in the early stages of the presented CAAMO framework, combined with the demonstrated outcome of improved affinity using the structural predictions as a starting point for rational design, provide moderate confidence in the structure predictions.
We thank the reviewer for this accurate summary and for recognizing the strength of our integrated computational–experimental workflow in improving aptamer affinity.
Weaknesses:
The experimental characterization of RBD affinities for the antibody and RNA aptamers in this study present serious concerns regarding the methods used and the data presented in the manuscript, which call into question the major conclusions regarding affinity towards the RBD for their aptamers compared to antibodies. The claim that structural predictions from CAAMO are reasonable is rational, but this claim would be significantly strengthened by experimental validation of the structure (i.e. by chemical footprinting or solving the RBD-aptamer complex structure).
The conclusions in this work are somewhat supported by the data, but there are significant issues with experimental methods that limit the strength of the study's conclusions.
(1) The EMSA experiments have a number of flaws that limit their interpretability. The uncropped electrophoresis images, which should include molecular size markers and/or positive and negative controls for bound and unbound complex components to support interpretation of mobility shifts, are not presented. In fact, a spliced image can be seen for Figure 4E, which limits interpretation without the full uncropped image.
Thank you for your valuable comments and careful review.
In response to your suggestion, we will provide all uncropped electrophoresis raw images corresponding to the results in the main figures and supplementary figures (Figure 2F, 3D, 3E, 4E, S9A and S10 of the original manuscript) in the revised version. Regarding the spliced image in Figure 4E, the uncropped raw gel image clearly shows that the two C23U samples were run on an adjacent lane of the same gel due to the total number of samples exceeding the well capacity of a single lane. All samples were electrophoresed and signal-detected under identical experimental conditions in one single experiment, ensuring the validity of direct signal intensity comparison across all samples. These complete uncropped raw images will be supplemented in the revised manuscript as Figure S12 (also see Author response image 1).
Author response image 1.
Uncropped electrophoresis images corresponding to Figures 2F, 3D, 3E, 4E, S9A and S10 of the original manuscript.
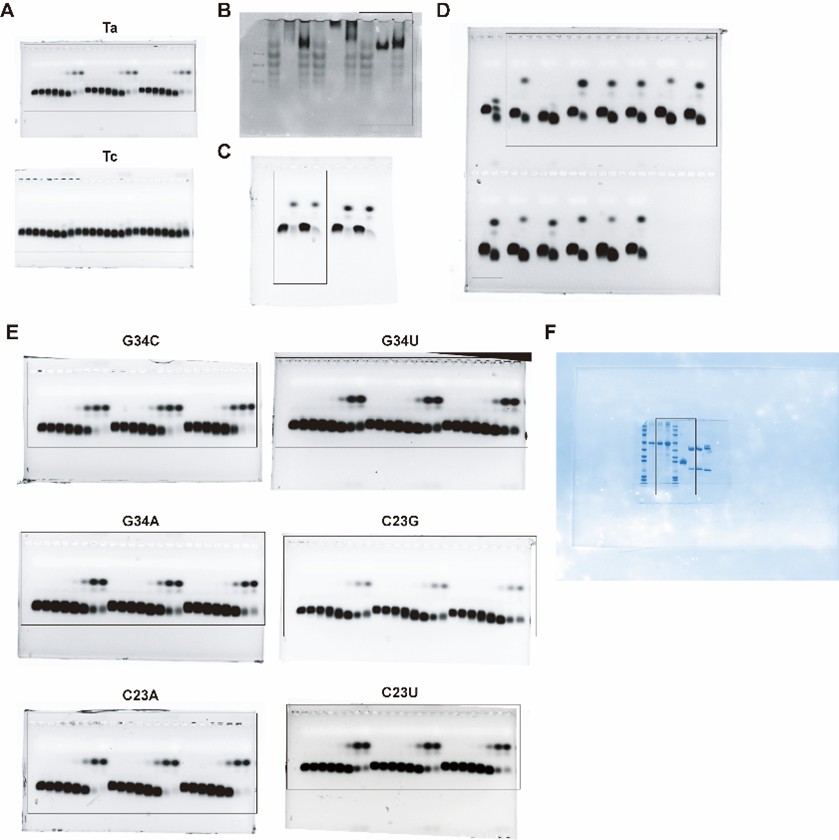
Additionally, he volumes of EMSA mixtures are not presented when a mass is stated (i.e. for the methods used to create Figure 3D), which leaves the reader without the critical parameter, molar concentration, and therefore leaves in question the claim that the tested antibody is high affinity under the tested conditions.
Thank you for your valuable comment on this oversight.
For the EMSA assay in Figure 3D, the reaction mixture (10 μL total volume) contained 3 μg of RBD protein and 3 μg of antibody (40592-R001), either individually or in combination, with incubation at room temperature for 20 minutes. Based on the molecular weights (35 kDa for RBD and 150 kDa for the IgG antibody), the corresponding molar concentrations in the mixture were calculated as 8.57 μM for RBD and 2 μM for the antibody. To ensure consistency, clarity and provide the critical molar concentration parameter, we will revise the legend of Figure 3D, replacing the mass values with the calculated molar concentrations as you suggested in the revised manuscript.
Additionally, protein should be visualized in all gels as a control to ensure that lack of shifts is not due to absence/aggregation/degradation of the RBD protein. In the case of Figure 3E, for example, it can be seen that there are degradation products included in the RBD-only lane, introducing a reasonable doubt that the lack of a shift in RNA tests (i.e. Figure 2F) is conclusively due to a lack of binding.
We sincerely appreciate your careful evaluation of our work, which helps us further clarify the experimental details and data reliability.
First, we would like to clarify the nature of the gel electrophoresis in Figure 3E: the RBD protein was separated by native-PAGE rather than denaturing SDS-PAGE. The RBD protein used in all experiments was purchased from HUABIO (Cat. No. HA210064) with guaranteed quality, and its integrity and purity were independently verified in our laboratory via denaturing SDS-PAGE (see Author response image 2), which showed a single, intact band without any degradation products. The ladder-like bands observed in the RBD-only lane of the native-PAGE gel are not a result of protein degradation. Instead, they arise from two well-characterized properties of recombinant SARS-CoV-2 Spike RBD protein expressed in human cells: intrinsic conformational heterogeneity (the RBD domain exists in multiple dynamic conformations due to its structural flexibility) (Cai et al., Science, 2020; Wrapp et al., Science, 2020) and heterogeneity in N-glycosylation modification (variable glycosylation patterns at the conserved N-glycosylation sites of RBD) (Casalino et al., ACS Cent. Sci., 2020; Ives et al., eLife, 2024), both of which could cause distinct migration bands in native-PAGE under non-denaturing conditions.
Second, to ensure the reliability of the RNA-binding results, the EMSA experiments for determining the binding affinity (K<sub>d</sub>) of RBD to Ta, Tc and Ta variants were performed with three independent biological replicates (the original manuscript includes all replicate data in Figure 2F and S9). Consistent results were obtained across all replicates, which effectively rules out false-negative outcomes caused by accidental absence or loss of functional RBD protein in the reaction system. In addition, our gel images (Figure 2F and S9 in the original manuscript) and uncropped raw images of all EMSA gels (see Author response image 1) show no significant signal accumulation in the sample wells, confirming the absence of RBD protein aggregation in the binding reactions—an issue that would otherwise interfere with RNA-protein interaction and band shift detection.
New results for RBD analysis by denaturing SDS-PAGE, along with the associated discussion, will be added to the revised manuscript as Figure S10 (also see Author response image 2).
Author response image 2.
SDS-PAGE analysis of the SARS-CoV-2 Spike RBD protein, neutralizing antibody (40592-R001) and BSA reference. This gel validates the high purity and structural integrity of the commercially sourced RBD protein and neutralizing antibody used in this study.
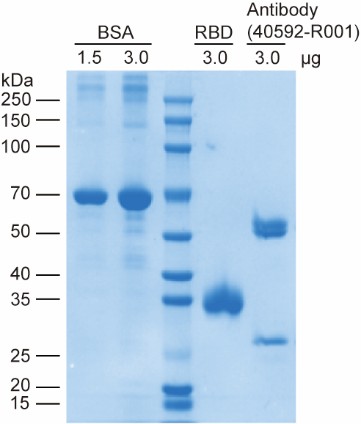
References
Cai, Y. et al. Distinct conformational states of SARS-CoV-2 spike proteins. Science 369, 1586-1592 (2020).
Casalino, L. et al. Beyond shielding: the roles of glycans in the SARS-CoV-2 spike protein. ACS Cent. Sci. 6, 1722-1734 (2020).
Ives, C.M. et al. Role of N343 glycosylation on the SARS-CoV-2 S RBD structure and co-receptor binding across variants of concern. eLife 13, RP95708 (2024).
Wrapp, D. et al. Cryo-EM structure of the 2019-nCoV spike in the prefusion conformation. Science 367, 1260-1263 (2020).
Finally, there is no control for nonspecific binding, such as BSA or another non-target protein, which fails to eliminate the possibility of nonspecific interactions between their designed aptamers and proteins in general. A nonspecific binding control should be included in all EMSA experiments.
Thank you for this constructive comment.
Following your recommendation, we are currently supplementing the EMSA assays with BSA as a non-target protein control to rigorously exclude potential non-specific binding between our designed aptamers (Ta and Ta variants) and exogenous proteins. These additional experiments are designed to directly assess whether the aptamers exhibit unintended interactions with unrelated proteins and to further validate the protein specificity of the RBD–aptamer interaction observed in our study.
The resulting nonspecific binding control data will be formally incorporated into the revised manuscript as Figure S11, and the corresponding Results and Discussion sections will be updated accordingly to reflect this critical validation once the experiments are completed.
(2) The evidence supporting claims of better binding to RBD by the aptamer compared to the commercial antibody is flawed at best. The commercial antibody product page indicates an affinity in low nanomolar range, whereas the fitted values they found for the aptamers in their study are orders of magnitude higher at tens of micromolar. Moreover, the methods section is lacking in the details required to appropriately interpret the competitive binding experiments. With a relatively short 20-minute equilibration time, the order of when the aptamer is added versus the antibody makes a difference in which is apparently bound. The issue with this becomes apparent with the lack of internal consistency in the presented results, namely in comparing Fig 3E (which shows no interference of Ta binding with 5uM antibody) and Fig 5D (which shows interference of Ta binding with 0.67-1.67uM antibody). The discrepancy between these figures calls into question the methods used, and it necessitates more details regarding experimental methods used in this manuscript.
Thank you for your insightful comments, which have helped us refine the rigor of our study. We address each of your concerns in detail below:
First, we agree with your observation that the commercial neutralizing antibody (Sino Biological, Cat# 40592-R001) is reported to bind Spike RBD with low nanomolar affinity on its product page. However, this discrepancy in affinity values (nanomolar vs. micromolar) stems from the use of distinct analytical methods. The product page affinity was determined via the Octet RED System, a technique analogous to Surface Plasmon Resonance (SPR) that offers high sensitivity for kinetic and affinity measurements. In contrast, our study employed EMSA, a method primarily optimized for semi-quantitative assessment of binding interactions. The inherent differences in sensitivity and principle between these two techniques—with Octet RED System enabling real-time monitoring of biomolecular interactions and EMSA relying on gel separation—account for the observed variation in affinity values.
Second, regarding the competitive binding experiments, we appreciate your note on the critical role of reagent addition order and equilibration time. To eliminate potential biases from sequential addition, we clarify that Cy3-labeled RNAs, RBD proteins, and the neutralizing antibody were added simultaneously to the reaction system. We will revise the Methods section in the revised manuscript to provide a detailed protocol for the EMSA experiments, to ensure full reproducibility and appropriate interpretation of the results.
Third, we acknowledge and apologize for a critical error in the figure legends of Figure 3E: the concentrations reported (5 μM aptamer and antibody 40592-R001) refer to stock solutions, not the final concentrations in the EMSA reaction mixture. The correct final concentrations are 0.5 μM for aptamer Ta, and 0.5 μM for the antibody. This correction resolves the apparent inconsistency between Figure 3E and Figure 5D, as the final antibody concentration in Figure 3E is now consistent with the concentration range used in Figure 5D. We will update the figure legends for Figure 3E and revise the Methods section to explicitly distinguish between stock and final reaction concentrations, ensuring clarity and internal consistency of the results.
We sincerely thank you for highlighting these issues, which will prompt important revisions to improve the clarity, accuracy, and rigor of our manuscript.
(3) The utility of the approach for increasing affinity of RNA aptamers for their targets is well supported through computational and experimental techniques demonstrating relative improvements in binding affinity for their G34C variant compared to the starting Ta aptamer. While the EMSA experiments do have significant flaws, the observations of relative relationships in equilibrium binding affinities among the tested aptamer variants can be interpreted with reasonable confidence, given that they were all performed in a consistent manner.
We sincerely appreciate your valuable concerns and constructive feedback, which have greatly facilitated the improvement of our manuscript. Regarding the flaws of the EMSA experiments you pointed out, we have provided a detailed response to clarify the related issues and supplemented necessary experimental details to enhance the rigor and reproducibility of our work (see corresponding response above). It is worth noting that EMSA remains a classic and widely used technique for studying biomolecular interactions, and its reliability in qualitative and semi-quantitative analysis of binding events has been well recognized in the field. Furthermore, we fully agree with and are grateful for your view that, since all tested aptamer variants were analyzed using a consistent experimental protocol, the observations on the relative relationships of their equilibrium binding affinities can be interpreted with reasonable confidence. This recognition reinforces the validity of the relative affinity improvements we observed for the G34C variant compared to the parental Ta aptamer, which is a key finding of our study.
(4) The claim that the structure of the RBD-Aptamer complex predicted by the CAAMO pipeline is reliable is tenuous. The success of their rational design approach based on the structure predicted by several ensemble approaches supports the interpretation of the predicted structure as reasonable, however, no experimental validation is undertaken to assess the accuracy of the structure. This is not a main focus of the manuscript, given the applied nature of the study to identify Ta variants with improved binding affinity, however the structural accuracy claim is not strongly supported without experimental validation (i.e. chemical footprinting methods).
We thank the reviewer for this comment and agree that experimental validation would be required to establish the structural accuracy of the predicted RBD–aptamer complex. We note, however, that the primary aim of this study is not structural determination, but the development of a general computational framework for aptamer affinity maturation. In most practical applications, experimentally resolved structures of aptamer–protein complexes are unavailable. Accordingly, CAAMO is designed to operate under such conditions, using computationally generated binding models as working hypotheses to guide rational optimization rather than as definitive structural descriptions. In this context, the predicted structure is evaluated by its utility for affinity improvement, rather than by direct structural validation. We will revise the manuscript accordingly to further clarify this scope.
(5) Throughout the manuscript, the phrasing of "all tested antibodies" was used, despite there being only one tested antibody in experimental methods and three distinct antibodies in computational methods. While this concern is focused on specific language, the major conclusion that their designed aptamers are as good or better than neutralizing antibodies in general is weakened by only testing only three antibodies through computational binding measurements and a fourth single antibody for experimental testing. The contact residue mapping furthermore lacks clarity in the number of structures that were used, with a vague description of structures from the PDB including no accession numbers provided nor how many distinct antibodies were included for contact residue mapping.
We thank the reviewer for this important comment regarding language precision, experimental scope, and clarity of the antibody dataset used in this study. We agree that the phrase “all tested antibodies” was imprecise and could lead to overgeneralization. We will carefully revise the manuscript to use more accurate and explicit wording throughout, clearly distinguishing between experimentally tested antibodies, computationally analyzed antibodies, and antibody structures used for large-scale contact analysis.
Specifically, the experimental comparison in this study was performed using one commercially available SARS-CoV-2 neutralizing antibody, whereas free energy–based computational analyses were conducted on three representative neutralizing antibodies with available structural data. We will revise the manuscript to explicitly state these distinctions and avoid general statements referring to neutralizing antibodies as a class.
Importantly, the residue-level contact frequency analysis was not based solely on these individual antibodies. Instead, this analysis leveraged a comprehensive set of experimentally resolved SARS-CoV-2 RBD–antibody complex structures curated from the Coronavirus Antibody Database (CoV-AbDab), a publicly available and actively maintained resource developed by the Oxford Protein Informatics Group. CoV-AbDab aggregates all published coronavirus-binding antibodies with associated PDB structures and provides a systematic and unbiased structural foundation for antibody–RBD interaction analysis. All available high-resolution RBD–antibody complex structures indexed in CoV-AbDab at the time of analysis were included to compute contact residue frequencies across the structural ensemble. We will explicitly state this data source, clarify the number and nature of structures used, and add the appropriate citation (Raybould et al., Bioinformatics, 2021, doi: 10.1093/bioinformatics/btaa739).
Finally, we will revise the conclusions to avoid claims that extend beyond the scope of the data. The comparison between aptamers and antibodies is now framed in terms of representative antibodies and consensus interaction patterns derived from a large structural ensemble, rather than as a general statement about all neutralizing antibodies. These revisions will improve the clarity, rigor, and reproducibility of the manuscript, while preserving the core conclusion that the CAAMO framework enables effective structure-guided affinity maturation of RNA aptamers.
Overall, the manuscript by Yang et al presents a valuable tool for rational design of improved RNA aptamer binding affinity toward target proteins, which the authors call CAAMO. Notably, the method is not intended for de novo design, but rather as a tool for improving aptamers that have been selected for binding affinity by other methods such as SELEX. While there are significant issues in the conclusions made from experiments in this manuscript, the relative relationships of observed affinities within this study provide solid evidence that the CAAMO framework provides a valuable tool for researchers seeking to use rational design approaches for RNA aptamer affinity maturation.
The following is the authors’ response to the original reviews.
Public Reviews:
Reviewer #1 (Public review):
Summary:
In this study, the authors attempt to devise general rules for aptamer design based on structure and sequence features. The main system they are testing is an aptamer targeting a viral sequence.
Strengths:
The method combines a series of well-established protocols, including docking, MD, and a lot of system-specific knowledge, to design several new versions of the Ta aptamer with improved binding affinity.
We thank the reviewer for this accurate summary and for recognizing the strength of our integrated computational–experimental workflow in improving aptamer affinity.
Weaknesses:
The approach requires a lot of existing knowledge and, importantly, an already known aptamer, which presumably was found with SELEX. In addition, although the aptamer may have a stronger binding affinity, it is not clear if any of it has any additional useful properties such as stability, etc.
Thanks for these critical comments.
(1) On the reliance on a known aptamer: We agree that our CAAMO framework is designed as a post-SELEX optimization platform rather than a tool for de novo discovery. Its primary utility lies in rationally enhancing the affinity of existing aptamers that may not yet be sequence-optimal, thereby complementing experimental technologies such as SELEX. The following has been added to “Introduction” of the revised manuscript. (Page 5, line 108 in the revised manuscript)
‘Rather than serving as a de novo aptamer discovery tool, CAAMO is designed as a post-SELEX optimization platform that rationally improves the binding capability of existing aptamers.’
(2) On stability and developability: We also appreciate the reviewer’s important reminder that affinity alone is not sufficient for therapeutic development. We acknowledge that the present study has focused mainly on affinity optimization, and properties such as nuclease resistance, structural stability, and overall developability were not evaluated. The following has been added to “Discussion and conclusion” of the revised manuscript. (Page 25, line 595 in the revised manuscript)
‘While the present study primarily focused on affinity optimization, we acknowledge that other key developability traits—such as nuclease resistance, structural and thermodynamic stability, and in vivo persistence—are equally critical for advancing aptamers toward therapeutic applications. These properties were not evaluated here but will be systematically addressed in future iterations of the CAAMO framework to enable comprehensive optimization of aptamer candidates.’
Reviewer #2 (Public review):
Summary:
This manuscript proposes a workflow for discovering and optimizing RNA aptamers, with application in the optimization of a SARS-CoV-2 RBD. The authors took a previously identified RNA aptamer, computationally docked it into one specific RBD structure, and searched for variants with higher predicted affinity. The variants were subsequently tested for RBD binding using gel retardation assays and competition with antibodies, and one was found to be a stronger binder by about three-fold than the founding aptamer.
Overall, this would be an interesting study if it were performed with truly high-affinity aptamers, and specificity was shown for RBD or several RBD variants.
Strengths:
The computational workflow appears to mostly correctly find stronger binders, though not de novo binders.
We thank the reviewer for the clear summary and for acknowledging that our workflow effectively prioritizes stronger binders.
Weaknesses:
(1) Antibody competition assays are reported with RBD at 40 µM, aptamer at 5 µM, and a titration of antibody between 0 and 1.2 µg. This approach does not make sense. The antibody concentration should be reported in µM. An estimation of the concentration is 0-8 pmol (from 0-1.2 µg), but that's not a concentration, so it is unknown whether enough antibody molecules were present to saturate all RBD molecules, let alone whether they could have displaced all aptamers.
Thanks for your insightful comment. We have calculated that 0–1.2 µg antibody corresponds to a final concentration range of 0–1.6 µM (see Author response image 1). In practice, 1.2 µg was the maximum amount of commercial antibody that could be added under the conditions of our assay. In the revised manuscript, all antibody amounts previously reported in µg have been converted to their corresponding molar concentrations in Fig. 1F and Fig. 5D. In addition, the exact antibody concentrations used in the EMSA assays are now explicitly stated in the Materials and Methods section under “EMSA experiments.” The following has been added to “EMSA experiments” of the revised manuscript. (Page 30 in the revised manuscript)
‘For competitive binding experiments, 40 μM of RBP proteins, 5 μM of annealed Cy3-labelled RNAs and increasing concentrations of SARS-CoV-2 neutralizing antibody 40592-R001 (0–1.67 μM) were mixed in the EMSA buffer and incubated at room temperature for 20 min.’
Author response image 1.
Estimation of antibody concentration. Assuming a molecular weight of 150 kDa, dissolving 1.2 µg of antibody in a 5 µL reaction volume results in a final concentration of 1.6 µM.
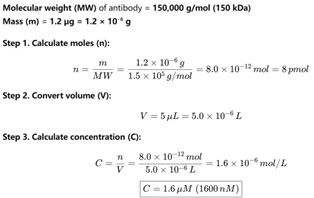
As shown in Figure 5D, the purpose of the antibody–aptamer competition assay was not to achieve full saturation but rather to compare the relative competitive binding of the optimized aptamer (Ta<sup>G34C</sup>) versus the parental aptamer (Ta). Molecular interactions at this scale represent a dynamic equilibrium of binding and dissociation. While the antibody concentration may not have been sufficient to saturate all available RBD molecules, the experimental results clearly reveal the competitive binding behavior that distinguishes the two aptamers. Specifically, two consistent trends emerged:
(1) Across all antibody concentrations, the free RNA band for Ta was stronger than that of Ta<sup>G34C</sup>, while the RBD–RNA complex band of the latter was significantly stronger, indicating that Ta<sup>G34C</sup> bound more strongly to RBD.
(2) For Ta, increasing antibody concentration progressively reduced the RBD–RNA complex band, consistent with antibody displacing the aptamer. In contrast, for Ta<sup>G34C</sup>, the RBD–RNA complex band remained largely unchanged across all tested antibody concentrations, suggesting that the antibody was insufficient to displace Ta<sup>G34C</sup> from the complex.
Together, these observations support the conclusion that Ta<sup>G34C</sup> exhibits markedly stronger binding to RBD than the parental Ta aptamer, in line with the predictions and objectives of our CAAMO optimization framework.
(2) These are not by any means high-affinity aptamers. The starting sequence has an estimated (not measured, since the titration is incomplete) K<sub>d</sub> of 110 µM. That's really the same as non-specific binding for an interaction between an RNA and a protein. This makes the title of the manuscript misleading. No high-affinity aptamer is presented in this study. If the docking truly presented a bound conformation of an aptamer to a protein, a sub-micromolar K<sub>d</sub> would be expected, based on the number of interactions that they make.
In fact, our starting sequence (Ta) is a high-affinity aptamer, and then the optimized sequences (such as Ta<sup>G34C</sup>) with enhanced affinity are undoubtedly also high-affinity aptamers. See descriptions below:
(1) Origin and prior characterization of Ta. The starting aptamer Ta (referred to as RBD-PB6-Ta in the original publication by Valero et al., PNAS 2021, doi:10.1073/pnas.2112942118) was selected through multiple positive rounds of SELEX against SARS-CoV-2 RBD, together with counter-selection steps to eliminate non-specific binders. In that study, Ta was reported to bind RBD with an IC₅₀ of ~200 nM as measured by biolayer interferometry (BLI), supporting its high affinity and specificity. The following has been added to “Introduction” of the revised manuscript. (Page 4 in the revised manuscript)
‘This aptamer was originally identified through SELEX and subsequently validated using surface plasmon resonance (SPR) and biolayer interferometry (BLI), which confirmed its high affinity (sub-nanomolar) and high specificity toward the RBD. Therefore, Ta provides a well-characterized and biologically relevant starting point for structure-based optimization.’
(2) Methodological differences between EMSA and BLI measurements. We acknowledge that the discrepancy between our obtained binding affinity (K<sub>d</sub> = 110 µM) and the previously reported one (IC<sub>50</sub> ~ 200 nM) for the same Ta sequence arises primarily from methodological and experimental differences between EMSA and BLI. Namely, different experimental measurement methods can yield varied binding affinity values. While EMSA may have relatively low measurement precision, its relatively simple procedures were the primary reason for its selection in this study. Particularly, our framework (CAAMO) is designed not as a tool for absolute affinity determination, but as a post-SELEX optimization platform that prioritizes relative changes in binding affinity under a consistent experimental setup. Thus, the central aim of our work is to demonstrate that CAAMO can reliably identify variants, such as Ta<sup>G34C</sup>, that bind more strongly than the parental sequence under identical assay conditions. The following has been added to “Discussion and conclusion” of the revised manuscript. (Page 24 in the revised manuscript)
‘Although the absolute K<sub>d</sub> values determined by EMSA cannot be directly compared with surface-based methods such as SPR or BLI, the relative affinity trends remain highly consistent. While EMSA provides semi-quantitative affinity estimates, the close agreement between experimental EMSA trends and FEP-calculated ΔΔG values supports the robustness of the relative affinity changes reported here. In future studies, additional orthogonal biophysical techniques (e.g., filter-binding, SPR, or BLI) will be employed to further validate and refine the protein–aptamer interaction models.’
(3) Evidence of specific binding in our assays. We emphasize that the binding observed in our EMSA experiments reflects genuine aptamer–protein interactions. As shown in Figure 2G, a control RNA (Tc) exhibited no detectable binding to RBD, whereas Ta produced a clear binding curve, confirming that the interaction is specific rather than non-specific.
(3) The binding energies estimated from calculations and those obtained from the gel-shift experiments are vastly different, as calculated from the K<sub>d</sub> measurements, making them useless for comparison, except for estimating relative affinities.
Author Reply: We thank the reviewer for raising this important point. CAAMO was developed as a post-SELEX optimization tool with the explicit goal of predicting relative affinity changes (ΔΔG) rather than absolute binding free energies (ΔG). Empirically, CAAMO correctly predicted the direction of affinity change for 5 out of 6 designed variants (e.g., ΔΔG < 0 indicates enhanced binding free energy relative to WT); such predictive power for relative ranking is highly valuable for prioritizing candidates for experimental testing. Our prior work on RNA–protein interactions likewise supports the reliability of relative affinity predictions (see: Nat Commun 2023, doi:10.1038/s41467-023-39410-8). The following has been added to “Discussion and conclusion” of the revised manuscript. (Page 24 in the revised manuscript)
‘While EMSA provides semi-quantitative affinity estimates, the close agreement between experimental EMSA trends and FEP-calculated ΔΔG values supports the robustness of the relative affinity changes reported here.’
Recommendations for the Authors:
Reviewer #1 (Recommendations for the authors)
(1) Overall, the paper is well-written and, in the opinion of this reviewer, could remain as it is.
We thank the reviewer for the positive evaluation and supportive comments regarding our manuscript. We are grateful for the endorsement of its quality and suitability for publication.
Reviewer #2 (Recommendations for the authors)
(1) All molecules present in experiments need to be reported with their final concentrations (not µg).
We thank the reviewer for raising this important point. In the revised manuscript, all antibody amounts previously reported in µg have been converted to their corresponding molar concentrations in Fig. 1F and Fig. 5D. In addition, the exact antibody concentrations used in the EMSA assays are now explicitly stated in the Materials and Methods section under “EMSA experiments.” The following has been added to “EMSA experiments” of the revised manuscript. (Page 30 in the revised manuscript)
‘For competitive binding experiments, 40 μM of RBP proteins, 5 μM of annealed Cy3-labelled RNAs and increasing concentrations of SARS-CoV-2 neutralizing antibody 40592-R001 (0–1.67 μM) were mixed in the EMSA buffer and incubated at room temperature for 20 min.’
(2) An independent K<sub>d</sub> measurement, for example, using a filter binding assay, would greatly strengthen the results.
We thank the reviewer for this constructive suggestion and agree that an orthogonal biophysical measurement (e.g., a filter-binding assay, SPR or BLI) would further strengthen confidence in the reported dissociation constants. Unfortunately, all available SARS-CoV-2 RBD protein used in this study has been fully consumed and, due to current supply limitations, we were unable to perform new orthogonal binding experiments for the revised manuscript. We regret this limitation and have documented it in the Discussion as an item for future work.
Importantly, although we could not perform a new filter-binding experiment at this stage, we have multiple independent lines of evidence that support the reliability of the EMSA-derived affinity trends reported in the manuscript:
(1) Rigorous EMSA design and reproducibility. All EMSA binding curves reported in the manuscript (e.g., Figs. 2F–G, 4E–F, 5A and Fig. S9) are derived from three independent biological replicates and include standard deviations; the measured binding curves show good reproducibility across replicates.
(2) Appropriate positive and negative controls. Our gel assays include clear internal controls. The literature-reported strong binder Ta forms a distinct aptamer–RBD complex band under our conditions, whereas the negative-control aptamer Tc shows no detectable binding under identical conditions (see Fig. 2F). These controls demonstrate that the EMSA system discriminates specific from non-binding sequences with high sensitivity.
(3) Orthogonal computational validation (FEP) that agrees with experiment. The central strength of the CAAMO framework is the integration of rigorous physics-based calculations with experiments. We performed FEP calculations for the selected single-nucleotide mutations and computed ΔΔG values for each mutant. The direction and rank order of binding changes predicted by FEP are in good agreement with the EMSA measurements: five of six FEP-predicted improved mutants (Ta<sup>G34C</sup>, Ta<sup>G34U</sup>, Ta<sup>G34A</sup>, Ta<sup>C23A</sup>, Ta<sup>C23U</sup>) were experimentally confirmed to have stronger apparent affinity than wild-type Ta (see Fig. 4D–F, Table S2), yielding a success rate of 83%. The concordance between an independent, rigorous computational method and our experimental measurements provides strong mutual validation.
(4) Independent competitive binding experiments. We additionally performed competitive EMSA assays against a commercial neutralizing monoclonal antibody (40592-R001). These competition experiments show that Ta<sup>G34C</sup>–RBD complexes are resistant to antibody displacement under conditions that partially displace the wild-type Ta–RBD complex (see Fig. 5D). This result provides an independent, functionally relevant line of evidence that Ta<sup>G34C</sup> binds RBD with substantially higher affinity and specificity than WT Ta under our assay conditions.
Given these multiple, independent lines of validation (rigorous EMSA replicates and controls, FEP agreement, and antibody competition assays), we are confident that the relative affinity improvements reported in the manuscript are robust, even though the absolute K<sub>d</sub> values measured by EMSA are not directly comparable to surface-based methods (EMSA typically reports larger apparent K<sub>d</sub> values than SPR/BLI due to methodological differences). The following has been added to “Discussion and conclusion” of the revised manuscript. (Page 24 in the revised manuscript)
‘Although the absolute K<sub>d</sub> values determined by EMSA cannot be directly compared with surface-based methods such as SPR or BLI, the relative affinity trends remain highly consistent. While EMSA provides semi-quantitative affinity estimates, the close agreement between experimental EMSA trends and FEP-calculated ΔΔG values supports the robustness of the relative affinity changes reported here. In future studies, additional orthogonal biophysical techniques (e.g., filter-binding, SPR, or BLI) will be employed to further validate and refine the protein–aptamer interaction models.’
(3) The project would really benefit from a different aptamer-target system. Starting with a 100 µM aptamer is really not adequate.
We thank the reviewer for this important suggestion and for highlighting the value of testing the CAAMO framework in additional aptamer–target systems.
First, we wish to clarify the rationale for selecting the Ta–RBD system as the proof-of-concept. The Ta aptamer is not an arbitrary or weak binder: it was originally identified by independent SELEX experiments and subsequently validated by rigorous biophysical assays (SPR and BLI) (see: Proc. Natl. Acad. Sci. 2021, doi: 10.1073/pnas.2112942118). That study confirmed that Ta exhibits high-affinity and high-specificity binding to the SARS-CoV-2 RBD, which is why it serves as a well-characterized and biologically relevant system for method validation and optimization. We have added a brief clarification to the “Introduction” to emphasize these points. The following has been added to “Introduction” of the revised manuscript. (Page 4 in the revised manuscript)
‘This aptamer was originally identified through SELEX and subsequently validated using surface plasmon resonance (SPR) and biolayer interferometry (BLI), which confirmed its high affinity and high specificity toward the RBD. Therefore, Ta provides a well-characterized and biologically relevant starting point for structure-based optimization.’
Second, we agree that apparent discrepancies in absolute K<sub>d</sub> values can arise from different experimental platforms. Surface-based methods (SPR/BLI) and gel-shift assays (EMSA) have distinct measurement principles; EMSA yields semi-quantitative, solution-phase, apparent K<sub>d</sub> values that are not directly comparable in absolute magnitude to surface-based measurements. Crucially, however, our study focuses on relative affinity change. EMSA is well suited for parallel, comparative measurements across multiple variants when all samples are assayed under identical conditions, and thus provides a reliable readout for ranking and validating designed mutations. We have added a short statement in the “Discussion and conclusion”. The following has been added to “Discussion and conclusion” of the revised manuscript. (Page 24 in the revised manuscript)
‘Although the absolute K<sub>d</sub> values determined by EMSA cannot be directly compared with surface-based methods such as SPR or BLI, the relative affinity trends remain highly consistent. While EMSA provides semi-quantitative affinity estimates, the close agreement between experimental EMSA trends and FEP-calculated ΔΔG values supports the robustness of the relative affinity changes reported here. In future studies, additional orthogonal biophysical techniques (e.g., filter-binding, SPR, or BLI) will be employed to further validate and refine the protein–aptamer interaction models.’
Third, and importantly, CAAMO is inherently generalizable. In addition to the Ta–RBD application presented here, we have already begun applying CAAMO to other aptamer–target systems. In particular, we have successfully deployed the framework in preliminary optimization studies of RNA aptamers targeting the epidermal growth factor receptor (EGFR) (see: Gastroenterology 2021, doi: 10.1053/j.gastro.2021.05.055) (see Author response image 2). These preliminary results support the transferability of the CAAMO pipeline beyond the SARS-CoV-2 RBD system. We have added a short statement in the “Discussion and conclusion”. The following has been added to “Discussion and conclusion” of the revised manuscript. (Page 259 in the revised manuscript)
‘In addition to the Ta–RBD system, the CAAMO framework itself is inherently generalizable. More work is currently underway to apply CAAMO to optimize aptamers targeting other therapeutically relevant proteins, such as the epidermal growth factor receptor (EGFR) [45], in order to further explore its potential for broader aptamer engineering.’
Author response image 2.
Overview of the predicted binding model of the EGFR–aptamer complex generated using the CAAMO framework.
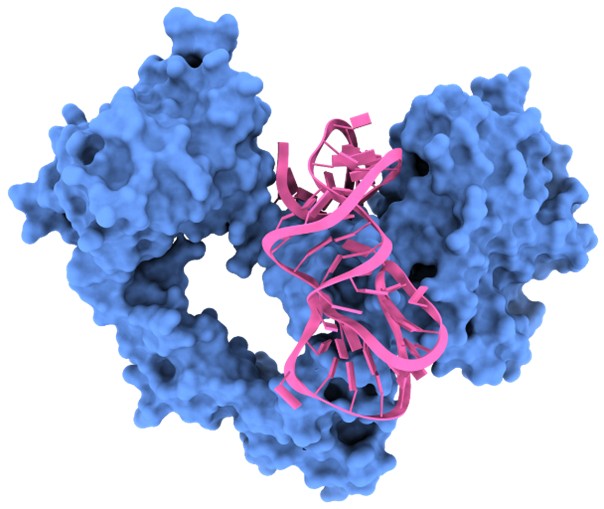
(4) Several RBD variants should be tested, as well as other proteins, for specificity. At such weak affinities, it is likely that these are non-specific binders.
We thank the reviewer for this important concern. Below we clarify the basis for selecting Ta and its engineered variants, summarize the experimental controls that address specificity, and present the extensive in silico variant analysis we performed to assess sensitivity and breadth of binding.
(1) Origin and validation of Ta. As noted in our response to “Comment (3)”, the Ta aptamer was not chosen arbitrarily. Ta was identified by independent SELEX with both positive and negative selection and subsequently validated using surface-based biophysical assays (SPR and BLI), which reported low-nanomolar affinity and high specificity for the SARS-CoV-2 RBD. Thus, Ta is a well-characterized, experimentally validated starting lead for method development and optimization.
(2) Experimental specificity controls. We appreciate the concern that weak apparent affinities can reflect non-specific binding. As noted in our response to “Comment (2)”, we applied multiple experimental controls that argue against non-specificity: (i) a literature-reported weak binder (Tc) was used as a negative control and produced no detectable complex under identical EMSA conditions (see Figs. 2F–G), demonstrating the assay’s ability to discriminate non-binders from specific binders; (ii) competitive EMSA assays with a commercial neutralizing monoclonal antibody (40592-R001) show that both Ta and Ta<sup>G34C</sup> engage the same or overlapping RBD site as the antibody, and that Ta<sup>G34C</sup> is substantially more resistant to antibody displacement than WT Ta (see Figs. 3D–E, 5D). Together, these wet-lab controls support that the observed aptamer-RBD bands reflect specific interactions rather than general, non-specific adsorption.
(3) Variant and specificity analysis by rigorous FEP calculations. To address the reviewer’s request to evaluate variant sensitivity, we performed extensive free energy perturbation combined with Hamiltonian replica-exchange molecular dynamics (FEP/HREX) for improved convergence efficiency and increased simulation time to estimate relative binding free energy changes (ΔΔG) of both WT Ta and the optimized Ta<sup>G34C</sup> against a panel of RBD variants. Results are provided in Tables S4 and S5. Representative findings include: For WT Ta versus early lineages, FEP reproduces the experimentally observed trends: Alpha (B.1.1.7; N501Y) yields ΔΔG<sub>FEP</sub> = −0.42 ± 0.07 kcal/mol (ΔΔG<sub>exp</sub> = −0.24), while Beta (B.1.351; K417N/E484K/N501Y) gives ΔΔG<sub>FEP</sub> = 0.64 ± 0.25 kcal/mol (ΔΔG<sub>exp</sub> = 0.36) (see Table S4). The agreement between the computational and experimental results supports the fidelity of our computational model for variant assessment. For the engineered Ta<sup>G34C</sup>, calculations across a broad panel of variants indicate that Ta<sup>G34C</sup> retains or improves binding (ΔΔG < 0) for the majority of tested variants, including Alpha, Beta, Gamma and many Omicron sublineages. Notable examples: BA.1 (ΔΔG = −3.00 ± 0.52 kcal/mol), BA.2 (ΔΔG = −2.54 ± 0.60 kcal/mol), BA.2.75 (ΔΔG = −5.03 ± 0.81 kcal/mol), XBB (ΔΔG = −3.13 ± 0.73 kcal/mol) and XBB.1.5 (ΔΔG = −2.28 ± 0.96 kcal/mol). A minority of other Omicron sublineages (e.g., BA.4 and BA.5) show modest positive ΔΔG values (2.11 ± 0.67 and 2.27 ± 0.68 kcal/mol, respectively), indicating a predicted reduction in affinity for those specific backgrounds. Overall, these data indicate that the designed Ta<sup>G34C</sup> aptamer can maintain its binding ability with most SARS-CoV-2 variants, showing potential for broad-spectrum antiviral activity (see Table S5). The following has been added to “Results” of the revised manuscript. (Page 22 in the revised manuscript)
‘2.6 Binding performance of Ta and Ta<sup>G34C</sup> against SARS-CoV-2 RBD variants
To further evaluate the binding performance and specificity of the designed aptamer Ta<sup>G34C</sup> toward various SARS-CoV-2 variants [39], we conducted extensive free energy perturbation combined with Hamiltonian replica-exchange molecular dynamics (FEP/HREX) [40–42] for both the wild-type aptamer Ta and the optimized Ta<sup>G34C</sup> against a series of RBD mutants. The representative variants include the early Alpha (B.1.1.7) and Beta (B.1.351) lineages, as well as a panel of Omicron sublineages (BA.1–BA.5, BA.2.75, BQ.1, XBB, XBB.1.5, EG.5.1, HK.3, JN.1, and KP.3) carrying multiple mutations within the RBD region (residues 333–527). For each variant, mutations within 5 Å of the bound aptamer were included in the FEP to accurately estimate the relative binding free energy change (ΔΔG).
For the wild-type Ta aptamer, the FEP-predicted binding affinities toward the Alpha and Beta RBD variants were consistent with the previous experimental results, further validating the reliability of our model (see Table S4). Specifically, Ta maintained comparable or slightly enhanced binding to the Alpha variant and showed only marginally reduced affinity for the Beta variant.
In contrast, the optimized aptamer Ta<sup>G34C</sup> exhibited markedly improved and broad-spectrum binding capability toward most tested variants (see Table S5). For early variants such as Alpha, Beta, and Gamma, Ta<sup>G34C</sup> maintained enhanced affinities (ΔΔG < 0). Notably, for multiple Omicron sublineages—including BA.1, BA.2, BA.2.12.1, BA.2.75, XBB, XBB.1.5, XBB.1.16, XBB.1.9, XBB.2.3, EG.5.1, XBB.1.5.70, HK.3, BA.2.86, JN.1 and JN.1.11.1—the calculated binding free energy changes ranged from −1.89 to −7.58 kcal/mol relative to the wild-type RBD, indicating substantially stronger interactions despite the accumulation of multiple mutations at the aptamer–RBD interface. Only in a few other Omicron sublineages, such as BA.4, BA.5, and KP.3, a slight reduction in binding affinity was observed (ΔΔG > 0).
These computational findings demonstrate that the Ta<sup>G34C</sup> aptamer not only preserves high affinity for the RBD but also exhibits improved tolerance to the extensive mutational landscape of SARS-CoV-2. Collectively, our results suggest that Ta<sup>G34C</sup> holds promise as a high-affinity and potentially cross-variant aptamer candidate for targeting diverse SARS-CoV-2 spike protein variants, showing potential for broad-spectrum antiviral activity.’
The following has been added to “Materials and Methods” of the revised manuscript. (Page 29 in the revised manuscript)
‘4.7 FEP/HREX
To evaluate the binding sensitivity of the optimized aptamer Ta<sup>G34C</sup> toward SARS-CoV-2 RBD variants, we employed free energy perturbation combined with Hamiltonian replica-exchange molecular dynamics (FEP/HREX) simulations for enhanced sampling efficiency and improved convergence. The relative binding free energy changes (ΔΔG) upon RBD mutations were estimated as:
ΔΔ𝐺 = Δ𝐺<sub>bound</sub> − Δ𝐺<sub>free</sub>
where ΔG<sub>bound</sub> and ΔG<sub>free</sub> represent the RBD mutations-induced free energy changes in the complexed and unbound states, respectively. All simulations were performed using GROMACS 2021.5 with the Amber ff14SB force field. For each mutation, dual-topology structures were generated in a pmx-like manner, and 32 λ-windows (0.0, 0.01, 0.02, 0.03, 0.06, 0.09, 0.12, 0.16, 0.20, 0.24, 0.28, 0.32, 0.36, 0.40, 0.44, 0.48, 0.52, 0.56, 0.60, 0.64, 0.68, 0.72, 0.76, 0.80, 0.84, 0.88, 0.91, 0.94, 0.97, 0.98, 0.99, 1.0) were distributed uniformly between 0.0 and 1.0. To ensure sufficient sampling, each window was simulated for 5 ns, with five independent replicas initiated from distinct velocity seeds. Replica exchange between adjacent λ states was attempted every 1 ps to enhance phase-space overlap and sampling convergence. The van der Waals and electrostatic transformations were performed simultaneously, employing a soft-core potential (α = 0.3) to avoid singularities. For each RBD variant system, this setup resulted in an accumulated simulation time of approximately 1600 ns (5 ns × 32 windows × 5 replicas × 2 states). The Gromacs bar analysis tool was used to estimate the binding free energy changes.’
Tables S4 and S5 have been added to Supplementary Information of the revised manuscript.
Synthèse : "Braver l'ombre, nos vies après le harcèlement"
Ce document analyse les dynamiques complexes du harcèlement scolaire en s'appuyant sur les témoignages croisés d'Anna, une jeune femme victime de harcèlement sévère, et de Zacharie, un ancien harceleur.
Il explore les motivations profondes derrière les actes de harcèlement, notamment la quête de statut social et la peur d'être soi-même une victime, souvent déclenchés par la perception d'une "différence" chez la cible.
L'analyse met en lumière les conséquences dévastatrices et durables pour la victime, incluant des traumatismes psychologiques profonds, l'anxiété chronique, des troubles du comportement et une perte d'estime de soi.
Parallèlement, elle retrace le parcours de l'auteur, de la recherche d'une réputation à une prise de conscience tardive, suivie d'un besoin de réparation.
Le rôle crucial, et souvent défaillant, des adultes et des institutions scolaires est examiné, soulignant leur incapacité à identifier, comprendre et gérer adéquatement les situations.
Enfin, le document se conclut sur les thèmes de la reconstruction personnelle et du potentiel de la justice restaurative, incarnée par la rencontre entre Anna et Zacharie, comme voie vers la guérison et la compréhension mutuelle.
Anna est décrite comme une jeune fille initialement « très enjouée » et « curieuse », mais marquée dès l'enfance par une anxiété profonde.
Cette anxiété, ressentie dès le CM1, la plaçait déjà en décalage avec ses pairs. Son parcours illustre l'escalade et les effets à long terme du harcèlement.
• Nature du harcèlement : Le harcèlement commence par des moqueries dès la 6ème, s'intensifie brutalement en 4ème pour devenir quotidien et violent. Il prend plusieurs formes :
◦ Psychologique : Moqueries constantes sur son apparence (« castor », « cheval »), sa dentition, son style vestimentaire et son comportement. Insultes quotidiennes : « tu es vraiment moche », « tu pues », « va te pendre », « crève ».
◦ Social : Isolement complet, y compris de la part de ses amis qui, par peur, se joignent aux harceleurs.
◦ Physique : Elle reçoit un coup de coude violent dans le dos, la faisant s'effondrer en larmes.
◦ Institutionnel : Une professeure en 3ème participe activement à son humiliation publique, se moquant de ses problèmes d'anxiété et de sommeil devant toute la classe, provoquant un sentiment d'humiliation constant et une perte totale de repères.
• Conséquences : Les répercussions du harcèlement sur Anna sont profondes et multidimensionnelles.
◦ Traumatismes : Elle souffre de traumatismes si sévères qu'elle n'a « zéro souvenir » de son année de 5ème. Elle développe une phobie scolaire, décrivant l'entrée au collège comme une « angoisse qui me prenait tellement fort ».
◦ Santé mentale et physique : Elle développe des troubles anxieux majeurs, des crises de panique, des troubles du sommeil, des troubles alimentaires et recourt à l'automutilation (« me gratter, à me couper volontairement ou à me brûler ») pour gérer un « surplus d'émotion ».
Elle exprime avoir perdu toute raison de vivre.
◦ Séquelles durables : Adulte, elle vit avec une peur constante du jugement, interprétant le moindre rire dans la rue comme une moquerie dirigée contre elle.
Elle lutte pour reconstruire son estime de soi et apprend à « s'apprécier sur des petits points ».
Zacharie, surnommé « le malaimé » dans son enfance, était un enfant « turbulent » cherchant à se faire remarquer.
Son parcours révèle comment la quête d'une place dans la hiérarchie sociale peut mener au harcèlement.
• Motivations : Ses actions sont motivées par un désir profond d'exister et d'appartenir aux « classes dominantes de la cour de récréation ».
Il explique : « Je voulais pas être quelqu'un qui se faisait dominer, je voulais être quelqu'un qui était reconnu ».
Le harcèlement devient un outil pour se forger une réputation de « mauvais garçon » et s'assurer qu'on ne l'« embête pas ».
Il admet que le comportement d'un professeur en CM1, qui utilisait l'humiliation, a contribué à normaliser ce type de violence.
• Actes de harcèlement : Il commence à harceler activement à la fin du CM1.
◦ Ciblage : Il identifie des cibles faciles, des élèves affichant des « normes déviantes », une « forme de fragilité » ou une « marginalité ».
◦ Escalade de la violence : Ses actes vont des brimades verbales à la violence physique.
Un événement particulièrement grave le voit projeter un camarade dans une poubelle en béton, menant à une convocation au commissariat.
En 5ème, il agresse un autre élève en lui frottant le visage avec une feuille urticante à laquelle il est allergique, ce qui entraîne une intervention des pompiers et son exclusion temporaire.
• Prise de conscience et réparation :
◦ Conséquences pour lui : Son comportement entraîne une chute drastique de ses résultats scolaires (de 14 à 7 de moyenne), son exclusion et un sentiment d'abandon.
◦ Le déclic : Sa prise de conscience s'opère en plusieurs temps : une remarque malheureuse à son petit frère qui lui répond qu'il se suiciderait s'il était homosexuel ; l'apprentissage qu'une de ses victimes souhaitait se venger physiquement ; et ses études en sociologie qui lui permettent de comprendre les mécanismes sociaux à l'œuvre.
◦ Démarche de réparation : Il décide de recontacter ses anciennes victimes pour présenter ses excuses, une démarche qu'il juge essentielle.
Pour lui, témoigner est une manière de « mettre mon expérience à contribution pour faire en sorte que on identifie vraiment les causes du harcèlement ».
La notion de "différence" est identifiée comme un catalyseur central du harcèlement.
• Pour Anna, son anxiété, son introversion et son côté « artiste » la singularisent et en font une cible.
Ses parents lui disent initialement : « tu es un peu différent, un peu bizarre, mets-toi un peu dans les normes et ça ira mieux ».
• Pour Zacharie, les victimes sont choisies parce qu'elles « affichent des normes déviantes » ou une « fragilité ».
Il explique que la différence, qu'elle soit due à l'introversion ou l'extraversion, est un « vrai facteur de risque ».
• Lui-même n'était « pas dans le moule », son comportement turbulent le distinguant et le poussant à trouver une autre manière d'exister.
Le témoignage met en évidence l'impact déterminant, positif comme négatif, des adultes.
• L'institution Scolaire : L'école apparaît souvent comme une institution défaillante.
◦ Manque de réaction : Des professeurs sont témoins de moqueries répétées mais « ne disaient rien du tout ».
◦ Participation active : Le cas de la professeure d'Anna en 3ème, qui l'humilie publiquement, est l'exemple le plus extrême de la faillite de l'adulte protecteur.
◦ Réponses inadaptées : Les sanctions contre Zacharie (convocation à la police, exclusion) ne sont pas accompagnées d'une démarche pédagogique pour l'amener à réfléchir à ses actes.
Une conseillère d'orientation déclare même à sa mère : « Votre fils madame Zacharie, il est foutu ».
◦ Interventions positives : À l'inverse, certaines figures comme la professeure principale d'Anna (qui finit par comprendre), la CPE et l'infirmière, ou la nouvelle équipe enseignante de Zacharie au lycée, montrent qu'un soutien bienveillant peut radicalement changer une trajectoire.
• Les Parents : Les parents sont souvent démunis.
◦ Incompréhension initiale : Les parents d'Anna ne mesurent pas la gravité de la situation au début, ce qu'elle a ressenti comme un manque d'écoute.
◦ Déni : La mère de Zacharie a du mal à accepter la réalité des faits, parlant de « chamaillerie » et se demandant pourquoi les professeurs n'ont pas « mis de mots » sur la situation.
◦ Soutien et inquiétude : Une fois la situation comprise, les parents d'Anna deviennent un soutien indéfectible, bien que leur vie soit « beaucoup impactée ». Ils expriment leur inquiétude constante et leur sentiment d'impuissance.
Les effets du harcèlement s'inscrivent durablement dans la vie des individus concernés.
| Impact Psychologique | Impact Physique et Comportemental | Impact Social et Relationnel | | --- | --- | --- | | Anxiété chronique et crises d'angoisse | Troubles du sommeil | Isolement et perte des amis | | Traumatismes profonds et amnésie partielle | Troubles du comportement alimentaire | Difficulté à demander de l'aide et à faire confiance | | Perte d'estime de soi (« je vaux quelque chose ») | Automutilation (scarification, brûlures) | Perte de confiance en soi et peur du jugement | | Idées suicidaires (« plus de raison de vivre ») | Phobie scolaire | Difficulté à se reconstruire une identité positive |
• Pour Anna : La reconstruction passe par un suivi thérapeutique, le soutien familial, et la redécouverte de passions comme les réseaux sociaux (Musical.ly) qui lui ont permis de reprendre confiance.
Son projet de devenir infirmière est directement lié à son vécu : « je veux être utile dans la vie des gens ».
• Pour Zacharie : Son changement de collège et son orientation en bac professionnel marquent une rupture.
Il trouve une manière positive d'exister en devenant un bon élève et en aidant ses camarades.
Ses études en sociologie lui fournissent les outils intellectuels pour analyser son passé. Il choisit de vivre dans un camping-car, symbole d'une quête de « liberté ».
La rencontre organisée entre Anna et Zacharie incarne une démarche de justice restaurative.
• Attentes : Anna espère que cette rencontre lui apportera des réponses et l'aidera à « faire le deuil de la période de mon harcèlement ». Zacharie y voit l'opportunité de montrer les « deux côtés d'une même histoire ».
• Déroulement : L'échange leur permet de confronter leurs expériences et leurs ressentis. Zacharie explique ses motivations, tandis qu'Anna décrit la violence de ce qu'elle a subi.
• Impact : La rencontre est un moment de reconnaissance mutuelle. Anna conclut que Zacharie n'est pas « une mauvaise personne parce que tu regrettes ce que tu as fait ».
Pour Zacharie, présenter ses excuses et montrer qu'il a changé est « beaucoup plus valorisant » que le harcèlement lui-même. Léa, une autre de ses victimes, confirme que sa démarche l'a aidée à « clore un chapitre ».
Les témoignages convergent vers plusieurs messages forts.
• Pour les victimes : Il est crucial de parler et de ne pas s'isoler dans la souffrance. Anna insiste : « c'est pas vous les coupables ». Le harcèlement est une épreuve qui « suit toute sa vie » si elle n'est pas stoppée.
• Pour les auteurs : Zacharie affirme que le harcèlement n'est « pas cool », « pas stylé » et qu'il ne rend pas « plus intéressant ». Il souligne que reconnaître ses torts est une étape difficile mais nécessaire et positive.
• Pour la société : Les témoignages appellent à une plus grande attention et à une prise au sérieux du phénomène.
Ils rappellent que le harcèlement prend racine dans une souffrance, y compris celle de l'auteur qui ne trouve pas sa place.
Le dialogue et la reconnaissance du mal causé sont présentés comme des outils puissants pour la réparation et la prévention.
Author response:
The following is the authors’ response to the original reviews.
Public Reviews:
Reviewer #1 (Public review):
Monziani and Ulitsky present a large and exhaustive study on the lncRNA EPB41L4A-AS1 using a variety of genomic methods. They uncover a rather complex picture of an RNA transcript that appears to act via diverse pathways to regulate the expression of large numbers of genes, including many snoRNAs. The activity of EPB41L4A-AS1 seems to be intimately linked with the protein SUB1, via both direct physical interactions and direct/indirect of SUB1 mRNA expression.
The study is characterised by thoughtful, innovative, integrative genomic analysis. It is shown that EPB41L4A-AS1 interacts with SUB1 protein and that this may lead to extensive changes in SUB1's other RNA partners. Disruption of EPB41L4A-AS1 leads to widespread changes in non-polyA RNA expression, as well as local cis changes. At the clinical level, it is possible that EPB41L4A-AS1 plays disease-relevant roles, although these seem to be somewhat contradictory with evidence supporting both oncogenic and tumour suppressive activities.
A couple of issues could be better addressed here. Firstly, the copy number of EPB41L4A-AS1 is an important missing piece of the puzzle. It is apparently highly expressed in the FISH experiments. To get an understanding of how EPB41L4A-AS1 regulates SUB1, an abundant protein, we need to know the relative stoichiometry of these two factors. Secondly, while many of the experiments use two independent Gapmers for EPB41L4A-AS1 knockdown, the RNA-sequencing experiments apparently use just one, with one negative control (?). Evidence is emerging that Gapmers produce extensive off-target gene expression effects in cells, potentially exceeding the amount of on-target changes arising through the intended target gene. Therefore, it is important to estimate this through the use of multiple targeting and non-targeting ASOs, if one is to get a true picture of EPB41L4A-AS1 target genes. In this Reviewer's opinion, this casts some doubt over the interpretation of RNA-seq experiments until that work is done. Nonetheless, the Authors have designed thorough experiments, including overexpression rescue constructs, to quite confidently assess the role of EPB41L4A-AS1 in snoRNA expression.
It is possible that EPB41L4A-AS1 plays roles in cancer, either as an oncogene or a tumour suppressor. However, it will in the future be important to extend these observations to a greater variety of cell contexts.
This work is valuable in providing an extensive and thorough analysis of the global mechanisms of an important regulatory lncRNA and highlights the complexity of such mechanisms via cis and trans regulation and extensive protein interactions.
Reviewer #2 (Public review):
Summary:
In this manuscript, Monziani et al. identified long noncoding RNAs (lncRNAs) that act in cis and are coregulated with their target genes located in close genomic proximity. The authors mined the GeneHancer database, and this analysis led to the identification of four lncRNA-target pairs. The authors decided to focus on lncRNA EPB41L4A-AS1.
They thoroughly characterised this lncRNA, demonstrating that it is located in the cytoplasm and the nuclei, and that its expression is altered in response to different stimuli. Furthermore, the authors showed that EPB41L4A-AS1 regulates EPB41L4A transcription, leading to a mild reduction in EPB41L4A protein levels. This was not recapitulated with siRNA-mediated depletion of EPB41L4AAS1. RNA-seq in EPB41L4A-AS1-depleted cells with single LNA revealed 2364 DEGs linked to pathways including the cell cycle, cell adhesion, and inflammatory response. To understand the mechanism of action of EPB41L4A-AS1, the authors mined the ENCODE eCLIP data and identified SUB1 as an lncRNA interactor. The authors also found that the loss of EPB41L4A-AS1 and SUB1 leads to the accumulation of snoRNAs, and that SUB1 localisation changes upon the loss of EPB41L4A-AS1. Finally, the authors showed that EPB41L4A-AS1 deficiency did not change the steady-state levels of SNORA13 nor RNA modification driven by this RNA. The phenotype associated with the loss of EPB41L4A-AS1 is linked to increased invasion and EMT gene signature.
Overall, this is an interesting and nicely done study on the versatile role of EPB41L4A-AS1 and the multifaceted interplay between SUB1 and this lncRNA, but some conclusions and claims need to be supported with additional experiments. My primary concerns are using a single LNA gapmer for critical experiments, increased invasion, and nucleolar distribution of SUB1- in EPB41L4A-AS1-depleted cells. These experiments need to be validated with orthogonal methods.
Strengths:
The authors used complementary tools to dissect the complex role of lncRNA EPB41L4A-AS1 in regulating EPB41L4A, which is highly commendable. There are few papers in the literature on lncRNAs at this standard. They employed LNA gapmers, siRNAs, CRISPRi/a, and exogenous overexpression of EPB41L4A-AS1 to demonstrate that the transcription of EPB41L4A-AS1 acts in cis to promote the expression of EPB41L4A by ensuring spatial proximity between the TAD boundary and the EPB41L4A promoter. At the same time, this lncRNA binds to SUB1 and regulates snoRNA expression and nucleolar biology. Overall, the manuscript is easy to read, and the figures are well presented. The methods are sound, and the expected standards are met.
Weaknesses:
The authors should clarify how many lncRNA-target pairs were included in the initial computational screen for cis-acting lncRNAs and why MCF7 was chosen as the cell line of choice. Most of the data uses a single LNA gapmer targeting EPB41L4A-AS1 lncRNA (eg, Fig. 2c, 3B, and RNA-seq), and the critical experiments should be using at least 2 LNA gapmers. The specificity of SUB1 CUT&RUN is lacking, as well as direct binding of SUB1 to lncRNA EPB41L4A-AS1, which should be confirmed by CLIP qPCR in MCF7 cells. Finally, the role of EPB41L4A-AS1 in SUB1 distribution (Figure 5) and cell invasion (Figure 8) needs to be complemented with additional experiments, which should finally demonstrate the role of this lncRNA in nucleolus and cancer-associated pathways. The use of MCF7 as a single cancer cell line is not ideal.
Reviewer #3 (Public review):
Summary:
In this paper, the authors made some interesting observations that EPB41L4A-AS1 lncRNA can regulate the transcription of both the nearby coding gene and genes on other chromosomes. They started by computationally examining lncRNA-gene pairs by analyzing co-expression, chromatin features of enhancers, TF binding, HiC connectome, and eQTLs. They then zoomed in on four pairs of lncRNA-gene pairs and used LNA antisense oligonucleotides to knock down these lncRNAs. This revealed EPB41L4A-AS1 as the only one that can regulate the expression of its cis-gene target EPB41L4A. By RNA-FISH, the authors found this lncRNA to be located in all three parts of a cell: chromatin, nucleoplasm, and cytoplasm. RNA-seq after LNA knockdown of EPB41L4A-AS1 showed that this increased >1100 genes and decreased >1250 genes, including both nearby genes and genes on other chromosomes. They later found that EPB41L4A-AS1 may interact with SUB1 protein (an RNA-binding protein) to impact the target genes of SUB1. EPB41L4A-AS1 knockdown reduced the mRNA level of SUB1 and altered the nuclear location of SUB1. Later, the authors observed that EPB41L4A-AS1 knockdown caused an increase of snRNAs and snoRNAs, likely via disrupted SUB1 function. In the last part of the paper, the authors conducted rescue experiments that suggested that the full-length, intron- and SNORA13-containing EPB41L4A-AS1 is required to partially rescue snoRNA expression. They also conducted SLAM-Seq and showed that the increased abundance of snoRNAs is primarily due to their hosts' increased transcription and stability. They end with data showing that EPB41L4A-AS1 knockdown reduced MCF7 cell proliferation but increased its migration, suggesting a link to breast cancer progression and/or metastasis.
Strengths:
Overall, the paper is well-written, and the results are presented with good technical rigor and appropriate interpretation. The observation that a complex lncRNA EPB41L4A-AS1 regulates both cis and trans target genes, if fully proven, is interesting and important.
Weaknesses:
The paper is a bit disjointed as it started from cis and trans gene regulation, but later it switched to a partially relevant topic of snoRNA metabolism via SUB1. The paper did not follow up on the interesting observation that there are many potential trans target genes affected by EPB41L4A-AS1 knockdown and there was limited study of the mechanisms as to how these trans genes (including SUB1 or NPM1 genes themselves) are affected by EPB41L4A-AS1 knockdown. There are discrepancies in the results upon EPB41L4A-AS1 knockdown by LNA versus by CRISPR activation, or by plasmid overexpression of this lncRNA.
Recommendations for the authors:
Reviewer #1 (Recommendations for the authors):
(1) Copy number:
Perhaps I missed it, but it seems that no attempt is made to estimate the number of copies of EPB41L4A-AS1 transcripts per cell. This should be possible given RNAseq and FISH. At least an order of magnitude estimate. This is important for shedding light on the later observations that EPB41L4A-AS1 may interact with SUB1 protein and regulate the expression of thousands of mRNAs.
We thank the reviewer for the insightful suggestion. We agree that an estimate of EPB41L4A-AS1 copy number might further strengthen the hypotheses presented in the manuscript. Therefore, we analyzed the smFISH images and calculated the copy number per cell of this lncRNA, as well as that of GAPDH as a comparison.
Because segmenting MCF-7 cells proved to be difficult due to the extent of the cell-cell contacts they establish, we imaged multiple (n = 14) fields of view, extracted the number of EPB41L4A-AS1/GAPDH molecules in each field and divided them by the number of cells (as assessed by DAPI staining, 589 cells in total). We detected an average of 33.37 ± 3.95 EPB41L4A-AS1 molecules per cell, in contrast to 418.27 ± 61.79 GAPDH molecules. As a comparison, within the same qPCR experiment the average of the Ct values of these two RNAs is about 22.3 and 17.5, the FPKMs in the polyA+ RNA-seq are ~ 2479.4 and 35.6, and the FPKMs in the rRNA-depleted RNA-seq are ~ 3549.9 and 19.3, respectively. Thus, our estimates of the EPB41L4A-AS1 copy number in MCF-7 cells fits well into these observations.
The question whether an average of ~35 molecules per cell is sufficient to affect the expression of thousands of genes is somewhat more difficult to ascertain. As discussed below, it is unlikely that all the genes dysregulated following the KD of EPB41L4A-AS1 are all direct targets of this lncRNA, and indeed SUB1 depletion affects an order of magnitude fewer genes. It has been shown that lncRNAs can affect the behavior of interacting RNAs and proteins in a substoichiometric fashion (Unfried & Ulitsky, 2022), but whether this applies to EPB41L4A-AS1 remains to be addressed in future studies. Nonetheless, this copy number appears to be sufficient for a trans-acting functions for this lncRNA, on top of its cis-regulatory role in regulating EPB41L4A. We added this information in the text as follows:
“Using single-molecule fluorescence in-situ hybridization (smFISH) and subcellular fractionation we found that EPB41L4A-AS1 is expressed at an average of 33.37 ± 3.95 molecule per cell, and displays both nuclear and cytoplasmic localization in MCF-7 cells (Fig. 1D), with a minor fraction associated with chromatin as well (Fig. 1E).”
We have updated the methods section as well:
“To visualize the subcellular localization of EPB41L4A-AS1 in vivo, we performed single-molecule fluorescence in situ hybridization (smFISH) using HCR™ amplifiers. Probe sets (n = 30 unique probes) targeting EPB41L4A-AS1 and GAPDH (positive control) were designed and ordered from Molecular Instruments. We followed the Multiplexed HCR v3.0 protocol with minor modifications. MCF-7 cells were plated in 8-well chambers (Ibidi) and cultured O/N as described above. The next day, cells were fixed with cold 4% PFA in 1X PBS for 10 minutes at RT and then permeabilized O/N in 70% ethanol at -20°C. Following permeabilization, cells were washed twice with 2X SSC buffer and incubated at 37°C for 30 minutes in hybridization buffer (HB). The HB was then replaced with a probe solution containing 1.2 pmol of EPB41L4A-AS1 probes and 0.6 pmol of GAPDH probes in HB. The slides were incubated O/N at 37°C. To remove excess probes, the slides were washed four times with probe wash buffer at 37°C for 5 minutes each, followed by two washes with 5X SSCT at RT for 5 minutes. The samples were then pre-amplified in amplification buffer for 30 minutes at RT and subsequently incubated O/N in the dark at RT in amplification buffer supplemented with 18 pmol of the appropriate hairpins. Finally, excess hairpins were removed by washing the slides five times in 5X SSCT at RT. The slides were mounted with ProLong™ Glass Antifade Mountant (Invitrogen), cured O/N in the dark at RT, and imaged using a Nikon CSU-W1 spinning disk confocal microscope. In order to estimate the RNA copy number, we imaged multiple distinct fields, extracted the number of EPB41L4A-AS1/GAPDH molecules in each field using the “Find Maxima” tool in ImageJ/Fiji, and divided them by the number of cells (as assessed by DAPI staining).”
(2) Gapmer results:
Again, it is quite unclear how many and which Gapmer is used in the genomics experiments, particularly the RNA-seq. In our recent experiments, we find very extensive off-target mRNA changes arising from Gapmer treatment. For this reason, it is advisable to use both multiple control and multiple targeting Gapmers, so as to identify truly target-dependent expression changes. While I acknowledge and commend the latter rescue experiments, and experiments using multiple Gapmers, I'd like to get clarification about how many and which Gapmers were used for RNAseq, and the authors' opinion on the need for additional work here.
We agree with the Reviewer that GapmeRs are prone to off-target and unwanted effects (Lai et al., 2020; Lee & Mendell, 2020; Maranon & Wilusz, 2020). Early in our experiments, we found out that LNA1 triggers a non-specific CDKN1A/p21 activation (Fig. S5A-C), and thus, we have initially performed some experiments such as RNA-seq with only LNA2.
Nonetheless, other experiments were performed using both GapmeRs, such as multiple RT-qPCRs, UMI-4C, SUB1 and NPM1 imaging, and the in vitro assays, among others, and consistent results were obtained with both LNAs.
To accommodate the request by this and the other reviewers, we have now performed another round of polyA+ RNA-seq following EPB41L4A-AS1 knockdown using LNA1 or LNA2, as well as the previously used and an additional control GapmeR. The FPKMs of the control samples are highly-correlated both within replicates and between GapmeRs (Fig. S6A). More importantly, the fold-changes to control are highly correlated between the two on-target GapmeRs LNA1 and LNA2, regardless of the GapmeR used for normalization (Fig. S6B), thus showing that the bulk of the response is shared and likely the direct result of the reduction in the levels of EPB41L4A-AS1. Notably, key targets NPM1 and MTREX (see discussion, Fig. S12A-C and comments to Reviewer 3) were found to be downregulated by both LNAs (Fig. S6C).
However, we acknowledge that some of the dysregulated genes are observed only when using one GapmeR and not the other, likely due to a combination of indirect, secondary and non-specific effects, and as such it is difficult to infer the direct response. Supporting this, LNA2 yielded a total of 1,069 DEGs (617 up and 452 down) and LNA1 2,493 DEGs (1,328 up and 1,287 down), with the latter triggering a stronger response most likely as a result of the previously mentioned CDKN1A/p21 induction. Overall, 45.1% of the upregulated genes following LNA2 transfection were shared with LNA1, in contrast to only the 24.3% of the downregulated ones.
We have now included these results in the Results section (see below) and in Supplementary Figure (Fig. S6).
“Most of the consequences of the depletion of EPB41L4A-AS1 are thus not directly explained by changes in EPB41L4A levels. An additional trans-acting function for EPB41L4A-AS1 would therefore be consistent with its high expression levels compared to most lncRNAs detected in MCF-7 (Fig. S5G). To strengthen these findings, we have transfected MCF-7 cells with LNA1 and a second control GapmeR (NT2), as well as the previous one (NT1) and LNA2, and sequenced the polyadenylated RNA fraction as before. Notably, the expression levels (in FPKMs) of the replicates of both control samples are highly correlated with each other (Fig. S6A), and the global transcriptomic changes triggered by the two EPB41L4A-AS1-targeting LNAs are largely concordant (Fig. S6B and S6C). Because of this concordance and the cleaner (i.e., no CDKN1A upregulation) readout in LNA2-transfected cells, we focused mainly on these cells for subsequent analyses.”
(3) Figure 1E:
Can the authors comment on the unusual (for a protein-coding mRNA) localisation of EPB41L4A, with a high degree of chromatin enrichment?
We acknowledge that mRNAs from protein-coding genes displaying nuclear and chromatin localizations are quite unusual. The nuclear and chromatin localization of some mRNAs are often due to their low expression, length, time that it takes to be transcribed, repetitive elements and strong secondary structures (Bahar Halpern et al., 2015; Didiot et al., 2018; Lubelsky & Ulitsky, 2018; Ly et al., 2022).
We now briefly mention this in the text:
“In contrast, both EPB41L4A and SNORA13 were mostly found in the chromatin fraction (Fig. 1E), the former possibly due to the length of its pre-mRNA (>250 kb), which would require substantial time to transcribe (Bahar Halpern et al., 2015; Didiot et al., 2018; Lubelsky & Ulitsky, 2018; Ly et al., 2022).”
Supporting our results, analysis of the ENCODE MCF-7 RNA-seq data of the cytoplasmic, nuclear and total cell fractions indeed shows a nuclear enrichment of the EPB41L4A mRNA (Author response image 1), in line with what we observed in Fig. 1E by RT-qPCR.
Author response image 1.
The EPB41L4A transcript is nuclear-enriched in the MCF-7 ENCODE subcellular RNA-seq dataset. Scatterplot of gene length versus cytoplasm/nucleus ratio (as computed by DESeq2) in MCF-7 cells. Each dot represents an unique gene, color-coded reflecting if their DESeq2 adjusted p-value < 0.05 and absolute log<sub>2</sub>FC > .41 (33% enrichment or depletion).GAPDH and MALAT1 are shown as representative cytoplasmic and nuclear transcripts, respectively. Data from ENCODE.
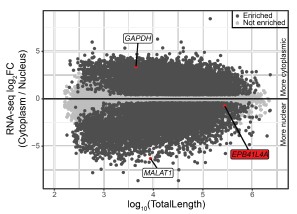
(4) Annotation and termini of EPB41L4A-AS1:
The latest Gencode v47 annotations imply an overlap of the sense and antisense, different from that shown in Figure 1C. The 3' UTR of EPB41L4A is shown to extensively overlap EPB41L4A-AS1. This could shed light on the apparent regulation of the former by the latter that is relevant for this paper. I'd suggest that the authors update their figure of the EPB41L4A-AS1 locus organisation with much more detail, particularly evidence for the true polyA site of both genes. What is more, the authors might consider performing RACE experiments for both RNAs in their cells to definitely establish whether these transcripts contain complementary sequence that could cause their Watson-Crick hybridisation, or whether their two genes might interfere with each other via some kind of polymerase collision.
We thank the reviewer for pointing this out. Also in previous GENCODE annotations, multiple isoforms were reported with some overlapping the 3’ UTR of EPB41L4A. In the EPB41L4A-AS1 locus image (Fig. 1C), we report at the bottom the different transcripts isoforms currently annotated, and a schematics of the one that is clearly the most abundant in MCF-7 cells based on RNA-seq read coverage. This is supported by both the polyA(+) and ribo(-) RNA-seq data, which are strand-specific, as shown in the figure.
We now also examined the ENCODE/CSHL MCF-7 RNA-seq data from whole cell, cytoplasm and nucleus fractions, as well as 3P-seq data (Jan et al., 2011) (unpublished data from human cell lines), reported in Author response image 2. All these data support the predominant use of the proximal polyA site in human cell lines. This shorter isoform does not overlap EPB41L4A.
Author response image 2.
Most EPB41L4A-AS1 transcripts end before the 3’ end of EPB41L4A. UCSC genome browser view showing tracks from 3P-seq data in different cell lines and neural crest (top, with numbers representing the read counts, i.e. how many times that 3’ end has been detected), and stranded ENCODE subcellular RNA-seq (bottom).
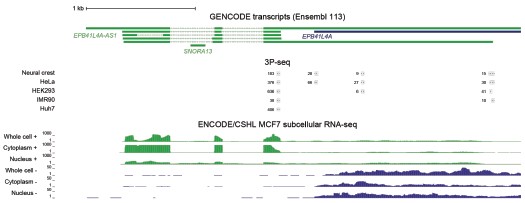
Based on these data, the large majority of cellular transcripts of EPB41L4A-AS1 terminate at the earlier polyA site and don’t overlap with EPB41L4A. There is a small fraction that appears to be restricted to the nucleus that terminates later at the annotated isoform. 3' RACE experiments are not expected to provide substantially different information beyond what is already available.
(5) Figure 3C:
There is an apparent correlation between log2FC upon EPB41L4A-AS1 knockdown, and the number of clip sites for SUB1. However, I expect that the clip signal correlates strongly with the mRNA expression level, and that log2FC may also correlate with the same. Therefore, the authors would be advised to more exhaustively check that there really is a genuine relationship between log2FC and clip sites, after removing any possible confounders of overall expression level.
As the reviewer suggested, there is a correlation between the baseline expression level and the strength of SUB1 binding in the eCLIP data. To address this issue, we built expression-matched controls for each group of SUB1 interactors and checked the fold-changes following EPB41L4A-AS1 KD, similarly to what we have done in Fig. 3C. The results are presented, and are now part of Supplementary Figure 7 (Fig. S7C).
Based on this analysis, while there is a tendency of increased expression with increased SUB1 binding, when controlling for expression levels the effect of down-regulation of SUB1-bound RNAs upon lncRNA knockdown remains, suggesting that it is not merely a confounding effect. We have updated the text as follows:
“We hypothesized that loss of EPB41L4A-AS1 might affect SUB1, either via the reduction in its expression or by affecting its functions. We stratified SUB1 eCLIP targets into confidence intervals, based on the number, strength and confidence of the reported binding sites. Indeed, eCLIP targets of SUB1 (from HepG2 cells profiled by ENCODE) were significantly downregulated following EPB41L4A-AS1 KD in MCF-7, with more confident targets experiencing stronger downregulation (Fig. 3C). Importantly, this still holds true when controlling for gene expression levels (Fig. S7C), suggesting that this negative trend is not due to differences in their baseline expression.”
(6) The relation to cancer seems somewhat contradictory, maybe I'm missing something. Could the authors more clearly state which evidence is consistent with either an Oncogene or a Tumour Suppressive function, and discuss this briefly in the Discussion? It is not a problem if the data are contradictory, however, it should be discussed more clearly.
We acknowledge this apparent contradiction. Cancer cells are characterized by a multitude of hallmarks depending on the cancer type and stage, including high proliferation rates and enhanced invasive capabilities. The notion that cells with reduced EPB41L4A-AS1 levels exhibit lower proliferation, yet increased invasion is compatible with a function as an oncogene. Cells undergoing EMT may reduce or even completely halt proliferation/cell division, until they revert back to an epithelial state (Brabletz et al., 2018; Dongre & Weinberg, 2019). Notably, downregulated genes following EPB41L4A-AS1 KD are enriched in GO terms related to cell proliferation and cell cycle progression (Fig. 2I), whereas those upregulated are enriched for terms linked to EMT processes. Thus, while we cannot rule out a potential function as tumor suppressor gene, our data fit better the notion that EPB41L4A-AS1 promotes invasion, and thus, primarily functions as an oncogene. We now address this in point in the discussion:
“The notion that cells with reduced EPB41L4A-AS1 levels exhibit lower proliferation (Fig. 8C), yet increased invasion (Fig. 8A and 8B) is compatible with a function as an oncogene by promoting EMT (Fig. 8D and 8E). Cells undergoing this process may reduce or even completely halt proliferation/cell division, until they revert back to an epithelial state (Brabletz et al., 2018; Dongre & Weinberg, 2019). Notably, downregulated genes following EPB41L4A-AS1 KD are enriched in GO terms related to cell proliferation and cell cycle progression (Fig. 2I), whereas those upregulated for terms linked to EMT processes. Thus, while we cannot rule out a potential function as tumor suppressor gene, our data better fits the idea that this lncRNA promotes invasion, and thus, primarily functions as an oncogene.”
Reviewer #2 (Recommendations for the authors):
Below are major and minor points to be addressed. We hope the authors find them useful.
(1) Figure 1:
Where are LNA gapmers located within the EPB41L4A-AS1 gene? Are they targeting exons or introns of the EPB41L4A-AS1? Please clarify or include in the figure.
We now report the location of the two GapmeRs in Fig. 1C. LNA1 targets the intronic region between SNORA13 and exon 2, and LNA2 the terminal part of exon 1.
(2) Figure 2B:
Why is a single LNA gapmer used for EPB41L4A Western? In addition, are the qPCR data in Figure 2B the same as in Figure 1B? Please clarify.
The Western Blot was performed after transfecting the cells with either LNA1 or LNA2. We now have replaced Fig. 2C with the full Western Blot image, in order to show both LNAs. With respect to the qPCRs in Fig. 1B and 2B, they represent the results from two independent experiments.
(3) Figure 2F:
2364 DEGs for a single LNA is a lot of deregulated genes in RNA-seq data. How do the authors explain such a big number in DEGs? Is that because this LNA was intronic? Additional LNA gapmer would minimise the "real" lncRNA target and any potential off-target effect.
We agree with the Reviewer that GapmeRs are prone to off-target and unwanted effects (Lai et al.,2020; Lee & Mendell, 2020; Maranon & Wilusz, 2020). Early in our experiments, we found out that LNA1 triggers a non-specific CDKN1A/p21 activation (Fig. S5A-C), and thus, we have initially performed some experiments such as RNA-seq with only LNA2.
Nonetheless, other experiments were performed using both GapmeRs, such as multiple RT-qPCRs, UMI-4C, SUB1 and NPM1 imaging, and the in vitro assays, among others, and consistent results were obtained with both LNAs.
To accommodate the request by this and the other reviewers, we have now performed another round of polyA+ RNA-seq following EPB41L4A-AS1 knockdown using LNA1 or LNA2, as well as the previously used and an additional control GapmeR. The FPKMs of the control samples are highly-correlated both within replicates and between GapmeRs (Fig. S6A). More importantly, the fold-changes to control are highly correlated between the two on-target GapmeRs LNA1 and LNA2, regardless of the GapmeR used for normalization (Fig. S6B), thus showing that despite significant GapmeR-specific effects, the bulk of the response is shared and likely the direct result of the reduction in the levels of EPB41L4A-AS1. Notably, key targets NPM1 and MTREX (see discussion, Fig. S12A-C and comments to Reviewer 3) were found to be downregulated by both LNAs (Fig. S6C).
However, we acknowledge that some of the dysregulated genes are observed only when using one GapmeR and not the other, likely due to a combination of indirect, secondary and non-specific effects, and as such it is difficult to infer the direct response. Supporting this, LNA2 yielded a total of 1,069 DEGs (617 up and 452 down) and LNA1 2,493 DEGs (1,328 up and 1,287 down), with the latter triggering a stronger response most likely as a result of the previously mentioned CDKN1A/p21 induction. Overall, 45.1% of the upregulated genes following LNA2 transfection were shared with LNA1, in contrast to only the 24.3% of the downregulated ones.
We have now included these results in the Results section (see below) and in Supplementary Figure (Fig. S6).
“Most of the consequences of the depletion of EPB41L4A-AS1 are thus not directly explained by changes in EPB41L4A levels. An additional trans-acting function for EPB41L4A-AS1 would therefore be consistent with its high expression levels compared to most lncRNAs detected in MCF-7 (Fig. S5G). To strengthen these findings, we have transfected MCF-7 cells with LNA1 and a second control GapmeR (NT2), as well as the previous one (NT1) and LNA2, and sequenced the polyadenylated RNA fraction as before. Notably, the expression levels (in FPKMs) of the replicates of both control samples are highly correlated with each other (Fig. S6A), and the global transcriptomic changes triggered by the two EPB41L4A-AS1-targeting LNAs are largely concordant (Fig. S6B and S6C). Because of this concordance and the cleaner (i.e., no CDKN1A upregulation) readout in LNA2-transfected cells, we focused mainly on these cells for subsequent analyses.”
(4) Figure 3B: Does downregulation of SUB1 and NPM1 reflect at the protein level with both LNA gapmers? The authors should show a heatmap and metagene profile for SUB1 CUT & RUN. How did the author know that SUB1 binding is specific, since CUT & RUN was not performed in SUB1-depleted cells?
As requested by both Reviewer #2 and #3, we have performed WB for SUB1, NPM1 and FBL following EPB41L4A-AS1 KD with two targeting (LNA1 and LNA2) and the previous control GapmeRs. Interestingly, we did not detect any significant downregulation of either proteins (Author response image 3), although this might be the result of the high variability observed in the control samples. Moreover, the short timeframe in which the experiments have been conducted━that is, transient transfections for 3 days━might not be sufficient time for the existing proteins to be degraded, and thus, the downregulation is more evident at the RNA (Fig. 3B and Supplementary Figure 6C) rather than protein level.
Author response image 3.
EPB41L4A-AS1 KD has only marginal effects on the levels of nucleolar proteins. (A) Western Blots for the indicated proteins after the transfection for 3 days of the control and targeting GapmeRs. (B) Quantification of the protein levels from (A). All experiments were performed in n=3 biological replicates, with the error bars in the barplots representing the standard deviation. ns - P>0.05; * - P<0.05; ** - P<0.01; *** - P<0.001 (two-sided Student’s t-test).
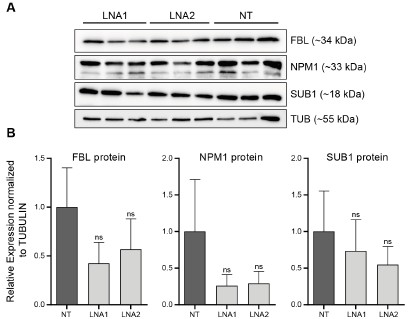
Following the suggestion by the Reviewer, we now show both the SUB1 CUT&RUN metagene profile (previously available as Fig. 3F) and the heatmap (now Fig. 3G) around the TSS of all genes, stratified by their expression level. Both graphs are reported.
We show that the antibody signal is responsive to SUB1 depletion via siRNAs in both WB (Fig. S8F) and IF (Fig. 5E) experiments. As mentioned below, this and the absence of non-specific signals makes us confident in the CUT&RUN data. Performing CUT&RUN in SUB1 depleted cells would be difficult to interpret as perturbations are typically not complete, and so the remaining protein can still bind the same regions. Since there isn’t a clear way to add spike-ins to CUT&RUN experiments, it is very difficult to show specificity of binding by CUT&RUN in siRNA-knockdown cells.
(5) Figure 3D: The MW for the depicted proteins are lacking. Why is there no SUB1 protein in the input? Please clarify. Since the authors used siRNA to deplete SUB1, it would be good to know if the antibody is specific in their CUT & RUN (see above)
We apologize for the lack of the MW in Fig. 3D. As shown in Fig. S8F, SUB1 is ~18 kDa and the antibody signal is responsive to SUB1 depletion via siRNAs in both WB (Fig. S8F) and IF (Fig. 5E) experiments. Thus, given its 1) established specificity in those two settings and 2) the lack of generalized signal at most open chromatin regions, which is typical of nonspecific CUT&RUN experiments, we are confident in the specificity of the CUT&RUN results.
We now mention the MW of SUB1 in Fig. 3D as well and we provide in Author response image 4 the full SUB1 WB picture, enhancing the contrast to highlight the bands. We agree that the SUB1 band in the input is weak, likely reflecting the low abundance in that fraction and the detection difficulty due to its low MW (see Fig. S8F).
Author response image 4.
Western blot for SUB1 following RIP using either a SUB1 or IgG antibody. IN - input, SN - supernatant/unbound, B - bound.

(6) Supplementary Figure 6C:
The validation of lncRNA EPB41L4A-AS1 binding to SUB1 should be confirmed by CLIP qPCR, since native RIP can lead to reassociation of RNA-protein interactions (PMID: 15388877). Additionally, the eclip data presented in Figure 3a were from a different cell line and not MCF7.
We acknowledge that the SUB1 eCLIP data was generated in a different cell line, as we mentioned in the text:
“Indeed, eCLIP targets of SUB1 (from HepG2 cells profiled by ENCODE) were significantly downregulated following EPB41L4A-AS1 KD in MCF-7, with more confident targets experiencing stronger downregulation (Fig. 3C). Importantly, this still holds true when controlling for gene expression levels (Fig. S7C), suggesting that this negative trend is not due to differences in their baseline expression. To obtain SUB1-associated transcripts in MCF-7 cells; we performed a native RNA immunoprecipitation followed by sequencing of polyA+ RNAs (RIP-seq) (Fig. 3D, S7D and S7E).”
Because of this, we resorted to native RIP, in order to get binding information in our experimental system. As we show independent evidence for binding using both eCLIP and RIP, and the substantial challenge in establishing the CLIP method, which has not been successfully used in our group, we respectfully argue that further validations are out of scope of this study. We nonetheless agree that several genes which are nominally significantly enriched in our RIP data are likely not direct targets of SUB1, especially given that it is difficult to assign the perfect threshold that discriminates between bound and unbound RNAs.
We now additionally mention this at the beginning of the paragraph as well:
“In order to identify potential factors that might be associated with EPB41L4A-AS1, we inspected protein-RNA binding data from the ENCODE eCLIP dataset(Van Nostrand et al., 2020). The exons of the EPB41L4A-AS1 lncRNA were densely and strongly bound by SUB1 (also known as PC4) in both HepG2 and K562 cells (Fig. 3A).”
(7) Figure 3G:
Can the authors distinguish whether loss of EPB41L4A-AS1 affects SUB1 chromatin binding or its activity as RBP? Please discuss.
Distinguishing between altered SUB1 chromatin and RNA binding is challenging, as this protein likely does not interact directly with chromatin and exhibits rather promiscuous RNA binding properties (Ray et al., 2023). In particular, SUB1 (also known as PC4) interacts with and regulates the activity of all three RNA polymerases, and was reported to be involved in transcription initiation and elongation, response to DNA damage, chromatin condensation (Conesa & Acker, 2010; Das et al., 2006; Garavís & Calvo, 2017; Hou et al., 2022) and telomere maintenance (Dubois et al., 2025; Salgado et al., 2024).
Based on our data, genes whose promoters are occupied by SUB1 display marginal, yet highly significant changes in their steady-state expression levels upon lncRNA perturbations. We also show that upon EPB41L4A-AS1 KD, SUB1 acquires a stronger nucleolar localization (Fig. 5A), which likely affects its RNA interactome as well. However, further elucidating these activities would require performing RIP-seq and CUT&RUN in lncRNA-depleted cells, which we argue is out of the scope of the current study. We note that KD of SUB1 with siRNAs have milder effects than that of EPB41L4A-AS1 (Fig. S8G), suggesting that additional players and effects shape the observed changes. Therefore, it is highly likely that the loss of this lncRNA affects both SUB1 chromatin binding profile and RNA binding activity, with the latter likely resulting in the increased snoRNAs abundance.
(8) Figure 4: Can the authors show that a specific class of snorna is affected upon depletion of SUB1 and EPB41L4A-AS1? Can they further classify the effect of their depletion on H/ACA box snoRNAs, C/D box snoRNAs, and scaRNAs?
Such potential distinct effect on the different classes of snoRNAs was considered, and the results are available in Fig. S8B and S8H (boxplots, after EPB41L4A-AS1 and SUB1 depletion), as well as Fig. 4F and S9F (scatterplots between EPB41L4A-AS1 and SUB1 depletion, and EPB41L4A-AS1 and GAS5 depletion, respectively). We see no preferential effect on one group of snoRNAs or the other.
(9) Figure 5: From the representative images, it looks to me that LNA 2 targeting EPB41L4A-AS1 has a bigger effect on nucleolar staining of SUB1. To claim that EPB41L4A-AS1 depletion "shifts SUB1 to a stronger nucleolar distribution", the authors need to perform IF staining for SUB1 and Fibrillarin, a known nucleolar marker. Also, how does this data fit with their qPCR data shown in Figure 3B? It is instrumental for the authors to demonstrate by IF or Western blotting that SUB1 levels decrease in one fraction and increase specifically in the nucleolus. They could perform Western blot for SUB1 and Fibrillarin in EPB41L4A-AS1-depleted cells and isolate cytoplasmic, nuclear, and nucleolar fractions.This experiment will strengthen their finding. The scale bar is missing for all the images in Figure 5. The authors should also show magnified images of a single representative cell at 100x.
We apologize for the confusion regarding the scale bars. As mentioned here and elsewhere, the scale bars are present in the top-left image of each panel only, in order to avoid overcrowding the panel. All the images are already at 100X, with the exception of Fig. 5E (IF for SUB1 upon siSUB1 transfection) which is 60X in order to better show the lack of signal. We however acknowledge that the images are sometimes confusing, due to the PNG features once imported into the document. In any case, in the submission we have also provided the original images in high-quality PDF and .ai formats. The suggested experiment would require establishing a nucleolar fractionation protocol which we currently don’t have available and we argue that it is out of scope of the current study.
(10) Additionally, is rRNA synthesis affected in SUB1- and EPB41L4A-AS1-depleted cells? The authors could quantify newly synthesised rRNA levels in the nucleoli, which would also strengthen their findings about the role of this lncRNA in nucleolar biology.
We acknowledge that there are many aspects of the role of EPB41L4A-AS1 in nucleolar biology that remain to be explored, as well as in nucleolar biology itself, but given the extensive experimental data we already provide in this and other subjects, we respectfully suggest that this experiment is out of scope of the current work. We note that a recent study has shown that SUB1 is required for Pol I-mediated rDNA transcription in the nucleolus (Kaypee et al., 2025). In the presence of nucleolar SUB1, rDNA transcription proceeds as expected, but when SUB1 is depleted or its nucleolar localization is affected—by either sodium butyrate treatment or inhibition of KAT5-mediated phosphorylation at its lysine 35 (K35)—the levels of the 47S pre-rRNA are significantly reduced. In our settings, SUB1 enriches into the nucleolus following EPB41L4A-AS1 KD; thus, we might expect to see a slightly increased rDNA transcription or no effect at all, given that SUB1 localizes in the nucleolus in baseline conditions as well. We now mention this novel role of SUB1 both in the results and discussion.
“SUB1 interacts with all three RNA polymerases and was reported to be involved in transcription initiation and elongation, response to DNA damage, chromatin condensation(Conesa & Acker, 2010; Das et al., 2006; Garavís & Calvo, 2017; Hou et al., 2022), telomere maintenance(Dubois et al., 2025; Salgado et al., 2024) and rDNA transcription(Kaypee et al., 2025). SUB1 normally localizes throughout the nucleus in various cell lines, yet staining experiments show a moderate enrichment for the nucleolus (source: Human Protein Atlas; https://www.proteinatlas.org/ENSG00000113387-SUB1/subcellular)(Kaypee et al., 2025).”
“Several features of the response to EPB41L4A-AS1 resemble nucleolar stress, including altered distribution of NPM1(Potapova et al., 2023; Yang et al., 2016). SUB1 was shown to be involved in many nuclear processes, including transcription(Conesa & Acker, 2010), DNA damage response(Mortusewicz et al., 2008; Yu et al., 2016), telomere maintenance(Dubois et al., 2025), and nucleolar processes including rRNA biogenesis(Kaypee et al., 2025; Tafforeau et al., 2013). Our results suggest a complex and multi-faceted relationship between EPB41L4A-AS1 and SUB1, as SUB1 mRNA levels are reduced by the transient (72 hours) KD of the lncRNA (Fig. 3B), the distribution of the protein in the nucleus is altered (Fig. 5A and 5C), while the protein itself is the most prominent binder of the mature EPB41L4A-AS1 in ENCODE eCLIP data (Fig. 3A). The most striking connection between EPB41L4A-AS1 and SUB1 is the similar phenotype triggered by their loss (Fig. 4). We note that a recent study has shown that SUB1 is required for Pol I-mediated rDNA transcription in the nucleolus(Kaypee et al., 2025). In the presence of nucleolar SUB1, rDNA transcription proceeds as expected, but when SUB1 is depleted or its nucleolar localization is affected—by either sodium butyrate treatment or inhibition of KAT5-mediated phosphorylation at its lysine 35 (K35)—the levels of the 47S pre-rRNA are significantly reduced. In our settings, SUB1 enriches into the nucleolus following EPB41L4A-AS1 KD; thus, we might expect to see a slightly increased rDNA transcription or no effect at all, given that SUB1 localizes in the nucleolus in baseline conditions as well. It is however difficult to determine which of the connections between these two genes is the most functionally relevant and which may be indirect and/or feedback interactions. For example, it is possible that EPB41L4A-AS1 primarily acts as a transcriptional regulator of SUB1 mRNA, or that its RNA product is required for proper stability and/or localization of the SUB1 protein, or that EPB41L4A-AS1 acts as a scaffold for the formation of protein-protein interactions of SUB1.”
(11) Figure 8: The scratch assay alone cannot be used as a measure of increased invasion, and this phenotype must be confirmed with a transwell invasion or migration assay. Thus, I highly recommend that the authors conduct this experiment using the Boyden chamber. Do the authors see upregulation of N-cadherin, Vimentin, and downregulation of E-cadherin in their RNA-seq?
We agree with the reviewer that those phenotypes are complex and normally require multiple in vitro, as well as in vivo assays to be thoroughly characterized. However, we respectfully consider those as out of scope of the current work, which is more focused on RNA biology and the molecular characterization and functions of EPB41L4A-AS1.
Nevertheless, in Fig. 8D we show that the canonical EMT signature (taken from MSigDB) is upregulated in cells with reduced expression of EPB41L4A-AS1. Notably, EMT has been found to not possess an unique gene expression program, but it rather involves distinct and partially overlapping gene signatures (Youssef et al., 2024). In Fig. 8D, the most upregulated gene is TIMP3, a matrix metallopeptidase inhibitor linked to a particular EMT signature that is less invasive and more profibrotic (EMT-T2, (Youssef et al., 2024)). Interestingly, we observed a strong upregulation of other genes linked to EMT-T2, such as TIMP1, FOSB, SOX9, JUNB, JUN and KLF4, whereas MPP genes (linked to EMT-T1, which is highly proteolytic and invasive) are generally downregulated or not expressed. With regards to N- and E-cadherin, the first does not pass our cutoff to be considered expressed, and the latter is not significantly changing. Vimentin is also not significantly dysregulated. All these examples are reported, which were added as Fig. 8E:
The text has also been updated accordingly:
“These findings suggest that proper EPB41L4A-AS1 expression is required for cellular proliferation, whereas its deficiency results in the onset of more aggressive and migratory behavior, likely linked to the increase of the gene signature of epithelial to mesenchymal transition (EMT) (Fig. 8D). Because EMT is not characterized by a unique gene expression program and rather involves distinct and partially overlapping gene signatures (Youssef et al., 2024), we checked the expression level of marker genes linked to different types of EMTs (Fig. 8E). The most upregulated gene in Fig. 8D is TIMP3, a matrix metallopeptidase inhibitor linked to a particular EMT signature that is less invasive and more profibrotic (EMT-T2) (Youssef et al., 2024). Interestingly, we observed a stark upregulation of other genes linked to EMT-T2, such as TIMP1, FOSB, SOX9, JUNB, JUN and KLF4, whereas MPP genes (linked to EMT-T1, which is highly proteolytic and invasive) are generally downregulated or not expressed. This suggests that the downregulation of EPB41L4A-AS1 is primarily linked to a specific EMT program (EMT-T2), and future studies aimed at uncovering the exact mechanisms and relevance will shed light upon a possible therapeutic potential of this lncRNA.”
(12) Minor points:
(a) What could be the explanation for why only the EPB41L4A-AS1 locus has an effect on the neighbouring gene?
There might be multiple reasons why EPB41L4A-AS1 is able to modulate the expression of the neighboring genes. First, it is expressed from a TAD boundary exhibiting physical contacts with several genes in the two flanking TADs (Fig. 1F and 2A), placing it in the right spot to regulate their expression. Second, it is highly expressed when compared to most of the genes nearby, with transcription having been linked to the establishment and maintenance of TAD boundaries (Costea et al., 2023). Accordingly, the (partial) depletion of EPB41L4A-AS1 via GapmeRs transfection slightly reduces the contacts between the lncRNA and EPB41L4A loci (Fig. 2E and S4J), although this effect could also be determined by a premature transcription termination triggered by the GapmeRs.
There are a multitude of mechanisms by which lncRNAs with regulatory functions modulate the expression of one or more target genes in cis (Gil & Ulitsky, 2020), and our data do not unequivocally point to one of them. Distinguishing between these possibilities is a major challenge in the field and would be difficult to address in the context of this one study. It could be that the processive RNA polymerases at the EPB41L4A-AS1 locus are recruited to the neighboring loci, facilitated by the close proximity in the 3D space. It could also be possible that chromatin remodeling factors are recruited by the nascent RNA, and then promote and/or sustain the opening of chromatin at the target site. The latter possibility is intriguing, as this mechanism is proposed to be widespread among lncRNAs (Gil & Ulitsky, 2020; Oo et al., 2025) and we observed a significant reduction of H3K27ac levels at the EPB41L4A promoter region (Fig. 2D). Future studies combining chromatin profiling (e.g., CUT&RUN and ATAC-seq) and RNA pulldown experiments will shed light upon the exact mechanisms by which this lncRNA regulates the expression of target genes in cis and its interacting partners.
(b) The scale bar is missing on all the images in the Supplementary Figures as well.
The scale bars are present in the top-left figure of each panel. We acknowledge that due to the export as PNG, some figures (including those with microscopy images) display abnormal font sizes and aspect ratio. All images were created using consistent fonts, sizes and ratio, and are provided as high-quality PDF in the current submission.
(13) Methods:
The authors should double-check if they used sirn and LNA gapmers at 25 and 50um concentrations, as that is a huge dose. Most papers used these reagents in the range of 5-50nM maximum.
We apologize for the typo, the text has been fixed. We performed the experiments at 25 and 50nM, respectively, as suggested by the manufacturer’s protocol.
(14) Discussion:
Which cell lines were used in reference 27 (Cheng et al., 2024 Cell) to study the role of SNORA13? It may be useful to include this in the discussion.
We already mentioned the cell system in the discussion, and now we edited to include the specific cell line that was used:
“A recent study found that SNORA13 negatively regulates ribosome biogenesis in TERT-immortalized human fibroblasts (BJ-HRAS<Sup>G12V</sup>), by decreasing the incorporation of RPL23 into the maturing 60S ribosomal subunits, eventually triggering p53-mediated cellular senescence(Cheng et al., 2024).”
Reviewer #3 (Recommendations for the authors):
Major comments on weaknesses:
(1) The paper is quite disjointed:
(a) Figures1/2 studied the cis- and potential trans target genes altered by EPB41L4A-AS1 knockdown. They also showed some data about EPB41L4A-AS1 overlaps a strong chromatin boundary.
(b) Figures3/4/5 studied the role of SUB1 - as it is altered by EPB41L4A-AS1 knockdown - in affecting genes and snoRNAs, which may partially underlie the gene/snoRNA changes after EPB41L4A-AS1 knockdown.
(c) Figure 6 showed that EPB41L4A-AS1 knockdown did not directly affect SNORA13, the snoRNA located in the intron of EPB41L4A-AS1. Thus, the upregulation of many snoRNAs is not due to SNORA13.
(d) Figure 7 studied whether the changes of cis genes or snoRNAs are due to transcriptional stability.
(e) Figure 8 studied cellular phenotypes after EPB41L4A-AS1 knockdown.
These points are overly spread out and this dilutes the central theme of these results, which this Reviewer considered to be on cis or trans gene regulation by this lncRNA.The title of the paper implies EPB41L4A-AS1 knockdown affected trans target genes, but the paper did not focus on studying cis or trans effects, except briefly mentioning that many genes were changed in Figure 2. The many changes of snoRNAs are suggested to be partially explained by SUB1, but SUB1 itself is affected (>50%, Figure 3B) by EPB41L4A-AS1 knockdown, so it is unclear if these are mostly secondary changes due to SUB1 reduction. Given the current content of the paper, the authors do not have sufficient evidence to support that the changes of trans genes are due to direct effects or indirect effects. And so they are encouraged to revise their title to be more on snoRNA regulation, as this area took the majority of the efforts in this paper.
We respectfully disagree with the reviewer. We show that the effect on the proximal genes are cis-acting, as they are not rescued by exogenous expression, whereas the majority of the changes observed in the RNA-seq datasets appear to be indirect, and the snoRNA changes, that indeed might be indirect and not necessarily involve direct interaction partners of the lncRNA, such as SUB1, appear to be trans-regulated, as they can be rescued partially by exogenous expression of the lncRNA. We also show that KD of the main cis-regulated gene, EPB41L4A, results in a much milder transcriptional response, further solidifying the contribution of trans-acting effects. While we agree that the snoRNA effects are interesting, we do not consider them to be the main result, as they are accompanied by many additional changes in gene expression, and changes in the subnuclear distribution of the key nucleolar proteins, so it is difficult for us to claim that EPB41L4A-AS1 is specifically relevant to the snoRNAs rather than to the more broad nucleolar biology. Therefore, we prefer not to mention snoRNAs specifically in the title.
(2) EPB41L4A-AS1 knockdown caused ~2,364 gene changes. This is a very large amount of change on par with some transcriptional factors. It thus needs more scrutiny. First, on Page 9, second paragraph, the authors used|log2Fold-change| >0.41 to select differential genes, which is an unusual cutoff. What is the rationale? Often |log2Fold-change| >1 is more common. How many replicates are used? To examine how many gene changes are likely direct target genes, can the authors show how many of the cist-genes that are changed by EPB41L4A-AS1 knockdown have direct chromatin contacts with EPB41L4A-AS1 in HiC data? Is there any correlation between HiC contact with their fold changes? Without a clear explanation of cis target genes as direct target genes, it is more difficult to establish whether any trans target genes are directly affected by EPB41L4A-AS1 knockdown.
A |log<sub>2</sub>Fold-change| >0.41 equals a change of 33% or more, which together with an adjusted P < 0.05 is a threshold that has been used in the past. All RNA-seq experiments have been performed in triplicates, in line with the standards in the field. While it is possible that the EPB41L4A-AS1 establishes multiple contacts in trans—a process that has been observed in at least another lncRNA, namely Firre but involving its mature RNA product—we do believe this to be less likely that the alternative, namely that the > 2,000 DEGs are predominantly result from secondary changes rather than genes directly regulated by EPB41L4A-AS1 contacts.
In any case, we have inspected our UMI-4C data to identify other genes exhibiting higher contact frequencies than background levels, and thus, potentially regulated in cis. To this end, we calculated the UMI-4C coverage in a 10kb window centered around the TSS of the genes located on chromosome 5, which we subsequently normalized based on the distance from EPB41L4A-AS1, in order to account for the intrinsic higher DNA recovery the closer to the target DNA sequence. However, in our UMI-4C experiment we have employed baits targeting three different genes—EPB41L4A-AS1, EPB41L4A and STARD4—and therefore such approach assumes that the lncRNA locus has the most regulatory features in this region. As expected, we detected a strong negative correlation between the normalized coverage and the distance from the EPB41L4A-AS1 locus (⍴ = -0.51, p-value < 2.2e-16), and the genes in the two neighboring TADs exhibited the strongest association with the bait region (Author response image 5). The genes that we see are down-regulated in the adjacent TADs, namely NREP, MCC and MAN2A1 (Fig. 2F) show substantially higher contacts than background with the EPB41L4A-AS1 gene, thus potentially constituting additional cis-regulated targets of this lncRNA. We note that both SUB1 and NPM1 are located on chromosome 5 as well, albeit at distances exceeding 75 and 50 Mb, respectively, and they do not exhibit any striking association with the lncRNA locus.
Author response image 5.
UMI-4C coverage over the TSS of the genes located on chromosome 5. (A) Correlation between the normalized UMI-4C coverage over the TSS (± 5kb) of chromosome 5 genes and the absolute distance (in megabases, Mb) from EPB41L4A-AS1. (B) Same as in (A), but with the x axis showing the relative distance from EPB41L4A-AS1. In both cases, the genes in the two flanking TADs are colored in red and their names are reported.
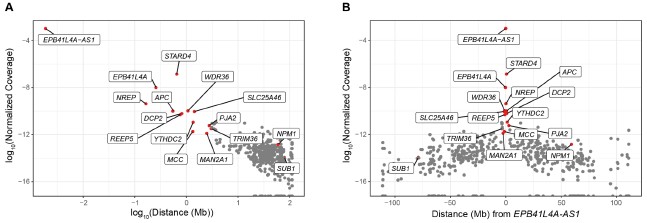
To increase the confidence in our RNA-seq data, we have now performed another round of polyA+ RNA-seq following EPB41L4A-AS1 knockdown using LNA1 or LNA2, as well as the previously used and an additional control GapmeR. The FPKMs of the control samples are highly-correlated both within replicates and between GapmeRs (Fig. S6A). More importantly, the fold-changes to control are highly correlated between the two on-target GapmeRs LNA1 and LNA2, regardless of the GapmeR used for normalization (Fig. S6B), thus showing that despite significant GapmeR-specific effects, the bulk of the response is shared and likely the direct result of the reduction in the levels of EPB41L4A-AS1. Notably, key targets NPM1 and MTREX (see discussion, Fig. S12A-C and comments to Reviewer 3) were found to be downregulated by both LNAs (Fig. S6C).
However, we acknowledge that some of the dysregulated genes are observed only when using one GapmeR and not the other, likely due to a combination of indirect, secondary and non-specific effects, and as such it is difficult without short time-course experiments (Much et al., 2024) to infer the direct response. Supporting this, LNA2 yielded a total of 1,069 DEGs (617 up and 452 down) and LNA1 2,493 DEGs (1,328 up and 1,287 down), with the latter triggering a stronger response most likely as a result of the previously mentioned CDKN1A/p21 induction. Overall, 45.1% of the upregulated genes following LNA2 transfection were shared with LNA1, in contrast to only the 24.3% of the downregulated ones.
We have now included these results in the Results section (see below) and in Supplementary Figure (Fig. S6).
“Most of the consequences of the depletion of EPB41L4A-AS1 are thus not directly explained by changes in EPB41L4A levels. An additional trans-acting function for EPB41L4A-AS1 would therefore be consistent with its high expression levels compared to most lncRNAs detected in MCF-7 (Fig. S5G). To strengthen these findings, we have transfected MCF-7 cells with LNA1 and a second control GapmeR (NT2), as well as the previous one (NT1) and LNA2, and sequenced the polyadenylated RNA fraction as before. Notably, the expression levels (in FPKMs) of the replicates of both control samples are highly correlated with each other (Fig. S6A), and the global transcriptomic changes triggered by the two EPB41L4A-AS1-targeting LNAs are largely concordant (Fig. S6B and S6C). Because of this concordance and the cleaner (i.e., no CDKN1A upregulation) readout in LNA2-transfected cells, we focused mainly on these cells for subsequent analyses.”
Figure 3B, SUB1 mRNA is reduced >half by EPB41L4A-AS1 KD. How much did SUB1 protein reduce after EPB41L4A-AS1 KD? Similarly, how much is the NPM1 protein reduced? If these two important proteins were affected by EPB41L4A-AS1 KD simultaneously, it is important to exclude how many of the 2,364 genes that changed after EPB41L4A-AS1 KD are due to the protein changes of these two key proteins. For SUB1, Figures S7E,F,G provided some answers. But NPM1 KD is also needed to fully understand such. Related to this, there are many other proteins perhaps changed in addition to SUB1 and NPM1, this renders it concerning how many of the EPB41L4A-AS1 KD-induced changes are directly caused by this RNA. In addition to the suggested study of cist targets, the alternative mechanism needs to be fully discussed in the paper as it remains difficult to fully conclude direct versus indirect effect due to such changes of key proteins or ncRNAs (such as snoRNAs or histone mRNAs).
As requested by both Reviewer #2 and #3, we have performed WB for SUB1, NPM1 and FBL following EPB41L4A-AS1 KD with two targeting (LNA1 and LNA2) and the previous control GapmeRs. Interestingly, we did not detect any significant downregulation of either proteins (Author response image 3), although this might be the result of the high variability observed in the control samples. Moreover, the short timeframe in which the experiments have been conducted━that is, transient transfections for 3 days━might not be sufficient time for the existing proteins to be degraded, and thus, the downregulation is more evident at the RNA (Fig. 3B and Supplementary Figure 6C) rather than protein level.
We acknowledge that many proteins might change simultaneously, and to pinpoint which ones act upstream of the plethora of indirect changes is extremely challenging when considering such large-scale changes in gene expression. In the case of SUB1 and NPM1━which were prioritized for their predicted binding to the lncRNA (Fig. 3A)━we show that the depletion of the former affects the latter in a similar way than that of the lncRNA (Fig. 5F). Moreover, snoRNAs changes are also similarly affected (as the reviewer pointed out, Fig. 4F), suggesting that at least this phenomenon is predominantly mediated by SUB1. Other effects might also be indirect consequences of cellular responses, such as the decrease in histone mRNAs (Fig. 4A) that might reflect the decrease in cellular replication (Fig. 8C) and cell cycle genes (Fig. 2I) (although a link between SUB1 and histone mRNA expression has been described (Brzek et al., 2018)).
Supporting the notion that additional proteins might be involved in driving the observed phenotypes, one of the genes that most consistently was affected by EPB41L4A-AS1 KD with GapmeRs is MTREX (also known as MTR4), that becomes downregulated at both the RNA and protein levels (now presented in the main text as Supplementary Figure 12). MTREX it’s part of the NEXT and PAXT complexes (Contreras et al., 2023), that target several short-lived RNAs for degradation, and the depletion of either MTREX or other complex members leads to the upregulation of such RNAs, that include PROMPTs, uaRNAs and eRNAs, among others. Given the lack in our understanding in snoRNA biogenesis from introns in mammalian systems(Monziani & Ulitsky, 2023), it is tempting to hypothesize a role for MTREX-containing complexes in trimming and degrading those introns and release the mature snoRNAs.
We updated the discussion section to include these observations:
“Beyond its site of transcription, EPB41L4A-AS1 associates with SUB1, an abundant protein linked to various functions, and these two players are required for proper distribution of various nuclear proteins. Their dysregulation results in large-scale changes in gene expression, including up-regulation of snoRNA expression, mostly through increased transcription of their hosts, and possibly through a somewhat impaired snoRNA processing and/or stability. To further hinder our efforts in discerning between these two possibilities, the exact molecular pathways involved in snoRNAs biogenesis, maturation and decay are still not completely understood. One of the genes that most consistently was affected by EPB41L4A-AS1 KD with GapmeRs is MTREX (also known as MTR4), that becomes downregulated at both the RNA and protein levels (Fig. S12A-C). Interestingly, MTREX it is part of the NEXT and PAXT complexes(Contreras et al., 2023), that target several short-lived RNAs for degradation, and the depletion of either MTREX or other complex members leads to the upregulation of such RNAs, that include PROMPTs, uaRNAs and eRNAs, among others. It is therefore tempting to hypothesize a role for MTREX-containing complexes in trimming and degrading those introns, and releasing the mature snoRNAs. Future studies specifically aimed at uncovering novel players in mammalian snoRNA biology will both conclusively elucidate whether MTREX is indeed involved in these processes.”
With regards to the changes in gene expression between the two LNAs, we provide a more detailed answer above and to the other reviewers as well.
(3) A Strong discrepancy of results by different approaches of knockdown or overexpression:
(a) CRISPRa versus LNA knockdown: Figure S4 - CRISPRa of EPB41L4A-AS1 did not affect EPB41L4A expression (Figure S4B). The authors should discuss how to interpret this result. Did CRISPRa not work to increase the nuclear/chromatin portion of EPB41L4A-AS1? Did CRISPRa of EPB41L4A-AS1 affect the gene in the upstream, the STARD4? Did CRISPRa of EPB41L4A-AS1 also affect chromatin interactions between EPB41L4A-AS1 and the EPB41L4A gene? If so, this may argue that chromatin interaction is not necessary for cis-gene regulation.
There are indeed several possible explanations, the most parsimonious is that since the lncRNA is already very highly transcribed, the relatively modest effect of additional transcription mediated by CRISPRa is not sufficient to elicit a measurable effect. For this reason, we did not check by UMI-4C the contact frequency between the lncRNA and EPB41L4A upon CRISPRa.
CRISPRa augments transcription at target loci, and thus, the nuclear and chromatin retention of EPB41L4A-AS1 are not expected to be affected. We did not check the expression of STARD4, because we focused on EPB41L4A which appears to be the main target locus according to Hi-C (Fig. 2A), UMI-4C (Fig. 2E and S4J) and GeneHancer (Fig. S1).
We already provide extensive evidence of a cis-regulation of EPB41L4A-AS1 over EPB41L4A, and show that EPB41L4A is lowly-expressed and likely has a limited role in our experimental settings. Thus, we respectfully propose that an in-deep exploration of the mechanism of action of this regulatory axis is out of scope of the current study, that instead focused more on the global effects of EPB41L4A-AS1 perturbation.
(b) Related to this, while CRISPRa alone did not show an effect, upon LNA knockdown of EPB41L4A-AS1, CRISPRa of EPB41L4A-AS1 can increase EPB41L4A expression. It is perplexing as to why, upon LNA treatment, CRISPRa will show an effect (Figure S4H)? Actually, Figures S4H and I are very confusing in the way they are currently presented. They will benefit from being separated into two panels (H into 2 and I into two). And for Ectopic expression, please show controls by empty vector versus EPB41L4A-AS1, and for CRISPRa, please show sgRNA pool versus sgRNA control.
The results are consistent with the parsimonious assumption mentioned above that the high transcription of the lncRNA at baseline is sufficient for maximal positive regulation of EPB41L4A, and that upon KD, the reduced transcription and/or RNA levels are no longer at saturating levels, and so CRISPRa can have an effect. We now mention this interpretation in the text:
“Levels of EPB41L4A were not affected by increased expression of EPB41L4A-AS1 from the endogenous locus by CRISPR activation (CRISPRa), nor by its exogenous expression from a plasmid (Fig. S4B and S4C). The former suggests that endogenous levels of EPB41L4A-AS1—that are far greater than those of EPB41L4A—are sufficient to sustain the maximal expression of this target gene in MCF7 cells.”
We apologize for the confusion regarding the control used in the rescue experiments in Fig. S4H and S4I. The “-” in the Ectopic overexpression and CRISPRa correspond to the Empty Vector and sgControl, respectively, and not the absence of any vector. We changed the text in the figure legends:
“(H) Changes in EPB41L4A-AS1 expression after rescuing EPB41L4A-AS1 with an ectopic plasmid or CRISPRa following its KD with GapmeRs. In both panels (Ectopic OE and CRISPRa) the “-” samples represent those transfected with the Empty Vector or sgControl. Asterisks indicate significance relative to the –/– control (transfected with both the control GapmeR and vector). (I) Same as in (H), but for changes in EPB41L4A expression.”
(c) siRNA versus LNA knockdown: Figure S3A showed that siRNA KD of EPB41L4A-AS1 does not affect EPB41L4A expression. How to understand this data versus LNA?
As explained in the text, siRNA-mediated KD presumably affects mostly the cytoplasmic pool of EPB41L4A-AS1 and not the nuclear one, which we assume explains the different effects of the two perturbations, as observed for other lncRNAs (e.g., (Ntini et al., 2018)). However, we acknowledge that we do not know what aspect of the nuclear RNA biology is relevant, let it be the nascent EPB41L4A-AS1 transcription, premature transcriptional termination or even the nuclear pool of this lncRNA, and this can be elucidated further in future studies.
(d) EPB41L4A-AS1 OE versus LNA knockdown: Figure 6F showed that EPB41L4A-AS1 OE caused reduction of EPB41L4A mRNA, particularly at 24hr. How to interpret that both LNA KD and OE of EPB41L4A-AS1 reduce the expression of EPB41L4A mRNA?
We do not believe that the OE of EPB41L4A-AS1, and in particular the one elicited by an ectopic plasmid affects EPB41L4A RNA levels. In the experiment in Fig. 6F, EPB41L4A relative expression at 24h is ~0.65 (please note the log<sub>2</sub> scale in the graph), which is significant as reported. However, throughout this study (and as shown in Fig. S4C for the ectopic and Fig. S4B for the CRISPRa overexpression, respectively), we observed no such behavior, suggesting that the effect reported in Fig. 6F is the result of either that particular setting, and unlikely to reflect a general phenomenon.
(e) Did any of the effects on snoRNAs or trans target genes after EPB41L4A-AS1 knockdown still appear by CRISPRa?
As mentioned above, we did a limited number of experiments after CRISPRa, prompted by the fact that endogenous levels of EPB41L4A-AS1 are already high enough to sustain its functions. Pushing the expression even higher will likely result in no or artifactual effects, which is why we respectfully propose such experiments are not essential in this current work, which instead mostly relies on loss-of-function experiments.
For issue 3, extensive data repetition using all these methods may be unrealistic, but key data discrepancy needs to be fully discussed and interpreted.
Other comments on weakness:
(1) This manuscript will benefit from having line numbers so comments from Reviewers can be made more specifically.
We added line numbers as suggested by the reviewer.
(2) Figure 2G, to distinguish if any effects of EPB41L4A-AS1 come from the cytoplasmic or nuclear portion of EPB41L4A-AS1, an siRNA KD RNA-seq will help to filter out the genes affected by EPB41L4A-AS1 in the cytoplasm, as siRNA likely mainly acts in the cytoplasm.
This experiment would be difficult to interpret as while the siRNAs mostly deplete the cytoplasmic pool of their target, they can have some effects in the nucleus as well (e.g., (Sarshad et al., 2018)) and so siRNAs knockdown will not necessarily report strictly on the cytoplasmic functions.
(3) Figure 2H, LNA knockdown of EPB41L4A should check the protein level reduction, is it similar to the change caused by knockdown of EPB41L4A-AS1?
As suggested by reviewer #2, we have now replaced the EPB41L4A Western Blot that now shows the results with both LNA1 and LNA2. Please note that the previous Fig. 2C was a subset of this, i.e., we have previously cropped the results obtained with LNA1. Unfortunately, we did not have sufficient antibody to check for EPB41L4A protein reduction following LNA KD of EPB41L4A in a timely manner.
(4) There are two LNA Gapmers used by the paper to knock down EPB41L4A-AS1, but some figures used LNA1, some used LNA2, preventing a consistent interpretation of the results. For example, in Figures 2A-D, LNA2 was used. But in Figures 2E-H, LNA1 was used. How consistent are the two in changing histone H3K27ac (like in Figure 2D) versus gene expression in RNA-seq? The changes in chromatin interaction appear to be weaker by LNA2 (Figure S4J) versus LNA1 (Figure 2E).
As explained above and in response to Reviewer #1, we now provide more RNA-seq data for LNA1 and LNA2. We note that besides the unwanted and/or off-target effects, these two GapmeRs might be not equally effective in knocking down EPB41L4A-AS1, which could explain why LNA1 seems to have a stronger effect on chromatin than LNA2. Nonetheless, when we have employed both we have obtained similar and consistent results (e.g., Fig. 5A-D and 8A-C), suggesting that these and the other effects are indeed on target effects due to EPB41L4A-AS1 depletion.
(5) It will be helpful if the authors provide information on how long they conducted EPB41L4A-AS1 knockdown for most experiments to help discern direct or indirect effects.
The length of all perturbations was indicated in the Methods section, and we now mention them also in the Results. Unless specified otherwise, they were carried out for 72 hours. We agree with the reviewer that having time course experiments can have added value, but due to the extensive effort that these will require, we suggest that they are out of scope of the current study.
(6) In Figures 1C and F, the authors showed results about EPB41L4A-AS1 overlapping a strong chromatin boundary. But these are not mentioned anymore in the later part of the paper. Does this imply any mechanism? Does EPB41L4A-AS1 knockdown or OE, or CRISPRa affect the expression of genes near the other interacting site, STARD4? Do genes located in the two adjacent TADs change more strongly as compared to other genes far away?
We discuss this point in the Discussion section:
“At the site of its own transcription, which overlaps a strong TAD boundary, EPB41L4A-AS1 is required to maintain expression of several adjacent genes, regulated at the level of transcription. Strikingly, the promoter of EPB41L4A-AS1 ranks in the 99.8th percentile of the strongest TAD boundaries in human H1 embryonic stem cells(Open2C et al., 2024; Salnikov et al., 2024). It features several CTCF binding sites (Fig. 2A), and in MCF-7 cells, we demonstrate that it blocks the propagation of the 4C signal between the two flanking TADSs (Fig. 1F). Future studies will help elucidate how EPB41L4A-AS1 transcription and/or the RNA product regulate this boundary. So far, we found that EPB41L4A-AS1 did not affect CTCF binding to the boundary, and while some peaks in the vicinity of EPB41L4A-AS1 were significantly affected by its loss, they did not appear to be found near genes that were dysregulated by its KD (Fig. S11C). We also found that KD of EPB41L4A-AS1—which depletes the RNA product, but may also affect the nascent RNA transcription(Lai et al., 2020; Lee & Mendell, 2020)—reduces the spatial contacts between the TAD boundary and the EPB41L4A promoter (Fig. 2E). Further elucidation of the exact functional entity needed for the cis-acting regulation will require detailed genetic perturbations of the locus, that are difficult to carry out in the polypoid MCF-7 cells, without affecting other functional elements of this locus or cell survival as we were unable to generate deletion clones despite several attempts.”
As mentioned in the text (pasted below) and in Fig. 2F, most genes in the two flanking TADs become downregulated following EPB41L4A-AS1 KD. While STARD4 – which was chosen because it had spatial contacts above background with EPB41L4A-AS1 – did not reach statistical significance, others did and are highlighted. Those included NREP, which we also discuss:
“Consistently with the RT-qPCR data, KD of EPB41L4A-AS1 reduced EPB41L4A expression, and also reduced expression of several, but not all other genes in the TADs flanking the lncRNA (Fig. 2F).Based on these data, EPB41L4A-AS1 is a significant cis-acting activator according to TransCistor (Dhaka et al., 2024) (P=0.005 using the digital mode). The cis-regulated genes reduced by EPB41L4A-AS1 KD included NREP, a gene important for brain development, whose homolog was downregulated by genetic manipulations of regions homologous to the lncRNA locus in mice(Salnikov et al., 2024). Depletion of EPB41L4A-AS1 thus affects several genes in its vicinity.”
(7) Related to the description of SUB1 regulation of genes are DNA and RNA levels: "Of these genes, transcripts of only 56 genes were also bound by SUB1 at the RNA level, suggesting largely distinct sets of genes targeted by SUB1 at both the DNA and the RNA levels." SUB1 binding to chromatin by Cut&Run only indicates that it is close to DNA/chromatin, and this interaction with chromatin may still likely be mediated by RNAs. The authors used SUB1 binding sites in eCLIP-seq to suggest whether it acts via RNAs, but these binding sites are often from highly expressed gene mRNAs/exons. Standard analysis may not have examined low-abundance RNAs close to the gene promoters, such as promoter antisense RNAs. The authors can examine whether, for the promoters with cut&run peaks of SUB1, SUB1 eCLIP-seq shows binding to the low-abundance nascent RNAs near these promoters.
In response to a related comment by Reviewer 1, we now show that when considering expression level–matched control genes, knockdown of EPB41L4A-AS1 still significantly affects expression of SUB1 targets over controls. The results are presented in Supplementary Figure 7 (Fig. S7C).
Based on this analysis, while there is a tendency of increased expression with increased SUB1 binding, when controlling for expression levels the effect of down-regulation of SUB1-bound RNAs upon lncRNA knockdown remains, suggesting that it is not merely a confounding effect. We have updated the text as follows:
“We hypothesized that loss of EPB41L4A-AS1 might affect SUB1, either via the reduction in its expression or by affecting its functions. We stratified SUB1 eCLIP targets into confidence intervals, based on the number, strength and confidence of the reported binding sites. Indeed, eCLIP targets of SUB1 (from HepG2 cells profiled by ENCODE) were significantly downregulated following. EPB41L4A-AS1 KD in MCF-7, with more confident targets experiencing stronger downregulation (Fig. 3C). Importantly, this still holds true when controlling for gene expression levels (Fig. S7C), suggesting that this negative trend is not due to differences in their baseline expression.”
(8) Figure 8, the cellular phenotype is interesting. As EPB41L4A-AS1 is quite widely expressed, did it affect the phenotypes similarly in other breast cancer cells? MCF7 is not a particularly relevant metastasis model. Can a similar phenotype be seen in commonly used metastatic cell models such as MDA-MB-231?
We agree that further expanding the models in which EPB41L4A-AS1 affects cellular proliferation, migration and any other relevant phenotype is of potential interest before considering targeting this lncRNA as a therapeutic approach. However, given that 1) others have already identified similar phenotypes upon the modulation of EPB41L4A-AS1 in a variety of different systems (see Results and Discussion), and 2) we were most interested in the molecular consequences following the loss of this lncRNA, we respectfully suggest that these experiments are out of scope of the current study.
References
Bahar Halpern, K., Caspi, I., Lemze, D., Levy, M., Landen, S., Elinav, E., Ulitsky, I., & Itzkovitz, S. (2015). Nuclear Retention of mRNA in Mammalian Tissues. Cell Reports, 13(12), 2653–2662.
Brabletz, T., Kalluri, R., Nieto, M. A., & Weinberg, R. A. (2018). EMT in cancer. Nature Reviews. Cancer, 18(2), 128–134.
Brzek, A., Cichocka, M., Dolata, J., Juzwa, W., Schümperli, D., & Raczynska, K. D. (2018). Positive cofactor 4 (PC4) contributes to the regulation of replication-dependent canonical histone gene expression. BMC Molecular Biology, 19(1), 9.
Cheng, Y., Wang, S., Zhang, H., Lee, J.-S., Ni, C., Guo, J., Chen, E., Wang, S., Acharya, A., Chang, T.-C., Buszczak, M., Zhu, H., & Mendell, J. T. (2024). A non-canonical role for a small nucleolar RNA in ribosome biogenesis and senescence. Cell, 187(17), 4770–4789.e23.
Conesa, C., & Acker, J. (2010). Sub1/PC4 a chromatin associated protein with multiple functions in transcription. RNA Biology, 7(3), 287–290.
Contreras, X., Depierre, D., Akkawi, C., Srbic, M., Helsmoortel, M., Nogaret, M., LeHars, M., Salifou, K., Heurteau, A., Cuvier, O., & Kiernan, R. (2023). PAPγ associates with PAXT nuclear exosome to control the abundance of PROMPT ncRNAs. Nature Communications, 14(1), 6745.
Costea, J., Schoeberl, U. E., Malzl, D., von der Linde, M., Fitz, J., Gupta, A., Makharova, M., Goloborodko, A., & Pavri, R. (2023). A de novo transcription-dependent TAD boundary underpins critical multiway interactions during antibody class switch recombination. Molecular Cell, 83(5), 681–697.e7.
Das, C., Hizume, K., Batta, K., Kumar, B. R. P., Gadad, S. S., Ganguly, S., Lorain, S., Verreault, A., Sadhale, P. P., Takeyasu, K., & Kundu, T. K. (2006). Transcriptional coactivator PC4, a chromatin-associated protein, induces chromatin condensation. Molecular and Cellular Biology, 26(22), 8303–8315.
Dhaka, B., Zimmerli, M., Hanhart, D., Moser, M. B., Guillen-Ramirez, H., Mishra, S., Esposito, R., Polidori, T., Widmer, M., García-Pérez, R., Julio, M. K., Pervouchine, D., Melé, M., Chouvardas, P., & Johnson, R. (2024). Functional identification of cis-regulatory long noncoding RNAs at controlled false discovery rates. Nucleic Acids Research, 52(6), 2821–2835.
Didiot, M.-C., Ferguson, C. M., Ly, S., Coles, A. H., Smith, A. O., Bicknell, A. A., Hall, L. M., Sapp, E., Echeverria, D., Pai, A. A., DiFiglia, M., Moore, M. J., Hayward, L. J., Aronin, N., & Khvorova, A. (2018). Nuclear Localization of Huntingtin mRNA Is Specific to Cells of Neuronal Origin. Cell Reports, 24(10), 2553–2560.e5.
Dongre, A., & Weinberg, R. A. (2019). New insights into the mechanisms of epithelial-mesenchymal transition and implications for cancer. Nature Reviews. Molecular Cell Biology, 20(2), 69–84.
Dubois, J.-C., Bonnell, E., Filion, A., Frion, J., Zimmer, S., Riaz Khan, M., Teplitz, G. M., Casimir, L., Méthot, É., Marois, I., Idrissou, M., Jacques, P.-É., Wellinger, R. J., & Maréchal, A. (2025). The single-stranded DNA-binding factor SUB1/PC4 alleviates replication stress at telomeres and is a vulnerability of ALT cancer cells. Proceedings of the National Academy of Sciences of the United States of America, 122(2), e2419712122.
Garavís, M., & Calvo, O. (2017). Sub1/PC4, a multifaceted factor: from transcription to genome stability. Current Genetics, 63(6), 1023–1035.
Gil, N., & Ulitsky, I. (2020). Regulation of gene expression by cis-acting long non-coding RNAs. Nature Reviews. Genetics, 21(2), 102–117.
Hou, Y., Gan, T., Fang, T., Zhao, Y., Luo, Q., Liu, X., Qi, L., Zhang, Y., Jia, F., Han, J., Li, S., Wang, S., & Wang, F. (2022). G-quadruplex inducer/stabilizer pyridostatin targets SUB1 to promote cytotoxicity of a transplatinum complex. Nucleic Acids Research, 50(6), 3070–3082.
Jan, C. H., Friedman, R. C., Ruby, J. G., & Bartel, D. P. (2011). Formation, regulation and evolution of Caenorhabditis elegans 3’UTRs. Nature, 469(7328), 97–101.
Kaypee, S., Ochiai, K., Shima, H., Matsumoto, M., Alam, M., Ikura, T., Kundu, T. K., & Igarashi, K. (2025). Positive coactivator PC4 shows dynamic nucleolar distribution required for rDNA transcription and protein synthesis. Cell Communication and Signaling : CCS, 23(1), 283.
Lai, F., Damle, S. S., Ling, K. K., & Rigo, F. (2020). Directed RNase H Cleavage of Nascent Transcripts Causes Transcription Termination. Molecular Cell, 77(5), 1032–1043.e4.
Lee, J.-S., & Mendell, J. T. (2020). Antisense-Mediated Transcript Knockdown Triggers Premature Transcription Termination. Molecular Cell, 77(5), 1044–1054.e3.
Lubelsky, Y., & Ulitsky, I. (2018). Sequences enriched in Alu repeats drive nuclear localization of long RNAs in human cells. Nature, 555(7694), 107–111.
Ly, S., Didiot, M.-C., Ferguson, C. M., Coles, A. H., Miller, R., Chase, K., Echeverria, D., Wang, F., Sadri-Vakili, G., Aronin, N., & Khvorova, A. (2022). Mutant huntingtin messenger RNA forms neuronal nuclear clusters in rodent and human brains. Brain Communications, 4(6), fcac248.
Maranon, D. G., & Wilusz, J. (2020). Mind the Gapmer: Implications of Co-transcriptional Cleavage by Antisense Oligonucleotides. Molecular Cell, 77(5), 932–933.
Monziani, A., & Ulitsky, I. (2023). Noncoding snoRNA host genes are a distinct subclass of long noncoding RNAs. Trends in Genetics : TIG, 39(12), 908–923.
Mortusewicz, O., Roth, W., Li, N., Cardoso, M. C., Meisterernst, M., & Leonhardt, H. (2008). Recruitment of RNA polymerase II cofactor PC4 to DNA damage sites. The Journal of Cell Biology, 183(5), 769–776.
Much, C., Lasda, E. L., Pereira, I. T., Vallery, T. K., Ramirez, D., Lewandowski, J. P., Dowell, R. D., Smallegan, M. J., & Rinn, J. L. (2024). The temporal dynamics of lncRNA Firre-mediated epigenetic and transcriptional regulation. Nature Communications, 15(1), 6821.
Ntini, E., Louloupi, A., Liz, J., Muino, J. M., Marsico, A., & Ørom, U. A. V. (2018). Long ncRNA A-ROD activates its target gene DKK1 at its release from chromatin. Nature Communications, 9(1), 1636.
Oo, J. A., Warwick, T., Pálfi, K., Lam, F., McNicoll, F., Prieto-Garcia, C., Günther, S., Cao, C., Zhou, YGavrilov, A. A., Razin, S. V., Cabrera-Orefice, A., Wittig, I., Pullamsetti, S. S., Kurian, L., Gilsbach, R., Schulz, M. H., Dikic, I., Müller-McNicoll, M., … Leisegang, M. S. (2025). Long non-coding RNAs direct the SWI/SNF complex to cell type-specific enhancers. Nature Communications, 16(1), 131.
Open2C, Abdennur, N., Abraham, S., Fudenberg, G., Flyamer, I. M., Galitsyna, A. A., Goloborodko, A., Imakaev, M., Oksuz, B. A., Venev, S. V., & Xiao, Y. (2024). Cooltools: Enabling high-resolution Hi-C analysis in Python. PLoS Computational Biology, 20(5), e1012067.
Potapova, T. A., Unruh, J. R., Conkright-Fincham, J., Banks, C. A. S., Florens, L., Schneider, D. A., & Gerton, J. L. (2023). Distinct states of nucleolar stress induced by anticancer drugs. https://doi.org/10.7554/eLife.88799.
Ray, D., Laverty, K. U., Jolma, A., Nie, K., Samson, R., Pour, S. E., Tam, C. L., von Krosigk, N., Nabeel-Shah, S., Albu, M., Zheng, H., Perron, G., Lee, H., Najafabadi, H., Blencowe, B., Greenblatt, J., Morris, Q., & Hughes, T. R. (2023). RNA-binding proteins that lack canonical RNA-binding domains are rarely sequence-specific. Scientific Reports, 13(1), 5238.
Salgado, S., Abreu, P. L., Moleirinho, B., Guedes, D. S., Larcombe, L., & Azzalin, C. M. (2024). Human PC4 supports telomere stability and viability in cells utilizing the alternative lengthening of telomeres mechanism. EMBO Reports, 25(12), 5294–5315.
Salnikov, P., Korablev, A., Serova, I., Belokopytova, P., Yan, A., Stepanchuk, Y., Tikhomirov, S., & Fishman, V. (2024). Structural variants in the Epb41l4a locus: TAD disruption and Nrep gene misregulation as hypothetical drivers of neurodevelopmental outcomes. Scientific Reports, 14(1), 5288.
Sarshad, A. A., Juan, A. H., Muler, A. I. C., Anastasakis, D. G., Wang, X., Genzor, P., Feng, X., Tsai, P.-F., Sun, H.-W., Haase, A. D., Sartorelli, V., & Hafner, M. (2018). Argonaute-miRNA Complexes Silence Target mRNAs in the Nucleus of Mammalian Stem Cells. Molecular Cell, 71(6), 1040–1050.e8.
Tafforeau, L., Zorbas, C., Langhendries, J.-L., Mullineux, S.-T., Stamatopoulou, V., Mullier, R., Wacheul, L., & Lafontaine, D. L. J. (2013). The complexity of human ribosome biogenesis revealed by systematic nucleolar screening of Pre-rRNA processing factors. Molecular Cell, 51(4), 539–551.
Unfried, J. P., & Ulitsky, I. (2022). Substoichiometric action of long noncoding RNAs. Nature Cell Biology, 24(5), 608–615.
Van Nostrand, E. L., Freese, P., Pratt, G. A., Wang, X., Wei, X., Xiao, R., Blue, S. M., Chen, J.-Y.,Cody, N. A. L., Dominguez, D., Olson, S., Sundararaman, B., Zhan, L., Bazile, C., Bouvrette, L. P. B., Bergalet, J., Duff, M. O., Garcia, K. E., Gelboin-Burkhart, C., … Yeo, G. W. (2020). A large-scale binding and functional map of human RNA-binding proteins. Nature, 583(7818), 711–719.
Yang, K., Wang, M., Zhao, Y., Sun, X., Yang, Y., Li, X., Zhou, A., Chu, H., Zhou, H., Xu, J., Wu, M., Yang, J., & Yi, J. (2016). A redox mechanism underlying nucleolar stress sensing by nucleophosmin. Nature Communications, 7, 13599.
Youssef, K. K., Narwade, N., Arcas, A., Marquez-Galera, A., Jiménez-Castaño, R., Lopez-Blau, C., Fazilaty, H., García-Gutierrez, D., Cano, A., Galcerán, J., Moreno-Bueno, G., Lopez-Atalaya, J. P., & Nieto, M. A. (2024). Two distinct epithelial-to-mesenchymal transition programs control invasion and inflammation in segregated tumor cell populations. Nature Cancer, 5(11), 1660–1680.
Yu, L., Ma, H., Ji, X., & Volkert, M. R. (2016). The Sub1 nuclear protein protects DNA from oxidative damage. Molecular and Cellular Biochemistry, 412(1-2), 165–171.
Masculinisme : Synthèse du Péril Sexiste et de ses Enjeux
Ce document de synthèse analyse le phénomène du masculinisme, identifié comme une idéologie politique et sociale structurée, dont la propagation est considérablement amplifiée par les plateformes numériques.
Défini comme la "mise en pratique concrète de l'antiféminisme", le masculinisme ne se limite pas à des propos sexistes isolés mais constitue un mouvement organisé visant à faire régresser les droits des femmes et des minorités de genre.
La discussion met en lumière une menace grandissante, illustrée par de multiples tentatives d'attentats déjouées en France ces dernières années, qualifiant ce phénomène de "terrorisme masculiniste".
Le débat oppose deux visions principales : d'une part, celle qui considère le masculinisme comme une dérive sectaire dangereuse et en pleine expansion, s'appuyant sur des données chiffrées issues du Haut Conseil à l'Égalité ; d'autre part, une perspective plus nuancée qui alerte sur le caractère flou du terme, le risque de généralisation abusive et la nécessité de comprendre les angoisses et les pressions sociales qui pèsent sur certains hommes.
Face à ce péril, les solutions proposées s'articulent autour d'un double axe : un volet répressif incluant la formation des forces de l'ordre et la régulation des contenus en ligne, et un volet préventif centré sur l'éducation à la vie affective et sexuelle dès l'école.
--------------------------------------------------------------------------------
Le masculinisme est présenté non pas comme une opinion personnelle mais comme un mouvement politique et social organisé.
Il est défini par Pauline Ferrari, auditionnée au Sénat, comme "un mouvement social et politique de mise en pratique concrète de l'antiféminisme".
Il se distingue du sexisme ordinaire par son intention active de "faire régresser les droits des femmes et des minorités de genre, pour tenter de les humilier, pour tenter de les silencier".
Historiquement, le terme "masculinisme" est presque aussi ancien que celui de "féminisme" et apparaît dès le XIXe siècle comme une réaction directe aux avancées des droits des femmes.
Céline Piques rappelle que des mouvements masculinistes plus structurés, tels que ceux revendiquant les "droits des pères", ont émergé dans les années 1980, accusant la justice d'être partiale envers les femmes.
Le rapport du Haut Conseil à l'Égalité (HCE) distingue deux types de sexisme :
• Le sexisme paternaliste : Moins ouvertement violent, il infériorise les femmes en considérant que l'égalité est atteinte et que chacun doit conserver son rôle traditionnel (sphère domestique pour les femmes, professionnelle pour les hommes).
• Le sexisme hostile : Un sexisme virulent qui légitime la violence contre les femmes et les enfants et réaffirme la suprématie masculine. Le masculinisme est classé dans cette catégorie.
Le masculinisme est décrit comme une "nébuleuse" regroupant diverses communautés, souvent actives en ligne :
• Les Incels ("célibataires involontaires") : Hommes qui se considèrent célibataires contre leur gré et en rendent les femmes responsables. Ils sont souvent décrits comme étant en détresse psychique et personnelle.
• Les MGTOW ("Men Going Their Own Way") : Prônent le retrait total des relations avec les femmes.
• Les "Mâles Alpha" : Influencés par des coachs en séduction, ils promeuvent un modèle de domination. Leurs techniques sont décrites comme des stratégies de coercition et de mise sous emprise, qualifiées de "stratégie de l'agresseur" par les associations féministes.
L'influenceur Andrew Tate, poursuivi pour proxénétisme et trafic d'êtres humains, est cité comme un exemple emblématique de ce mouvement.
Le rapport du HCE sur l'état du sexisme en France révèle des chiffres jugés "sidérants" qui témoignent d'une réaction à l'avancée du féminisme, notamment depuis le mouvement #MeToo.
| Indicateur | Pourcentage d'hommes | Pourcentage de femmes | | --- | --- | --- | | Le féminisme menace la place et le rôle des hommes | 39 % | 25 % | | Les féministes veulent que les femmes aient plus de pouvoir que les hommes | 60 % | \- | | Les féministes ont des demandes exagérées envers les hommes | 60 % | \- | | La justice est plus favorable aux femmes qu'aux hommes | 64 % | \- |
Ces chiffres sont interprétés comme le reflet d'une "position très victimaire" des masculinistes, qui perçoivent une prise de pouvoir des femmes alors que les féministes revendiquent l'égalité d'accès au pouvoir.
Le rapport met en évidence une mauvaise compréhension de l'autonomie sexuelle des femmes :
• 24 % des hommes considèrent normal qu'une femme accepte un rapport sexuel par devoir ou pour faire plaisir.
• 15 % des hommes estiment qu'une femme agressée sexuellement peut être en partie responsable.
• 26 % des hommes avouent avoir déjà douté du consentement de leur partenaire, bien que 93 % affirment savoir que "non c'est non".
Ces données illustrent la persistance de l'idée d'un "privilège des hommes à accéder au corps des femmes librement".
Les réseaux sociaux jouent un rôle crucial dans la croissance et la radicalisation des mouvements masculinistes.
• Propagation rapide : Il ne faudrait que 27 minutes sur une plateforme comme TikTok pour qu'un jeune s'intéressant à des contenus anodins (ex: conseils de drague) soit redirigé par les algorithmes vers des contenus masculinistes.
• Cyberharcèlement ciblé : Les femmes, en particulier les personnalités politiques (comme Sandrine Rousseau) ou les joueuses de jeux vidéo utilisant un pseudo féminin, subissent un cyberharcèlement d'une violence qu'un homme ne subirait pas pour les mêmes propos ou actions.
• Création de communautés : Des documentaires montrent l'existence de communautés en ligne regroupant 2000 à 3000 hommes.
Le discours masculiniste est directement lié à des actes de violence extrême, qualifiés de "terrorisme masculiniste".
Au cours des 14 derniers mois, trois arrestations majeures ont eu lieu en France en lien avec la mouvance masculiniste, toutes concernant des jeunes hommes de 17 à 26 ans :
• Juin 2023 (Saint-Étienne) : Un lycéen de 18 ans, se proclamant masculiniste, est arrêté près de son lycée. Il portait deux couteaux et une liste de prénoms de quatre filles de sa classe. Le Parquet National Antiterroriste (PNAT) s'est saisi de l'affaire.
• 2024-2025 (Bordeaux et Ancenis) : Deux jeunes hommes appartenant au groupe des Incels sont arrêtés après des signalements sur la plateforme Pharos, suspectés de vouloir tuer des femmes.
Plusieurs tueries de masse ont été commises par des hommes se réclamant explicitement du masculinisme ou de la communauté Incel :
• 1989 (Montréal, Canada) : Marc Lépine tue 14 femmes à l'École Polytechnique, après avoir séparé les hommes des femmes. Dans sa lettre de suicide, il accuse les féministes de lui avoir "gâché la vie".
• 2014 (Isla Vista, États-Unis) : Elliot Rodger tue plusieurs personnes après avoir publié un manifeste de 140 pages et une vidéo appelant à tuer les femmes. Il est devenu une figure de référence pour les Incels.
• 2021 (Plymouth, Royaume-Uni) : Un jeune homme de 23 ans tue cinq personnes, dont sa mère, avant de se suicider.
Le débat a également fait émerger des critiques et des mises en garde contre une approche trop univoque du phénomène.
Peggy Sastre et Jean-Sébastien Ferjou soulignent que le terme "masculinisme" est "flou", "nébuleux" et "mal circonscrit".
Ils mettent en garde contre le risque d'amalgamer des discours violents avec des critiques légitimes de certaines formes de féminisme.
La question "le féminisme menace-t-il les hommes ?" serait trop simpliste, la réponse pouvant varier selon que l'on se réfère à Élisabeth Badinter ou à Sandrine Rousseau.
Une étude menée en Nouvelle-Zélande sur plus de 15 800 hommes est citée pour nuancer l'idée d'une toxicité généralisée du masculin :
• Seulement 3 % des hommes y sont décrits comme "véritablement hostiles et agressifs".
• 8 % ont une attitude "bienveillante mais paternaliste".
• 89 % (35 % "totalement non toxiques" et 54 % avec des préjugés "modérés") ne relèvent pas de la masculinité destructrice.
L'étude suggère que les hommes les plus "toxiques" ne sont pas les plus affirmés dans leur masculinité, mais plutôt les hommes fragilisés par le chômage, l'isolement social ou le manque d'éducation.
Un argument avancé est que les discours masculinistes trouvent un écho car ils résonnent avec des réalités vécues par les jeunes hommes.
Il existerait une "injonction contradictoire" entre un discours sociétal d'égalité et des comportements sociaux (notamment sur les sites de rencontre) où les femmes continueraient de privilégier les hommes "plus beaux, plus forts et plus riches".
Face à cette menace, deux axes d'action principaux sont envisagés.
• Formation des forces de l'ordre : Il est jugé nécessaire de former davantage les policiers et les magistrats à la détection du contrôle coercitif, une technique enseignée par les influenceurs masculinistes.
Bien que cette formation commence, elle n'intègre pas encore systématiquement l'analyse de l'idéologie sous-jacente.
• Surveillance et régulation : La plateforme gouvernementale Pharos est active dans la détection des menaces, mais ses moyens sont jugés insuffisants.
Une régulation plus stricte du numérique est demandée pour obtenir le retrait des contenus faisant l'apologie de crimes (comme le viol) ou constituant des provocations à la haine, en accord avec les limites de la liberté d'expression.
• Éducation à l'école : L'éducation à la vie affective, relationnelle et sexuelle est considérée comme un levier central de prévention.
La loi prévoyant trois séances par an dans toutes les classes n'est toujours pas pleinement appliquée.
• Cibler les causes : Il est suggéré de s'attaquer aux racines du mal-être qui rendent les jeunes hommes vulnérables à ces idéologies, notamment en aidant ceux qui sont isolés ou en manque d'éducation, plutôt que d'adopter des discours qui pourraient aliéner la majorité des hommes.
y[1] v[1];P{GawB}elavC155 w*
DOI: 10.3390/cells11060970
Resource: Bloomington Drosophila Stock Center (RRID:SCR_006457)
Curator: @bdscstockkeepers
SciCrunch record: RRID:SCR_006457
y1 v1; P{y[+t7.7] v[+t1.8] = TRiP.HMJ02101}attP40 (UAS-tobiRNAi)
DOI: 10.3390/cells11060970
Resource: Bloomington Drosophila Stock Center (RRID:SCR_006457)
Curator: @bdscstockkeepers
SciCrunch record: RRID:SCR_006457
검증 주기 및 프로세스
등기부등본 검증 프로세스는 아래처럼 수정 부탁드립니다.
소유주 변동 : Y 응답 시 → 매물 비공개 처리 → 매물 관련 활동 후속 조치 (임장 신청 건 환불 조치,가격 제안 건 취소 처리)
소유주 변동 : N 응답 시 → 리스트 노출 순서↑ 혜택 제공
소유주 변동 : 무응답 시 → 운영팀 수기 관리
비정기 검증 : 동일 단지/동/층에서 실거래 발생 확인된 경우, 운영에서 해당하는 매물들의 등기부등본 열람 → 소유주 변경 확인된 매물은 즉시 비공개 처리 및 매도자 소명 요청 알림 발송 → 3일 내 소명 또는 증빙 확인 시 노출 복구, 소명안된경우 비노출 상태 유지
**동일단지/층수 실거래가 발생 알림은 어드민에서 확인 필요
중복 차단
중복 차단에 아래 내용 추가
중복 매물 등록 시, 소유주 변경 여부 확인 → 소유주 변경 Y : 등기부열람 조회해서 매물 등록 시켜줌 / 소유주 변경 N : 매물 등록 불가
중복 차단 대상 : 매물 등록 시도한 사용자 및 공동 소유자 포함 (등록 불가 결과 안내 시, 공동 소유자도 불가 안내)
moveL
Il y a aussi optimove
GetProviderBinding
el caso de uso de binding directamente deriva a un servicio .12 sacar de query y command
B
For example, x^{(i)} might represent the size of a house and y^{(i)} its sale price
A hypothesis h is employed as a model for solving the regression problem, in that it maps inputs x to outputs y,
I think the original sentence could be vague for some readers. We could improve clarity by framing it more concretely. For example: “A hypothesis h is a model, represented mathematically as a function h: R^d -> R. It maps an input vector x to a predicted output h(x), which we hope closely matches an observed or future output y.” This wording makes the mapping x↦h(x) explicit and states the goal of matching the true outputs.
La Pair-aidance Familiale en Psychiatrie de l'Enfant et de l'Adolescent : Analyse et Retours d'Expérience
Ce document de synthèse analyse le concept et la mise en œuvre de la pair-aidance familiale en psychiatrie de l'enfant et de l'adolescent, en se basant sur le retour d'expérience d'une professionnelle au sein de la Maison de l'Enfant et de la Famille (MEF) à Créteil.
L'approche centrale est "écosystémique", visant à décentrer la problématique de l'enfant pour considérer l'ensemble de son environnement (famille, école, institutions).
La paire-aidante familiale agit comme une "traductrice" et une facilitatrice, établissant un pont entre les familles et les équipes soignantes.
Son rôle est de soutenir les parents, de favoriser leur participation active au processus décisionnel et de veiller à ce que l'enfant soit au centre des soins, en développant son "assentiment" de manière progressive.
Cette pratique, qui reconnaît et valorise le savoir expérientiel des familles, a des impacts significatifs : elle renforce l'autonomie et les compétences parentales, améliore la communication, et fait évoluer les représentations et les pratiques des professionnels de santé, menant à une collaboration plus efficace et à une meilleure compréhension des réalités familiales.
--------------------------------------------------------------------------------
La Maison de l'Enfant et de la Famille, ouverte en janvier 2023 à Créteil, sert de cadre à cette expérience de pair-aidance.
Elle présente des caractéristiques fondamentales qui façonnent son approche :
• Localisation Stratégique : Située à l'extérieur de l'enceinte hospitalière, elle offre un environnement perçu comme plus accessible et moins stigmatisant, ce qui facilite la venue des familles.
• Mission Intégrée : La MEF réunit plusieurs services de pédopsychiatrie et combine les savoirs thérapeutiques et expérientiels au service du soin, de l'enseignement et de la recherche.
• Partenariat Étendu : L'établissement collabore non seulement avec des soignants (pédopsychiatres, orthophonistes), mais aussi avec des associations, des chercheurs et la municipalité pour offrir un accès global à la santé, incluant les loisirs et les aides sociales.
L'intervention de la MEF repose sur une approche écosystémique, qui consiste à analyser la situation de l'enfant en considérant l'ensemble des systèmes qui l'entourent.
• Diagnostic de Situation : Plutôt que de se focaliser uniquement sur l'enfant, l'objectif est de réaliser un "diagnostic de situation" pour faire travailler toutes les parties prenantes (famille, école, institutions) et sortir d'une problématique individualisée.
• Principes Directeurs :
◦ Penser l'enfant dans son environnement et considérer l'influence de tous les systèmes sur son bien-être. ◦ Consolider les mécanismes de résilience en se centrant sur les compétences des systèmes plutôt que sur leurs dysfonctionnements.
◦ Favoriser l'accès à une bonne santé globale, où le soin n'est qu'une des composantes.
◦ Rétablir un langage commun entre les différents acteurs (parents, enseignants, soignants). La paire-aidante se décrit comme une "traductrice" pour aider les familles à naviguer dans les différents jargons professionnels.
L'implication de la famille est un pilier de l'approche, justifiée par les stratégies nationales (2023-2027) et les droits de l'enfant (Charte européenne des enfants hospitalisés, Convention de l'UNICEF).
Bien que légalement le consentement aux soins soit donné par les parents, un concept clé est développé pour l'enfant : l'assentiment.
• Définition : L'assentiment est un processus dynamique et évolutif visant à rendre l'enfant pleinement acteur de sa santé et de son parcours de soin, en adaptant l'information à son âge et à sa capacité de compréhension.
• Objectif : L'opinion de l'enfant doit être recherchée, obtenue et prise en compte.
L'objectif est de construire progressivement son autonomie et sa capacité décisionnelle, afin que la responsabilité ne lui "tombe pas dessus" à sa majorité.
• Conditions de Réussite : La participation de l'enfant dépend de l'attitude des adultes (soignants et famille), qui doivent créer un "environnement capacitant" où il se sent légitime et libre de s'exprimer.
Les parents sont considérés comme des acteurs essentiels du modèle de décision partagée.
• Nécessité de Soutien : Pour participer activement, les parents doivent être suffisamment informés, responsabilisés et soutenus.
• Rôle Évolutif : Leurs responsabilités et leur degré de contrôle sur le processus de soin diminuent à mesure que l'enfant grandit. Cet accompagnement vers l'autonomie de l'adolescent doit être préparé en amont.
• Facteurs d'Influence : Le niveau de participation des parents varie selon leur vécu, leur milieu culturel, leur niveau d'éducation et leur "littératie en santé".
Il est primordial de prendre en compte ces facteurs pour comprendre leurs décisions et leurs craintes éventuelles.
• Positionnement : Bien que leur rôle soit crucial, il est rappelé que l'enfant doit rester au centre du processus, être informé directement et inclus dans les discussions.
La distinction entre l'usager et l'aidant, claire en psychiatrie adulte, est plus complexe en pédopsychiatrie où l'enfant et la famille sont difficilement dissociables.
• Une Entité Familiale : La pratique s'inscrit dans une vision systémique où la "famille" (au sens large, incluant les structures non biologiques et les enfants confiés à l'Aide Sociale à l'Enfance) représente à la fois l'usager (l'enfant) et l'usager indirect (le parent).
• Profils des Pairs-aidants : Plusieurs profils sont possibles et à explorer en fonction des besoins du service.
1. Parent d'un enfant actuellement concerné (le cas de l'intervenante).
2. Adulte anciennement concerné dans sa propre enfance.
3. Personne ayant vécu les deux situations. L'exemple du comité de vigilance des anciens enfants placés illustre la pertinence du second profil pour défendre les droits des enfants actuellement en institution.
La paire-aidante ne remplace aucun professionnel existant mais "rajoute quelque chose de supplémentaire". Ses missions sont variées et adaptatives :
• Disponibilité et Soutien Direct : Assurer une présence physique et à distance (téléphone, mail, SMS), que ce soit à l'hôpital, au domicile des familles ou dans un lieu neutre.
• Accompagnement Institutionnel : Assister les familles lors des réunions de suivi de scolarité, des moments souvent vécus difficilement, pour les aider à comprendre les décisions et à se sentir soutenues.
• Information et Droits : Aider à la compréhension et à l'obtention des droits.
• Interface avec l'Équipe : Participer aux réunions d'équipe (synthèses) pour y faire valoir la parole et la perspective des familles.
• Médiation et Communication : Rediscuter d'un soin ou d'un diagnostic avec les familles, sans jugement, et faire le lien avec le médecin si elles le souhaitent. Adapter les documents d'information selon leurs retours.
• Animation et Réseautage : Animer des groupes de parole et établir des liens avec les partenaires locaux (ex: Conseil Local de Santé Mentale - CLSM, municipalités) pour porter la voix des familles.
L'intégration d'une paire-aidante familiale génère des bénéfices concrets et mesurables, tant pour les familles que pour les équipes soignantes.
| Bénéfices pour les Familles | Bénéfices pour les Équipes Soignantes | | --- | --- | | Soutien et Déstigmatisation : Partage des craintes, aide à la déstigmatisation (ex: peur du regard des autres), sentiment d'être soutenu et de pouvoir se confier. | Meilleure Compréhension : Meilleure perception des freins des familles, dépassant la simple notion de "déni" pour explorer d'autres explications. | | Empowerment et Compétences : Reconnaissance du savoir expérientiel, développement des compétences parentales et de l'autonomie. | Communication Améliorée : Les familles expriment mieux leurs besoins, ce qui facilite l'interdisciplinarité et l'ajustement des soins. | | Accès aux Ressources : Meilleure information sur les droits, les ressources existantes et le réseau associatif. | Connaissance du Terrain : Accès à une connaissance fine des dispositifs associatifs et municipaux, que les équipes n'ont pas toujours le temps d'explorer. | | Rétablissement des Liens : Soutien pour renouer le dialogue avec l'école. | Évolution des Pratiques : Ouverture au savoir expérientiel, encouragement aux bonnes pratiques et changement des représentations sur les familles. | | Source d'Espoir : La présence d'une paire-aidante qui travaille est un modèle positif, montrant qu'un retour à une vie active est possible. | Prise de Conscience Professionnelle : Réflexion sur le langage utilisé et l'impact des propos sur les familles. |
Les retours des membres de l'équipe soignante illustrent l'impact transformateur de cette collaboration :
• "Je ne pensais pas que c'était si compliqué. Quand je vois tout ce que tu as à faire, je comprends mieux l'épuisement de certains parents de mes patients."
• "Depuis que tu es présente aux synthèses, je ne parle plus de la même manière des patients. Je me rends compte que je n'étais pas toujours le plus adapté dans mes propos."
Les Comportements-Défis : Synthèse du Webinaire iMIND #14
Ce document de synthèse analyse les points clés du webinaire iMIND #14, consacré à la gestion des comportements-défis par la mutualisation des compétences professionnelles et familiales.
Les intervenantes, la Professeure Caroline de Maigret (psychiatre) et Sophie Biet (parente et administratrice associative), ont souligné que les comportements-défis ne sont pas des actes de défiance, mais une forme de communication atypique dont il est crucial de comprendre la fonction.
L'approche préconisée repose sur une évaluation pluridisciplinaire rigoureuse, débutant systématiquement par un examen médical complet pour écarter une cause somatique, notamment la douleur.
La réaction de l'environnement est un facteur déterminant : un même comportement peut devenir un "défi" ou non selon la tolérance et la réponse apportées.
Les familles, souvent isolées et en souffrance, sont des partenaires de soin essentiels et des experts de leur proche, dont l'expérience est une ressource inestimable.
La collaboration entre professionnels et familles doit s'articuler autour de la confiance, de l'humilité et d'une posture de "détective" pour formuler et tester des hypothèses sans interprétations hâtives.
Enfin, des stratégies pratiques, telles que la priorisation des comportements à traiter, le remplacement par des compétences adaptées et la remise en question des habitudes institutionnelles ou familiales, sont fondamentales pour améliorer la qualité de vie de la personne et de son entourage.
Le terme "comportement-défi" est une adaptation de l'anglais "challenging behavior".
Il ne traduit pas une volonté de la personne de défier son entourage, mais plutôt le défi que ce comportement représente pour les familles et les professionnels.
• Fréquence : Ils concernent 10 à 15 % des personnes présentant un trouble du développement intellectuel (TDI) à un moment de leur parcours.
• Définition (2017) : Un comportement-défi est défini par la réaction de l'entourage et ses conséquences :
◦ Restrictives : La personne ne peut plus accéder à ses activités ou à des services ordinaires.
◦ Répulsives : L'entourage ne parvient plus à s'occuper de la personne.
◦ Exclusives : En l'absence d'intervention, la personne est exclue des dispositifs d'accompagnement.
• Impact : Ces comportements mettent en danger la sécurité physique de la personne et d'autrui, et engagent son "pronostic social", c'est-à-dire sa capacité à accéder aux soins, aux loisirs et à une vie sociale ordinaire.
• Manifestations : La panoplie des comportements-défis est large et ne se limite pas à l'agressivité. Elle inclut :
◦ Hétéro-agressivité (coups, cris).
◦ Auto-mutilation (souvent, la personne se fait du mal à elle-même avant d'en faire à autrui).
◦ Destruction de matériel.
◦ Perturbations antisociales et nuisances.
◦ Troubles alimentaires graves.
◦ Stéréotypies ou autostimulations excessives.
L'idée centrale est qu'un comportement-défi n'est jamais gratuit. Il est choisi par la personne car il représente un moyen simple et efficace d'obtenir une fonction.
Aucun comportement ne se maintient s'il n'est pas renforcé, consciemment ou non, par l'environnement.
L'objectif est donc d'identifier cette fonction pour proposer une réponse plus adaptée.
| Fonctions Principales | Description | | --- | --- | | Obtenir quelque chose | Le comportement vise à acquérir un élément positif : attention de l'entourage, renforcement sensoriel, un objet, de la nourriture, ou la possibilité de faire un choix (autodétermination). | | Éviter quelque chose | Le comportement vise à échapper à un processus désagréable : douleur physique, émotions négatives, tâches déplaisantes ou exigeantes. |
Un même comportement peut avoir plusieurs fonctions (ex: l'hétéro-agressivité pour échapper à une tâche ou pour attirer l'attention), et inversement, plusieurs comportements peuvent servir la même fonction (ex: s'auto-mutiler, agresser ou jeter un objet pour refuser une activité).
Pour comprendre la fonction d'un comportement, une évaluation rigoureuse, pluriprofessionnelle et standardisée est indispensable.
Elle doit être menée "à froid", c'est-à-dire également lorsque la personne va bien, pour établir une base de référence.
C'est la toute première étape. De nombreux comportements-défis, surtout ceux d'apparition aiguë, sont liés à une cause médicale non détectée :
• Douleur : Problèmes bucco-dentaires, troubles sévères du transit (fécalome), etc.
• Outils : L'utilisation de grilles d'évaluation de la douleur, simples et accessibles à tous (y compris les non-médecins), est fortement recommandée pour les personnes non-communicantes.
Lorsque la cause médicale est écartée, une analyse approfondie est nécessaire pour dresser un "profil" de la personne.
• Communication : Évaluer l'écart entre les capacités de compréhension (souvent supérieures) et d'expression.
Le manque d'outils de communication adaptés (les pictogrammes ne conviennent pas à tout le monde) génère une frustration majeure.
• Fonctions exécutives : Des difficultés à planifier, s'organiser, hiérarchiser et gérer les transitions peuvent provoquer des réactions fortes.
La réponse de l'entourage est souvent "l'hypostimulation", alors que la personne a surtout besoin d'aide pour passer d'une activité à l'autre.
• Profil sensoriel : Identifier les particularités (hypo ou hyper-sensibilité) et les besoins d'autostimulation.
• Autodétermination : Le comportement-défi peut être la seule manière pour une personne de manifester son envie de faire des choix, surtout dans des environnements institutionnels où tout est décidé pour elle.
L'évaluation ne se centre pas uniquement sur la personne, mais aussi sur son environnement, car la réaction de ce dernier conditionne le maintien ou l'aggravation du comportement.
• Outils standardisés : Des grilles comme la grille FAST permettent d'évaluer de manière objective la réponse de l'entourage (familial ou professionnel) et d'identifier les renforçateurs involontaires.
• Qualité de l'environnement : Un environnement instable (turnover important dans le secteur médico-social, manque de personnel) peut faire émerger des comportements-défis qui n'auraient pas apparu dans un contexte plus stable.
Les familles sont les "premières partenaires du soin". Leur implication est indispensable, mais elles sont souvent en grande difficulté.
• Isolement social : Disparition des temps de partage, renoncement aux sorties et à la vie sociale.
Le pronostic social de toute la famille peut être engagé.
• Sentiment d'incompétence : Les parents peuvent développer un sentiment d'échec, de la colère (parfois contre eux-mêmes) et se sentir dévalorisés.
• Protection de la fratrie : La gestion de l'impact sur les frères et sœurs est un enjeu majeur et sensible.
Sophie Biet insiste sur le fait que l'expérience des parents est une ressource précieuse, citant Eric Schopler, concepteur de l'approche TEACCH :
"Contrairement aux chercheurs, ses parents ne pouvaient pas laisser de côté des questions pour lesquelles aucune méthodologie n'avait été établie.
Contrairement aux cliniciens, ils ne pouvaient pas transférer l'enfant ailleurs parce qu'il n'était pas formé pour gérer de tels problèmes.
Et c'est parce qu'ils ont poursuivi leurs études malgré leurs échecs, leurs frustrations et leurs défaites qu'ils sont devenus de si bons enseignants."
La collaboration entre familles et professionnels doit reposer sur une posture partagée.
Sophie Biet identifie trois mots-clés essentiels :
1. Confiance : Elle se construit en ne réduisant pas la personne à ses comportements et en impliquant régulièrement la famille dans le suivi (pas seulement "entre deux portes").
2. Détective : Adopter une démarche pragmatique, poser des hypothèses et les vérifier sans interprétations hâtives ("il est frustré", "il ne veut pas").
3. Humilité : Accepter que, même en mettant tout en œuvre, on n'y arrive pas toujours.
• Prioriser : Il est impossible de tout traiter en même temps. Il faut choisir, en concertation avec la famille, le comportement le plus impactant à travailler en premier (ex: laisser de côté le déchirement de t-shirts pour se concentrer sur des jeux avec les selles).
• Remplacer, ne pas juste supprimer : Lorsqu'un comportement est diminué, il faut le remplacer par un autre, plus adapté, qui remplit la même fonction. (Ex: remplacer le fait de tordre des lunettes par la mise à disposition de fil de fer et de trombones pour créer des formes, transformant le comportement en activité créative).
• Adapter ses propres réactions : Réfléchir à ses propres déclencheurs. (Ex: remplacer le mot "non", qui peut être anxiogène, par le mot "stop").
• Accepter certaines manies : Tolérer des comportements atypiques qui agissent positivement sur l'anxiété et ne sont pas socialement invalidants. (Ex: accepter qu'une personne enlève ses chaussures dans un magasin).
• Remettre en question les habitudes : S'interroger sur les routines qui peuvent être source de tension. (Ex: dans un foyer, les repas collectifs étaient source de conflits.
La mise en place de repas individuels à des heures choisies a non seulement supprimé les problèmes mais a aussi favorisé l'autonomie et les invitations mutuelles).
La session de questions-réponses a permis de souligner plusieurs points importants.
• Autisme sans TDI : Le concept de comportement-défi s'applique aussi aux personnes autistes sans trouble du développement intellectuel.
Des conduites suicidaires à répétition ou des scarifications peuvent relever de cette problématique, qui est largement sous-estimée et mal évaluée en psychiatrie générale adulte et infanto-juvénile.
• La frontière avec le "normal" : La distinction entre un comportement d'enfant et un comportement-défi est parfois floue. C'est la réaction de l'environnement (rejet, exclusion scolaire) et la persistance qui le qualifient comme "défi".
• Formation : Il existe un manque de programmes de formation validés, tant pour les professionnels que pour les familles.
L'approche la plus efficace reste une évaluation fine et un accompagnement personnalisé plutôt qu'un programme global.
Pour les professionnels, des initiatives de formation commencent à se développer, comme celle mise en place à Lyon.
AB_2278725
DOI: 10.1007/s00429-026-03075-y
Resource: (Millipore Cat# MAB5406, RRID:AB_2278725)
Curator: @scibot
SciCrunch record: RRID:AB_2278725
AB_2218978
DOI: 10.1007/s00429-026-03075-y
Resource: (Santa Cruz Biotechnology Cat# sc-10755, RRID:AB_2218978)
Curator: @scibot
SciCrunch record: RRID:AB_2218978
AB_2064130
DOI: 10.1007/s00429-026-03075-y
Resource: (Abcam Cat# ab18465, RRID:AB_2064130)
Curator: @scibot
SciCrunch record: RRID:AB_2064130
AB_2341060
DOI: 10.1007/s00429-026-03075-y
Resource: None
Curator: @scibot
SciCrunch record: RRID:AB_2341060
AB_1587367
DOI: 10.1007/s00429-026-03075-y
Resource: (Millipore Cat# AB2237, RRID:AB_1587367)
Curator: @scibot
SciCrunch record: RRID:AB_1587367
AB_2179313
DOI: 10.1007/s00429-026-03075-y
Resource: (Millipore Cat# MAB5364, RRID:AB_2179313)
Curator: @scibot
SciCrunch record: RRID:AB_2179313
AB_2533990
DOI: 10.1007/s00429-026-03075-y
Resource: (Thermo Fisher Scientific Cat# 71-6000, RRID:AB_2533990)
Curator: @scibot
SciCrunch record: RRID:AB_2533990
AB_570666
DOI: 10.1007/s00429-026-03075-y
Resource: (Millipore Cat# AB9610, RRID:AB_570666)
Curator: @scibot
SciCrunch record: RRID:AB_570666
AB_10617521
DOI: 10.1007/s00429-026-03075-y
Resource: (Millipore Cat# ABE74, RRID:AB_10617521)
Curator: @scibot
SciCrunch record: RRID:AB_10617521
AB_306716
DOI: 10.1007/s00429-026-03075-y
Resource: (Abcam Cat# ab868, RRID:AB_306716)
Curator: @scibot
SciCrunch record: RRID:AB_306716
AB_2536611
DOI: 10.1007/s00429-026-03075-y
Resource: (Thermo Fisher Scientific Cat# M11217, RRID:AB_2536611)
Curator: @scibot
SciCrunch record: RRID:AB_2536611
AB_2261231
DOI: 10.1007/s00429-026-03075-y
Resource: (Santa Cruz Biotechnology Cat# sc-13024, RRID:AB_2261231)
Curator: @scibot
SciCrunch record: RRID:AB_2261231
AB_2571870
DOI: 10.1007/s00429-026-03075-y
Resource: (EnCor Biotechnology Cat# RPCA-mCherry, RRID:AB_2571870)
Curator: @scibot
SciCrunch record: RRID:AB_2571870
Synthèse de la Table Ronde : Enjeux de l'Attachement Fragilisé sur le Parcours Scolaire des Jeunes Protégés
Cette table ronde analyse les profondes répercussions de l'attachement fragilisé sur le parcours scolaire et le quotidien des jeunes relevant de la protection de l'enfance (Aide Sociale à l'Enfance,
Protection Judiciaire de la Jeunesse). Les enfants à l'attachement insécure, issus de contextes familiaux souvent très dégradés, manifestent des difficultés d'apprentissage, des troubles du comportement et une instabilité émotionnelle qui constituent des défis majeurs pour eux-mêmes et les professionnels qui les accompagnent.
L'école, bien que perçue comme un facteur de normalité et de résilience, peine à répondre à leurs besoins spécifiques.
Les intervenants soulignent l'importance cruciale d'une posture professionnelle basée sur la prévisibilité, la valorisation des compétences et le maintien des rôles respectifs de chaque adulte (éducateur, enseignant, parent).
La collaboration interinstitutionnelle entre les services sociaux et l'Éducation Nationale est identifiée comme un levier essentiel, malgré des freins logistiques et un débat persistant sur le niveau d'information à partager.
Enfin, la discussion met en lumière des pratiques prometteuses telles que les chartes partenariales et une prise de conscience croissante de la théorie de l'attachement, signalant une dynamique positive vers un meilleur accompagnement de ces jeunes.
--------------------------------------------------------------------------------
L'introduction de la table ronde pose un constat fondamental : pour les enfants ayant vécu des violences et des maltraitances parentales, l'attachement insécure rend l'exploration du monde et les apprentissages des "défis insurmontables".
Les témoignages et analyses des professionnels confirment cette prémisse en détaillant ses manifestations concrètes.
Les observations recueillies par Lidy Poevin auprès de deux assistantes familiales (Mme de Velter et Mme Belliga) dressent un tableau clinique des difficultés rencontrées par les enfants accueillis :
• Troubles du développement et des apprentissages : Retards fréquents, troubles du sommeil, de l'alimentation et de la motricité. Manque d'assiduité, de motivation et d'intérêt pour l'école.
• Insécurité émotionnelle : Un "grand sentiment d'abandon" exacerbé par des contacts parentaux irréguliers ("en montagne russes").
Cela engendre un conflit de loyauté et une posture "d'autoprotection envers l'attachement".
• Mise à l'épreuve des adultes : Les enfants testent constamment la capacité des adultes "à tenir et à être toujours là quoi qu'il fasse", cherchant une attention exclusive, y compris par des comportements négatifs ("faire des bêtises car ils savent que c'est un moyen de mobiliser").
• Disponibilité cognitive limitée : Le "cerveau en constant questionnement" et le poids du vécu familial empêchent de libérer les ressources nécessaires aux apprentissages, menant à des difficultés scolaires malgré des "capacités certaines".
Pascal Abdakovi, directeur d'une Maison d'Enfants à Caractère Social (MECS), apporte un éclairage sociologique qui contraste avec les vignettes cliniques classiques.
• Dégradation des systèmes familiaux : Sur les 280 parents des 140 enfants accompagnés, une dizaine seulement travaillent.
La majorité des situations concerne des parents incarcérés, hospitalisés, ou confrontés à des addictions, dans des contextes de grande précarité économique.
• Une majorité silencieuse : Si 5 à 10 enfants peuvent "mettre une ambiance extraordinaire dans les écoles", les 130 autres "vont pas si mal que ça" et présentent des préoccupations d'enfants ordinaires (amoureux, réseaux sociaux).
• Le phénomène de l'épuisement psychique : Ces enfants, même ceux qui s'adaptent bien en journée, puisent dans une "énergie psychique assez limitée".
L'école représente pour eux un environnement normalisant où ils peuvent être "juste un élève".
Cependant, le soir, de retour en structure, "la cour est pleine" : les angoisses d'abandon remontent et leur disponibilité psychique pour le travail scolaire est "complètement absente".
Sophie Nicolas, responsable d'unité éducative en Établissement Pénitentiaire pour Mineurs (EPM), décrit la situation de jeunes dont le parcours est marqué par une accumulation de ruptures.
• Parcours institutionnels lourds : La plupart des jeunes incarcérés ont un long passé au sein de l'Aide Sociale à l'Enfance et de la Protection Judiciaire de la Jeunesse, signifiant des "ruptures dans les figures d'attachement" et un essoufflement dans la capacité à créer des liens de confiance.
• Troubles relationnels extrêmes : Les relations avec les adultes oscillent entre une demande d'attention fusionnelle ("collé à la jambe de l'éducateur") et une mise à distance radicale, issue de trahisons passées. Ils testent constamment le lien, craignant de vivre un "énième abandon".
• Estime de soi dégradée : Ayant reçu très peu de valorisation, ces jeunes se dévalorisent massivement. Ils ne comprennent pas le regard positif que les éducateurs posent sur eux, ce qui nécessite un long travail de restauration de la confiance.
• Obstacles aux apprentissages : Bien que la scolarité soit obligatoire en EPM, les jeunes sont souvent indisponibles, préoccupés par des enjeux familiaux.
L'exemple d'un jeune "focus" sur l'inquiétude pour sa mère illustre comment l'esprit ne peut s'investir dans les apprentissages.
Face à ces défis, les intervenants s'accordent sur la nécessité d'adopter des postures et des stratégies spécifiques pour créer un environnement sécurisant et propice au développement.
Pascal Abdakovi insiste sur deux piliers de la relation éducative en institution :
1. La Prévisibilité : Rendre l'environnement "lisible et prévisible" pour l'enfant est essentiel.
Cela passe par des actions simples comme informer les enfants des adultes qui seront présents le matin ou au retour de l'école, afin de contrer l'imprévisibilité générée par la rotation des équipes.
2. La Juste Place : Chaque professionnel doit "parler de la bonne place". L'éducateur n'est ni le parent, ni l'enseignant, ni le juge.
De même, l'enseignant doit rester dans son rôle d'enseignant. Partager des détails sordides de la vie de l'enfant avec l'enseignant est un "fantasme" qui ne fonctionne pas et rompt le contrat implicite où l'enfant peut, à l'école, être "juste un élève" et échapper à sa condition d'enfant placé.
Nadine Musinski, pilote de projet adoption, introduit une nuance cruciale en ajoutant la notion d'appartenance à celle de l'attachement.
• Le sentiment du vide : Les pupilles de l'État souffrent d'un "sentiment d'exister pour personne" et d'un "vide" identitaire. La démarche de protection et la construction d'un projet de vie leur permettent de commencer à "compter pour quelqu'un".
• L'importance de l'appartenance : Au-delà de l'attachement, "la relation d'appartenance" (être l'enfant de quelqu'un, avoir un nom) est fondamentale.
Les enfants délaissés internalisent la responsabilité de leur situation ("il est persuadé que c'est lui qui est délaissé [...] parce qu'il n'est pas aimable").
Le travail consiste à diluer cette responsabilité et à leur offrir la possibilité de s'inscrire dans une nouvelle filiation.
Plusieurs stratégies sont mises en avant pour favoriser la réussite scolaire et le bien-être :
• Valoriser les compétences : Nadine Musinski souligne que pointer uniquement les lacunes d'un enfant renforce son "idéologie qu'il n'est bon à rien".
Il est impératif de s'appuyer sur ses compétences.
• Éviter le rapport de force : Ces enfants sont habitués à l'adversité et à l'autorité punitive.
Entrer dans un rapport de force ne fait que confirmer leur vision d'un monde hostile.
La négociation et la recherche d'adhésion leur offrent un autre modèle relationnel basé sur l'empathie.
• Mettre l'enfant au cœur du projet : Un éducateur de centre de jour insiste sur la nécessité de partir des besoins de l'enfant, de le valoriser et de s'assurer que le projet est "son projet" et non celui des adultes.
La réussite de l'accompagnement de ces jeunes dépend d'une coopération étroite entre les services de la protection de l'enfance et l'Éducation Nationale.
• Freins logistiques : Pascal Abdakovi pointe une difficulté structurelle majeure : les rythmes de travail incompatibles.
Les enseignants sont disponibles en fin de journée, au moment même où les éducateurs sont submergés par le retour des 140 enfants de la MECS.
• Leviers de communication : Pour pallier cela, il est essentiel de mettre en place des canaux de communication directs entre les cadres des institutions pour "régler les problèmes avant de ne plus se supporter" et éviter l'escalade des tensions.
• Aménagements scolaires : Une collaboration efficace permet d'aménager les temps de présence de l'enfant (par exemple, le soustraire de la cantine ou de la garderie, zones souvent sensibles) pour protéger à la fois l'enfant et l'institution scolaire.
Une tension émerge entre le besoin des enseignants et celui des élèves :
• Le besoin de savoir des enseignants : Une intervenante du public exprime le besoin pour l'école d'avoir des "éléments de vie" (sans entrer dans l'intime), comme le nombre de placements précédents ou le statut de l'autorité parentale.
Ces informations sont jugées nécessaires non par "curiosité malsaine", mais pour comprendre des comportements (ex: l'élève qui n'a jamais ses affaires car le collège est sa "seule maison") et gérer des procédures administratives.
• Le besoin de normalité de l'élève : En contrepoint, l'analyse de Pascal Abdakovi défend que l'école est un lieu de répit où l'enfant ne doit pas être "ramené à sa condition d'enfant placé".
La discussion se conclut sur une note d'espoir, soulignant les avancées en cours :
• Les Chartes Partenariales : Une CPE (Conseillère Principale d'Éducation) témoigne que ces chartes, bien que n'étant pas une solution miracle, "impulsent des nouvelles dynamiques et des liens" entre les institutions, avec des "avancées concrètes" sur l'orientation et le bien-être des élèves.
• Formation à la Théorie de l'Attachement : Il est noté que les travailleurs sociaux se forment de plus en plus à cette théorie, notamment via des diplômes universitaires dédiés, témoignant d'une "prise de conscience" et d'un mouvement de professionnalisation sur ces enjeux.
Il n’est déjà pas chose aisée que d’enseigner à des enfants ayant des difficultés d’apprentissage. Quand les problèmes tombent dans la catégorie des troubles envahissant du développement (TED) comme l’autisme, la tâche le devient encore moins. D’autant qu’il y a presque autant de formes autistiques que d’autistes eux-mêmes. Certains vivent avec une déficience intellectuelle alors que d’autres sont très intelligents. Certains ont seulement des difficultés dans le décodage des comportements sociaux tandis que d’autres ne parlent tout simplement pas. D'autres ont besoin d’un contrôle total sur leur environnement sinon ils paniquent... Bref, des profils d’apprenants extrêmement différents qui peuvent être un casse-tête pour des enseignants.
L’auteur commence par poser ici le cadre général en mettant en exergue le large spectre des troubles autistiques. Toutefois, cette hétérogénéité, bien identifiée, n’est pas encore reliée à des types précis de « barrières », notion centrale de la problématique mais encore peu définie à ce stade.
Author response:
Public Reviews:
Reviewer #1 (Public review):
Summary:
In this manuscript, Dixit and colleagues investigate the role of FRG1 in modulating nonsense-mediated mRNA decay using human cell lines and zebrafish embryos. They present data from experiments that test the effect of normal, reduced or elevated levels of FRG1 on NMD of a luciferase-based NMD reporter and on endogenous mRNA substrates of NMD. They also carry out experiments to investigate FRG1's influence on UPF1 mRNA and protein levels, with a particular focus on the possibility that FRG1 regulates UPF1 protein levels through ubiquitin-mediated proteolysis of UPF1. The experiments described also test whether DUX4's effect on UPF1 protein levels and NMD could be mediated through FRG1. Finally, the authors also present experiments that test for physical interaction between UPF1, the spliceosome and components of the exon junction complex.
Strengths:
A key strength of the work is its focus on an intriguing model of NMD regulation by FRG1, which is of particular interest as FRG1 is positively regulated by DUX4, which has been previously implicated in subjecting UPF1 to proteosome-mediated degradation and thereby causing NMD inhibition. The data that shows that DUX4-mediated effect on UPF1 levels is diminished upon FRG1 depletion suggests that DUX4's regulation of NMD could be mediated by FRG1.
Weaknesses:
A major weakness and concern is that many of the key conclusions drawn by the authors are not supported by the data, and there are also some significant concerns with experimental design. More specific comments below describe these issues:
(1) Multiple issues lower the confidence in the experiments testing the effect of FRG1 on NMD.
(a) All reporter assays presented in the manuscript are based on quantification of luciferase activity, and in most cases, the effect on luciferase activity is quite small. This assay is the key experimental approach throughout the manuscript. However, no evidence is provided that the effect captured by this assay is due to enhanced degradation of the mRNA encoding the luciferase reporter, which is what is implied in the interpretation of these experiments. Crucially, there is also no control for the reporter that can account for the effects of experimental manipulations on transcriptional versus post-transcriptional effects. A control reporter lacking a 3'UTR intron is described in Barid et al, where the authors got their NMD reporter from. Due to small effects observed on luciferase activity upon FRG1 depletion, it is necessary to not only measure NMD reporter mRNA steady state levels, but it will be equally important to ascertain that the effect of FRG1 on NMD is at the level of mRNA decay and not altered transcription of NMD substrates. This can be accomplished by testing decay rates of the beta-globin reporter mRNA.
We thank the reviewer for raising these points and for the careful evaluation of our experimental approach. Here we provide our response to comment (a) in three parts
Reliance on luciferase-based reporter assays
While luciferase-based NMD reporter assays represent an important experimental component of this study, our conclusions do not rely exclusively on this approach. The reporter-based findings are independently supported by RNA sequencing analyses of FRG1-perturbed cells, which demonstrate altered abundance of established PTC-containing NMD target transcripts. This genome-wide analysis provides an unbiased and physiologically relevant validation of FRG1 involvement in NMD regulation.
All reporter assays presented in the manuscript are based on quantification of luciferase activity, and in most cases, the effect on luciferase activity is quite small.
We respectfully disagree with the comment that the magnitude of the luciferase effects is low. Increased expression of FRG1, which leads to reduced UPF1 levels, results in a ~3.5-fold increase in relative luciferase activity (Fig. 1C), indicating a robust effect. Furthermore, in the in vivo zebrafish model, FRG1 knockout causes a pronounced decrease in relative luciferase activity (Fig. 1H), consistent with elevated UPF1 levels and enhanced NMD activity.
It is also important to note that FRG1 functions as a negative regulator of UPF1; therefore, its depletion is expected to increase UPF1 levels. However, excessive elevation of UPF1 is likely constrained by additional regulatory mechanisms, which may limit the observable effects of FRG1 knockdown or knockout. In line with this, our previous study (1) demonstrated that FRG1 positively regulates multiple NMD factors while exerting an inverse regulatory effect on UPF1. This dual role suggests that FRG1 may act as a compensatory modulator of the NMD machinery, which likely explains the relatively subtle net effects observed in FRG1 knockdown/knockout conditions in vitro (Fig. 1A and 1B). This interpretation is explicitly discussed in the manuscript (Discussion, paragraph para 4).
However, no evidence is provided that the effect captured by this assay is due to enhanced degradation of the mRNA encoding the luciferase reporter, which is what is implied in the interpretation of these experiments. Crucially, there is also no control for the reporter that can account for the effects of experimental manipulations on transcriptional versus post-transcriptional effects. A control reporter lacking a 3'UTR intron is described in Barid et al, where the authors got their NMD reporter from. Due to small effects observed on luciferase activity upon FRG1 depletion, it is necessary to not only measure NMD reporter mRNA steady state levels, but it will be equally important to ascertain that the effect of FRG1 on NMD is at the level of mRNA decay and not altered transcription of NMD substrates. This can be accomplished by testing decay rates of the beta-globin reporter mRNA.
Thank you for your suggestion. We will test decay rates of the beta-globin reporter mRNA.
(b) It is unusual to use luciferase enzymatic activity as a measurement of RNA decay status. Such an approach can at least be justified if the authors can test how many-fold the luciferase activity changes when NMD is inhibited using a chemical inhibitor (e.g., SMG1 inhibitor) or knockdown of a core NMD factor.
We respectfully disagree that the use of luciferase enzymatic activity as a readout for NMD is unusual. Multiple prior studies have successfully employed identical or closely related luciferase-based/fluorescence-based reporters to quantify NMD activity (2–5). Importantly, the goal of our study was not to measure RNA decay kinetics per se, but rather to assess how altered FRG1 levels influence the functional efficiency of the NMD pathway. Given that FRG1 is a structural component of the spliceosome C complex (6) and is previously indirectly linked to NMD regulation (1,7) this approach was well-suited to address our central question.
As suggested by the reviewer, we will also assess luciferase activity following pharmacological inhibition of NMD to further validate the reporter system's responsiveness.
(c) The concern about the direct effect of FRG1 on NMD is further amplified by the small effects of FRG1 knockout on steady-state levels of endogenous NMD targets (Figure 1A and B: ~20% reduction in reporter mRNA in MCF7 cells; Figure 1M, only 18 endogenous NMD targets shared between FRG1_KO and FRG1_KD).
The modest changes observed upon FRG1 loss do not preclude a direct role in NMD. As detailed in our response to comment (a) and discussed in paragraph 4 of the Discussion, limited effects on steady-state levels of endogenous NMD targets are expected given the buffering capacity of the NMD pathway and the contribution of compensatory regulatory mechanisms.
(d) The question about transcriptional versus post-transcriptional effects is also important in light of the authors' previous work that FRG1 can act as a transcriptional regulator.
We agree that distinguishing between transcriptional and post-transcriptional effects is important, particularly in light of our previous work demonstrating that FRG1 can function as a transcriptional regulator of multiple NMD genes (1). Consistent with this, the current manuscript shows that FRG1 influences the transcript levels of UPF1. In addition, we demonstrate that FRG1 regulates UPF1 at the protein level. We therefore conclude that FRG1 regulates UPF1 dually, at both transcriptional and post-transcriptional levels, supporting a dual role for FRG1 in the regulation of NMD.
This conclusion is further supported by prior studies indicating post-transcriptional functions of FRG1. FRG1 is a nucleocytoplasmic shuttling protein(8), interacts with the NMD factor ROD1 (7), and has been identified as a component of the spliceosomal C complex (6). FRG1 has also been reported to associate with the hnRNPK family of proteins (8), which participate in extensive protein–protein interaction networks. Collectively, these observations are consistent with a role for FRG1 in regulating NMD components at multiple levels.
(2) In the experiments probing the relationship between DUX4 and FRG1 in NMD regulation, there are some inconsistencies that need to be resolved.
(a) Figure 3 shows that the inhibition of NMD reporter activity caused by DUX4 induction is reversed by FRG1 knockdown. Although levels of FRG1 and UPF1 in DUX4 uninduced and DUX4 induced + FRG1 knockdown conditions are similar (Figure 5A), why is the reporter activity in DUX4 induced + FRG1 knockdown cells much lower than DUX4 uninduced cells in Figure 3?
We appreciate the reviewer’s comment. Figures 3 and 5A represent independent experiments in which FRG1 knockdown was achieved by transient transfection. As such, variability in transfection efficiency is expected and likely accounts for the quantitative difference. We want to highlight that compared to DUX4_induced lane (Fig. 5A, lane 2), when we knock down FRG1 on the DUX4_induced background, it shows a clear increase in the UPF1 level (Fig. 5A, lane 3). We will add one more replicate to 5 A with better FRG1_KD transfection to the experiment.
(b) In Figure 3, it is important to know the effect of FRG1 knockdown in DUX4 uninduced conditions.
We thank the reviewer for this thoughtful suggestion. The effect of FRG1 knockdown under DUX4-uninduced conditions is presented in Figure 1A, where FRG1 levels are reduced without altering DUX4 expression. In contrast, Figure 3 is specifically designed to assess the rescue effect—namely, how reduction of FRG1 expression under DUX4-induced conditions influences NMD efficiency. Therefore, inclusion of an FRG1 knockdown–only group in Figure 3 was not relevant to the objective of this experiment.
(c) On line 401, the authors claim that MG132 treatment leads to "time-dependent increase in UPF1 protein levels" in Figure 5C. However, upon proteasome inhibition, UPF1 levels significantly increase only at 8h time point, while the change at 12 and 24 hours is not significantly different from the control.
We thank the reviewer for this observation and agree that the statement of a “time-dependent increase in UPF1 protein levels” was inaccurate. A significant increase is observed only at the 8 h time point following MG132 treatment, with no significant changes at 12 h or 24 h. The text will be revised accordingly to reflect Figure 5C.
(3) There are multiple issues with experiments investigating ubiquitination of UPF1:
(a) Ubiquitin blots in Figure 6 are very difficult to interpret. There is no information provided either in the text or figure legends as to which bands in the blots are being compared, or about what the sizes of these bands are, as compared to UPF1. Also, the signal for Ub in most IP samples looks very similar to or even lower than the input.
We agree that the ubiquitin blots in Figure 6 require clearer presentation. In the revised figure, we will annotate the ubiquitin immunoblots to indicate the region corresponding to UPF1 (~140 kDa), which is the relevant molecular weight for interpretation. Because UPF1 is polyubiquitinated, ubiquitinated species are expected to appear as multiple bands rather than a single discrete signal; therefore, ubiquitination was assessed across the full blot. Importantly, interpretation is based on comparisons between UPF1 immunoprecipitated samples within each panel (Fig. 6C–F), rather than between input and IP lanes. For example, in Figure 6 C UPF1 IP FRG1_KD compared to UPF1 IP FRG1_Ex, in Figure 6 D UPF1 IP FRG1_WT compared to UPF1 IP FRG1_KO, in Figure 6 E UPF1 IP FRG1_KO compared to UPF1 IP FRG1_KO+FRG1_Ex, and in Figure 6 F UPF1 IP FRG1_Ex compared to UPF1 IP FRG1_Ex+MG132 TRT.
(b) Western blot images in Figure 6D appear to be adjusted for brightness/contrast to reduce background, but are done in such a way that pixel intensities are not linearly altered. This image appears to be the most affected, although some others have also similar patterns (e.g., Figure 5C).
We thank the reviewer for raising this point. The appearance noted in Figure 6D was not due to non-linear alteration of pixel intensities, but rather resulted from the poor quality of the ubiquitin antibody, which required prolonged exposure times. To address this, we replaced the antibody and repeated the ubiquitin immunoblots shown in Figures 6D, 6E, and 6F.
For Figure 5C, only uniform contrast adjustment was applied for clarity. Importantly, all adjustments were performed linearly and applied to the entire image. Raw, unprocessed images for all blots are provided in the Supplementary Information. Updated versions of Figures 5 and 6 will be included in the revised manuscript.
(4) The experiments probing physical interactions of FRG1 with UPF1, spliceosome and EJC proteins need to consider the following points:
(a) There is no information provided in the results or methods section on whether immunoprecipitations were carried out in the absence or presence of RNases. Each RNA can be bound by a plethora of proteins that may not be functionally engaged with each other. Without RNase treatment, even such interactions will lead to co-immunoprecipitation. Thus, experiments in Figure 6 and Figure 7A-D should be repeated with and without RNase treatment.
We thank the reviewer for this important point. The co-immunoprecipitation experiments shown in Figures 6 and 7A–D were performed in the absence of RNase treatment; this information was inadvertently omitted and will be added to the Methods section and the relevant figure legends. To directly assess whether the observed interactions are RNA-dependent, we will repeat the key co-immunoprecipitation experiments in the presence of RNase treatment and include these results in the revised manuscript.
(b) Also, the authors claim that FRG1 is a "structural component" of EJC and NMD complexes seems to be an overinterpretation. As noted in the previous comment, these interactions could be mediated by a connecting RNA molecule.
We thank the reviewer for this insightful comment. As noted, previous studies have suggested that FRG1 interacts with components of the EJC and NMD machinery. Specifically, Bertram et al. (6) identified FRG1 as a component of the spliceosomal C complex via Cryo-EM structural analysis, and pull-down studies have shown direct interaction between FRG1 and ROD1, a known EJC component (7). These findings support a protein-protein interaction rather than one mediated solely by RNA. To further address the reviewer’s concern, we will perform key co-immunoprecipitation experiments in the presence of RNase treatment to distinguish RNA-dependent from RNA-independent interactions.
(c) A negative control (non-precipitating protein) is missing in Figure 7 co-IP experiments.
We agree that including a non-precipitating protein as a negative control is important, and we will perform the co-IP experiment incorporating this control.
(d) Polysome analysis is missing important controls. FRG1 and EIF4A3 co-sedimentation with polysomes could simply be due to their association with another large complex (e.g., spliceosome), which will also co-sediment in these gradients. This possibility can at least be tested by Western blotting for some spliceosome components across the gradient fractions. More importantly, a puromycin treatment control needs to be performed to confirm that FRG1 and EIF4A3 are indeed bound to polysomes, which are separated into ribosome subunits upon puromycin treatment. This leads to a shift of the signal for ribosomal proteins and any polysome-associated proteins to the left.
As recommended, we will examine the distribution of a spliceosome component across the gradient fractions to assess potential co-sedimentation. Additionally, we will perform a puromycin treatment control to confirm that FRG1 and EIF4A3 are genuinely associated with polysomes.
Reviewer #2 (Public review):
Summary:
In this manuscript, Palo et al present a novel role for FRG1 as a multifaceted regulator of nonsense-mediated mRNA decay (NMD). Through a combination of reporter assays, transcriptome-wide analyses, genetic models, protein-protein interaction studies, ubiquitination assays, and ribosome-associated complex analyses, the authors propose that FRG1 acts as a negative regulator of NMD by destabilizing UPF1 and associating with spliceosomal, EJC, and translation-related complexes. Overall, the data, while consistent with the authors' central conclusions, are undermined by several claims-particularly regarding structural roles and mechanistic exclusivity. To really make the claims presented, further experimental evidence would be required.
Strengths:
(1) The integration of multiple experimental systems (zebrafish and cell culture).
(2) Attempts to go into a mechanistic understanding of the relationship between FGR1 and UPF1.
Weaknesses:
(1) Overstatement of FRG1 as a structural NMD component.
Although FRG1 interacts with UPF1, eIF4A3, PRP8, and CWC22, core spliceosomal and EJC interactions (PRP8-CWC22 and eIF4A3-UPF3B) remain intact in FRG1-deficient cells. This suggests that, while FRG1 associates with these complexes, this interaction is not required for their assembly or structural stability. Without further functional or reconstitution experiments, the presented data are more consistent with an interpretation of FRG1 acting as a regulatory or accessory factor rather than a core structural component.
We thank the reviewer for this clarification. We would like to emphasize that we do not claim FRG1 to be a core structural component of either the spliceosome or the EJC. Consistent with the reviewer’s interpretation, our data indicate that FRG1 deficiency does not disrupt the structural integrity of these complexes. Our intended conclusion is that FRG1 functions as a regulatory or accessory factor in NMD rather than being required for complex assembly or stability. We will carefully revise the manuscript to remove any language that could be interpreted as an overstatement. In addition, we are currently performing further experiments to better define the association of FRG1 with the EJC.
(2) Causality between UPF1 depletion and NMD inhibition is not fully established.
While reduced UPF1 levels provide a plausible explanation for decreased NMD efficiency, the manuscript does not conclusively demonstrate that UPF1 depletion drives all observed effects. Given FRG1's known roles in transcription, splicing, and RNA metabolism, alterations in transcript isoform composition and apparent NMD sensitivity may arise from mechanisms independent of UPF1 abundance. To directly link UPF1 depletion to altered NMD efficiency, rescue experiments testing whether UPF1 re-expression restores NMD activity in FRG1-overexpressing cells would be important.
As suggested, to directly test causality, we will perform rescue experiments to determine whether UPF1 re-expression restores NMD activity in FRG1-overexpressing MCF7 cells.
(3) Mechanism of FRG1-mediated UPF1 ubiquitination requires clarification.
The ubiquitination assays support a role for FRG1 in promoting UPF1 degradation; however, the mechanism underlying this remains unexplored. The relationship between FRG1-UPF1 what role FRG1 plays in this is unclear (does it function as an adaptor, recruits an E3 ubiquitin ligase, or influences UPF1 ubiquitination indirectly through transcriptional or signaling pathways?).
We agree with the reviewer that the precise mechanism by which FRG1 promotes UPF1 ubiquitination remains to be defined. Our ubiquitination assays support a role for FRG1 in facilitating UPF1 degradation; however, whether FRG1 functions directly as an adaptor or E3 ligase, or instead influences UPF1 stability indirectly, is currently unclear. Notably, a prior study by Geng et al. reported that DUX4 expression alters the expression of numerous genes involved in protein ubiquitination, including multiple E3 ubiquitin ligases (9), and FRG1 itself has been reported to be upregulated upon DUX4 expression in muscle cells. We will expand the Discussion to address these potential mechanisms and place our findings in the context of indirect transcriptional or signaling pathways that may regulate UPF1 proteolysis. A detailed mechanistic dissection of FRG1-mediated ubiquitination is beyond the scope of the present study.
(4) Limited transcriptome-wide interpretation of RNA-seq data.
Although the RNA-seq data analysis relies heavily on a small subset of "top 10" genes. Additionally, the criteria used to define NMD-sensitive isoforms are unclear. A more comprehensive transcriptome-wide summary-indicating how many NMD-sensitive isoforms are detected and how many are significantly altered-would substantially strengthen the analysis.
We thank the reviewer for this comment and agree that the current presentation may place a disproportionate emphasis on a limited subset of genes. These genes were selected as illustrative examples from an isoform-level analysis performed using IsoformSwitchAnalyzeR (ISAR) (10); however, we acknowledge that this approach does not fully convey the transcriptome-wide scope of the analysis.
Using quantified RNA-seq data, ISAR was employed to identify significant isoform switches and transcripts predicted to be NMD-sensitive. Isoforms were annotated using GENCODE v47, and NMD sensitivity was assigned based on the established 50-nucleotide rule, as described in the Materials and Methods. To address the reviewer’s concern, we will revise the Results section to include a transcriptome-wide summary derived from the ISAR analysis.
(5) Clarification of NMD sensor assay interpretation.
The logic underlying the NMD sensor assay should be explained more clearly early in the manuscript, as the inverse relationship between luciferase signal and NMD efficiency may be counterintuitive to readers unfamiliar with this reporter system. Inclusion of a schematic or brief explanatory diagram would improve accessibility.
We agree with the reviewer and would provide a schematic as well as the experimental setup diagram to improve accessibility to the readers.
(6) Potential confounding effects of high MG132 concentration.
The MG132 concentration used (50 µM) is relatively high and may induce broad cellular stress responses, including inhibition of global translation (its known that proteosome inhibition shuts down translation). Controls addressing these secondary effects would strengthen the conclusion that UPF1 stabilization specifically reflects proteasome-dependent degradation would be essential.
We acknowledge the reviewer’s concern regarding the relatively high concentration of MG132 used in this study. While proteasome inhibition can indeed induce global translation inhibition, our interpretation is based on the specific stabilization of UPF1 observed under these conditions. Since inhibition of global translation would generally reduce protein levels rather than cause selective accumulation, the observed increase in UPF1 is unlikely to result from translational effects. To address this point, we plan to repeat selected experiments using a lower MG132 concentration to further confirm that UPF1 stabilization reflects proteasome-dependent degradation.
(7) Interpretation of polysome co-sedimentation data.
While the co-sedimentation of FRG1 with polysomes is intriguing, this approach does not distinguish between direct ribosomal association and co-migration with ribosome-associated complexes. This limitation should be explicitly acknowledged in the interpretation.
We acknowledge that polysome co-sedimentation alone cannot definitively distinguish between direct ribosomal binding and co-migration with ribosome-associated complexes. Importantly, our interpretation does not rely solely on this assay; when combined with co-immunoprecipitation and proximity ligation assay results, the data consistently support an association of FRG1 with the exon junction complex. We are also conducting additional experiments with appropriate controls to further validate the specificity of FRG1’s association with ribosomes and to address the possibility of nonspecific co-migration.
(8) Limitations of PLA-based interaction evidence.
The PLA data convincingly demonstrate close spatial proximity between FRG1 and eIF4A3; however, PLA does not provide definitive evidence of direct interaction and is known to be susceptible to artefacts. Moreover, a distance threshold of ~40 nm still allows for proteins to be in proximity without being part of the same complex. These limitations should be clearly acknowledged, and conclusions should be framed accordingly.
We thank the reviewer for highlighting this important point. We agree that PLA indicates close spatial proximity but does not constitute definitive evidence of direct interaction and can be susceptible to artefacts. We will explicitly acknowledge this limitation in the revised manuscript. Importantly, our conclusions are not solely based on PLA data; they are supported by complementary co-immunoprecipitation and polysome co-sedimentation assays, which provide biochemical evidence consistent with an association between FRG1 and eIF4A3.
Reviewer #3 (Public review):
The manuscript by Palo and colleagues demonstrates identification of FRG1 as a novel regulator of nonsense-mediated mRNA decay (NMD), showing that FRG1 inversely modulates NMD efficiency by controlling UPF1 abundance. Using cell-based models and a frg1 knockout zebrafish, the authors show that FRG1 promotes UPF1 ubiquitination and proteasomal degradation, independently of DUX4. The work further positions FRG1 as a structural component of the spliceosome and exon junction complex without compromising its integrity. Overall, the manuscript provides mechanistic insight into FRG1-mediated post-transcriptional regulation and expands understanding of NMD homeostasis. The authors should address the following issues to improve the quality of their manuscript.
(1) Figure 7A-D, appropriate positive controls for the nuclear fraction (e.g., Histone H3) and the cytoplasmic fraction (e.g., GAPDH or α-tubulin) should be included to validate the efficiency and purity of the subcellular fractionation.
We thank the reviewer for the suggestion. We will include appropriate positive controls for the nuclear fraction (Histone H3) and the cytoplasmic fraction (GAPDH or α-tubulin) in Figure 7A–D to validate the efficiency and purity of the subcellular fractionation.
(2) To strengthen the conclusion that FRG1 broadly impacts the NMD pathway, qRT-PCR analysis of additional core NMD factors (beyond UPF1) in the frg1⁻/⁻ zebrafish at 48 hpf would be informative.
We appreciate the reviewer’s insightful comment. We will perform qRT-PCR analysis of additional core NMD factors in the frg1⁻/⁻ zebrafish at 48 hpf to further strengthen the conclusion that FRG1 broadly impacts the NMD pathway.
(3) Figure labels should be standardized throughout the manuscript (e.g., consistent use of "Ex" instead of mixed terms such as "Oex") to improve clarity and readability.
We thank the reviewer for noticing the inconsistency. We will ensure that all figure labels are standardized throughout the manuscript (e.g., using “Ex” consistently) to improve clarity and readability.
(4) The methods describing the generation of the frg1 knockout zebrafish could be expanded to include additional detail, and a schematic illustrating the CRISPR design, genotyping workflow, and validation strategy would enhance transparency and reproducibility.
We appreciate the reviewer’s suggestion and will expand the Methods section to provide additional detail on the generation of the frg1 knockout zebrafish. A schematic illustrating the CRISPR design, genotyping workflow, and validation strategy will also be included to enhance transparency and reproducibility.
(5) As FRG1 is a well-established tumor suppressor, additional cell-based functional assays under combined FRG1 and UPF1 perturbation (e.g., proliferation, migration, or survival assays) could help determine whether FRG1 influences cancer-associated phenotypes through modulation of the NMD pathway.
We thank the reviewer for this thoughtful and constructive suggestion. While FRG1 is indeed a well-established tumor suppressor, incorporating additional cell-based functional assays under combined FRG1 and UPF1 perturbation would significantly broaden the scope of the current study. The present work is focused on elucidating the molecular relationship between FRG1 and the NMD pathway. Investigation of downstream cancer-associated phenotypes represents an important and interesting direction for future studies, but is beyond the scope of the current manuscript.
(6) Given the claim that FRG1 inversely regulates NMD efficacy via UPF1, an epistasis experiment such as UPF1 overexpression in an FRG1-overexpressing background followed by an NMD reporter assay would provide stronger functional validation of pathway hierarchy.
We agree with the reviewer’s suggestion. To strengthen the functional validation of the proposed pathway hierarchy, we will perform an epistasis experiment by overexpressing UPF1 in an FRG1-overexpressing background and assess NMD activity using an established NMD reporter assay. The results of this experiment will be included in the revised manuscript.
References
(1) Palo A, Patel SA, Shubhanjali S, Dixit M. Dynamic interplay of Sp1, YY1, and DUX4 in regulating FRG1 transcription with intricate balance. Biochim Biophys Acta Mol Basis Dis. 2025 Mar;1871(3):167636.
(2) Sato H, Singer RH. Cellular variability of nonsense-mediated mRNA decay. Nat Commun. 2021 Dec 10;12(1):7203.
(3) Baird TD, Cheng KCC, Chen YC, Buehler E, Martin SE, Inglese J, et al. ICE1 promotes the link between splicing and nonsense-mediated mRNA decay. eLife. 2018 Mar 12;7:e33178.
(4) Chu V, Feng Q, Lim Y, Shao S. Selective destabilization of polypeptides synthesized from NMD-targeted transcripts. Mol Biol Cell. 2021 Dec 1;32(22):ar38.
(5) Udy DB, Bradley RK. Nonsense-mediated mRNA decay uses complementary mechanisms to suppress mRNA and protein accumulation. Life Sci Alliance. 2022 Mar;5(3):e202101217.
(6) Bertram K, El Ayoubi L, Dybkov O, Agafonov DE, Will CL, Hartmuth K, et al. Structural Insights into the Roles of Metazoan-Specific Splicing Factors in the Human Step 1 Spliceosome. Mol Cell. 2020 Oct 1;80(1):127-139.e6.
(7) Brazão TF, Demmers J, van IJcken W, Strouboulis J, Fornerod M, Romão L, et al. A new function of ROD1 in nonsense-mediated mRNA decay. FEBS Lett. 2012 Apr 24;586(8):1101–10.
(8) Sun CYJ, van Koningsbruggen S, Long SW, Straasheijm K, Klooster R, Jones TI, et al. Facioscapulohumeral muscular dystrophy region gene 1 is a dynamic RNA-associated and actin-bundling protein. J Mol Biol. 2011 Aug 12;411(2):397–416.
(9) Geng LN, Yao Z, Snider L, Fong AP, Cech JN, Young JM, et al. DUX4 activates germline genes, retroelements, and immune mediators: implications for facioscapulohumeral dystrophy. Dev Cell. 2012 Jan 17;22(1):38–51.
(10) Vitting-Seerup K, Sandelin A. The Landscape of Isoform Switches in Human Cancers. Mol Cancer Res MCR. 2017 Sep;15(9):1206–20.
Author response:
The following is the authors’ response to the original reviews
Comment to both reviewers:
We are very grateful for the thoughtful and constructive comments from both reviewers. During the revision, and in direct response to these comments, we performed additional control experiments for the cellular fluorescence measurements. These new data revealed that the weak increase in green fluorescence reported in our original submission does not depend on retron-expressed Lettuce RT-DNA or the DFHBI-1T fluorophore, but instead reflects stress-induced autofluorescence of E. coli (e.g. upon inducer and antibiotic treatment).
We also benchmarked the fluorogenic properties of Lettuce against the RNA FLAP Broccoli and found that Lettuce is ~100-fold less fluorogenic under optimal in vitro conditions. Consequently, with the currently available, in vitro- but not in vivo-optimized Lettuce variants, intracellular fluorescence cannot be reliably detected by microscopy or flow cytometry. We have therefore removed the original flow cytometry / and in-culture-fluorescence data and no longer claim detectable intracellular Lettuce fluorescence.
In the revised manuscript, we now directly demonstrate that retron-produced Lettuce RT-DNA can be purified from cells and remains functional ex vivo with a gel-based fluorophore-binding assays. Together, these data clarify the current limitations of DNA-based FLAPs for in vivo imaging, while still establishing retrons as a viable platform for intracellular production of functional DNA aptamers.
Reviewer #1 (Public Review):
Summary:
The authors use an interesting expression system called a retron to express single-stranded DNA aptamers. Expressing DNA as a single-stranded sequence is very hard - DNA is naturally double-stranded. However, the successful demonstration by the authors of expressing Lettuce, which is a fluorogenic DNA aptamer, allowed visual demonstration of both expression and folding. This method will likely be the main method for expressing and testing DNA aptamers of all kinds, including fluorogenic aptamers like Lettuce and future variants/alternatives.
Strengths:
This has an overall simplicity which will lead to ready adoption. I am very excited about this work. People will be able to express other fluorogenic aptamers or DNA aptamers tagged with Lettuce with this system.
We thank the reviewer for their thoughtful assessment and appreciate their encouraging remarks.
Weaknesses:
Several things are not addressed/shown:
(1) How stable are these DNA in cells? Half-life?
We thank the reviewer for this insightful question.
Retron RT-DNA forms a phage surveillance complex with the associated RT and effector protein[1-4]. Moreover, considering the unique ‘closed’ structure of RT-DNA[5] (with the ends of msr and msd bound either by 2’-5’ linkage and base paired region) and its noncoding function, we hypothesized that the RT-DNA must be exceptionally stable. Nevertheless, we attempted to determine half-life of the RT-DNA using qPCR for Eco2 RT-DNA. To this end, we designed an assay where we would first induce RT-DNA expression, use the induced cells to start a fresh culture without the inducers. We would then take aliquots from this fresh culture at different timepoints and determine RT-DNA abundance by qPCR.
We induced RT-DNA expression of retron Eco2 in BL21AI cells as described in the Methods. After overnight induction, cells were washed to remove IPTG and arabinose, diluted to OD<sub>600</sub> = 0.2 into fresh LB without inducers, and grown at 37°C. At the indicated time points, aliquots corresponding to OD<sub>600</sub> = 0.1 were boiled (95°C, 5 min), and 1 µL of the lysate was used as template in 20 µL qPCR reactions (see revised Methods for details).
Assuming RT-DNA degradation would occur by active degradation mechanisms (nuclease-mediated degradation) and dilution (cell growth and division), we determined the rate of degradation by the following equation
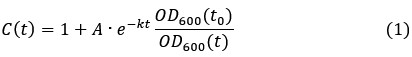
where is the degradation rate constant and the ratio  is the dilution factor which takes into account dilution by cell division. OD<sub>600</sub>(t) was determined by fitting the OD<sub>600</sub> measurements by the following the equation describing logistic growth:

Which yields the plots shown in Figure 2–figure supplement 1.
After substituting OD<sub>600</sub>(t) by the function in equation (2), we fit the experimental data for the fold-change of the RT-DNA to equation (1). Interestingly, the best fit (red) was obtained with a converging towards zero suggesting that the half-life of the RT-DNA is beyond the detection limit of our assay. To showcase typical half-lives of RNA, which are in the range of minutes in growing E. coli cells[6], we refitted the data using constant half-life of 15 and 30 minutes. In both cases, simulated curve deviated significantly from the experimental data further confirming that the half-life of the RT-DNA is probably orders of magnitude higher than the doubling time of E. coli under these optimal conditions. While we cannot exclude that the RT-DNA is still produced as a result of promotor leakiness, but we expect this effect to be low as the expression of RT-DNA in E. coli AI cells requires both the presence of IPGT and arabinose, which were thoroughly removed before inoculating the growth media with the starter culture. Overall, our data therefore argues for an exceptional stability of the RT-DNA in growing bacterial cells.
We have now included this new experimental data in the supplementary information.
(2) What concentration do they achieve in cells/copy numbers? This is important since it relates to the total fluorescence output and, if the aptamer is meant to bind a protein, it will reveal if the copy number is sufficient to stoichiometrically bind target proteins. Perhaps the gels could have standards with known amounts in order to get exact amounts of aptamer expression per cell?
The copy number of RT-DNA can be estimated based on the qPCR experiments. We use a pET28a plasmid, which is low-copy with typical copy number 15-20 per cell[7]. We determined the abundance of RT-DNA over plasmid/RT-DNA, upon induction, to be 8-fold, thereby indicating copy number of Eco2 RT-DNA to be roughly around 100-200. Assuming an average aqueous volume of E. coli of 1 femtoliter[6], the concentration of RT-DNA is ~250-500 nM. We have added this information to the revised version of the manuscript.
(3) Microscopic images of the fluorescent E. coli - why are these not shown (unless I missed them)? It would be good to see that cells are fluorescent rather than just showing flow sorting data.
In the original submission, we used flow cytometry as an orthogonal method to quantify the fluorescence output of intracellularly expressed Lettuce aptamer, anticipating that it would provide high-throughput, quantitative information on a large population of cells. During the revision, additional controls revealed that the weak increase in fluorescence we had previously attributed to Lettuce expression was in fact a stress-induced autofluorescence signal that occurred independently of retron RT-DNA and DFHBI-1T. We have therefore removed these data from the manuscript and no longer claim detectable intracellular Lettuce fluorescence.
To understand this limitation, we compared the in vitro fluorescence of Lettuce with that of the RNA FLAP Broccoli, which is commonly used for RNA live-cell imaging. Under optimal in vitro conditions, Lettuce shows ~100-fold lower fluorescence output than Broccoli (new Figure 3–figure supplement 5). Given this poor fluorogenicity and the low intracellular concentration of retron RT-DNA (now derived from the qPCR experiments), we conclude that the current Lettuce variants are below the detection threshold for in vivo imaging in our system. We now explicitly discuss this limitation and the need for further (in vivo) evolution of DNA-based FLAPs in the revised manuscript.
(4) I would appreciate a better Figure 1 to show all the intermediate steps in the RNA processing, the subsequent beginning of the RT step, and then the final production of the ssDNA. I did not understand all the processing steps that lead to the final product, and the role of the 2'OH.
We thank the referee for this comment. We have now made changes to Figure 1, showing the intermediate steps as well as a better illustration of the 2’-5’ linkage.
(5) I would like a better understanding or a protocol for choosing insertion sites into MSD for other aptamers - people will need simple instructions.
We appreciate the reviewer for bringing up this important point. We simulated the ssDNA structure using Vienna RNA fold with DNA parameters. Based on the resulting structure, we inserted Lettuce sequence in the single stranded and/or loop regions to minimise interference with the native msd fold. We have now included this information in the description of Figure 3.
(6) Can the gels be stained with DFHBI/other dyes to see the Lettuce as has been done for fluorogenic RNAs?
Yes. We have now included experiments where we performed in-gel staining with DFHBI-1T for both chemically synthesized Eco2-Lettuce surrogates as well as the heterologously expressed Eco2-Lettuce RT-DNA. We have added this data to the revised Figure 3 (panel C and E).
(7) Sometimes FLAPs are called fluorogenic RNA aptamers - it might be good to mention both terms initially since some people use fluorogenic aptamer as their search term.
We thank the referee for this useful suggestion. We have now included both terms in the introduction of the revised version.
(8) What E coli strains are compatible with this retron system?
Experimental and bioinformatic analysis have shown that retrons abundance varies drastically across different strains of E. coli[8-10]. For example, in an experimental investigation of 113 independent clinical isolates of E. coli, only 7 strains contained RT-DNA[8]. In our experiments, we have found that BL21AI strain is compatible with plasmid-borne Eco2. The fact that this strain has a native retron system (Eco1) allowed us to use it as internal standard. However, we were also able express Eco2 RT-DNA in conventional lab strains such as E. coli Top 10 (data not shown), indicating both ncRNA and the RT alone are sufficient for intracellular RT-DNA synthesis.
(9) What steps would be needed to use in mammalian cells?
We appreciate the reviewer’s thoughtful inquiry. Expression of retrons has been demonstrated in mammalian cells by Mirochnitchenko et al[11] and Lopez et al[12]. For example, Lopez et al demonstrate expression of retrons in mammalian cell lines using the Lipofectamine 3000 transfection protocol (Invitrogen) and a PiggyBac transposase system[12]. We also mention this in the discussion section of the revised manuscript. Expression of retron-encoded DNA aptamers in mammalian cells should be possible with these systems.
(10) Is the conjugated RNA stable and does it degrade to leave just the DNA aptamer?
We are grateful to the reviewer for their perceptive question. This usually depends on the specific retron system. For example, in case of certain retron systems such as retron Sen2, Eco4 and Eco7, the RNA is cleaved off, leaving behind just the ssDNA. In our case, with retron Eco2, the RNA remains stably bound to the ssDNA, thereby maintaining a stable hybrid RNA-DNA structure[10,13]. During the extraction of RT-DNA, the conjugated RNA is degraded during the RNase digestion step, and therefore is not visible in the gel images.
Reviewer #2 (Public Review):
Summary:
This manuscript explores a DNA fluorescent light-up aptamer (FLAP) with the specific goal of comparing activity in vitro to that in bacterial cells. In order to achieve expression in bacteria, the authors devise an expression strategy based on retrons and test four different constructs with the aptamer inserted at different points in the retron scaffold. They only observe binding for one scaffold in vitro, but achieve fluorescence enhancement for all four scaffolds in bacterial cells. These results demonstrate that aptamer performance can be very different in these two contexts.
Strengths:
Given the importance of FLAPs for use in cellular imaging and the fact that these are typically evolved in vitro, understanding the difference in performance between a buffer and a cellular environment is an important research question.
The return strategy utilized by the authors is thoughtful and well-described.
The observation that some aptamers fail to show binding in vitro but do show enhancement in cells is interesting and surprising.
We appreciate the reviewer’s thorough assessment.
Weaknesses:
This study hints toward an interesting observation, but would benefit from greater depth to more fully understand this phenomenon. Particularly challenging is that FLAP performance is measured in vitro by affinity and in cells by enhancement, and these may not be directly proportional. For example, it may be that some constructs have much lower affinity but a greater enhancement and this is the explanation for the seemingly different performance.
We thank the reviewer for this insightful comment. In response, we conducted a series of additional control experiments to better understand the apparent discrepancy between the in vitro and in vivo data. These experiments revealed that the previously reported increase in intracellular green fluorescence is independent of retron-expressed Lettuce RT-DNA and DFHBI-1T, and instead reflects stress-induced autofluorescence of E. coli upon inducer and antibiotic treatment. Our original negative controls (empty wild-type Eco2, uninduced cells in the presence of DFHBI-1T) were therefore not sufficient to rule out this effect.
As a consequence, we have removed the earlier FACS data from the manuscript and no longer claim detectable intracellular Lettuce fluorescence. The reviewer’s comment prompted us to re-examine the fluorogenicity of our constructs in vitro. We found that the 4Lev4 construct folds poorly and produces very low signal in in-gel staining assays with DFHBI-1T. In contrast, the 8LE variant (8-nt P1 stem at position v4) shows the highest fluorescence in these in-gel assays (new Figure 3C). Nevertheless, even this construct remains 100-fold less fluorogenic than the RNA-based FLAP Broccoli (new Figure 3–figure supplement 5), and we were unable to detect its intracellular fluorescence above background (new Figure 3–figure supplement 4).
To still directly demonstrate that retron-embedded Lettuce domains that are synthesized under intracellular conditions are functional, we modified our strategy in the revision and purified the expressed RT-DNA from E. coli, followed by in-gel staining with DFHBI-1T (new Figure 3E). Despite the challenge of obtaining sufficient amounts of ssDNA, this ex vivo approach clearly shows that the retron-produced Lettuce RT-DNA retains fluorogenic activity.
The authors only test enhancement at one concentration of fluorophore in cells (and this experimental detail is difficult to find and would be helpful to include in the figure legend). This limits the conclusions that can be drawn from the data and limits utility for other researchers aiming to use these constructs.
We appreciate this excellent suggestion. In the original experiments, the DFHBI-1T concentration in cells was chosen based on published conditions for live-cell imaging of the Broccoli RNA aptamer[14], which is substantially more fluorogenic than Lettuce. Motivated by the reviewer’s comment, we explored different fluorophore concentrations and additional controls to optimize the in vivo readout. These experiments showed that the weak intracellular fluorescence signal is dominated by stress-induced autofluorescence[15] (possibly due to the weaker antitoxin activity of the modified msd) and does not depend on the presence of Lettuce RT-DNA or DFHBI-1T.
Given the combination of low Lettuce fluorogenicity and low intracellular RT-DNA levels, we concluded that varying the fluorophore concentration alone does not provide a meaningful way to deconvolute these confounding factors in cells. Instead, we shifted our focus to a more direct assessment of Lettuce activity: we now demonstrate that retron-produced Lettuce RT-DNA can be purified from E. coli and retains fluorogenic activity in an in-gel staining assay with DFHBI-1T (new Figure 3E). We believe this revised strategy provides a clearer and more quantitative characterization of the system’s capabilities and limitations than the initial in vivo fluorescence measurements.
The FLAP that is used seems to have a relatively low fluorescence enhancement of only 2-3 fold in cells. It would be interesting to know if this is also the case in vitro. This is lower than typical FLAPs and it would be helpful for the authors to comment on what level of enhancement is needed for the FLAP to be of practical use for cellular imaging.
In the revised manuscript, we directly address this point by comparing the in vitro fluorescence of Lettuce (DNA) and Broccoli (RNA) under optimized buffer conditions. These experiments show that Broccoli is nearly two orders of magnitude more fluorogenic than Lettuce (new Figure 3-figure supplement 5). Thus, the low enhancement observed for Lettuce in cells is consistent with its intrinsically poor fluorogenicity in vitro.
Based on this comparison and on reported properties of RNA FLAPs such as Broccoli, we conclude that robust cellular imaging typically requires substantially higher fluorogenicity and dynamic range than currently provided by DNA-based Lettuce. In other words, under our conditions, Lettuce is close to or below the practical detection limit for in vivo imaging, whereas Broccoli performs well. We now explicitly state in the Discussion that further evolution and optimization of DNA FLAPs will be required to achieve fluorescence enhancements that are suitable for routine cellular imaging, and we position our work as a first demonstration that functional DNA aptamers can be produced in cells via retrons, while also delineating the current sensitivity limits.
Recommendations for the authors:
Reviewer #1 (Recommendations For The Authors):
Addgene accession numbers are not listed - how is this plasmid obtained?
The sequence was obtained from Millman et al[16], and ordered as gblock from IDT. The gblock was then cloned into a pET28a vector by Gibson assembly. We have now included this in the methods section.
Reviewer #2 (Recommendations For The Authors):
Page 2, line 40 - FLAPS should be FLAPs
We have corrected this typo in the revised version.
References
(1) Rousset, F. & Sorek, R. The evolutionary success of regulated cell death in bacterial immunity. Curr. Opin. Microbiol. 74, 102312; 10.1016/j.mib.2023.102312 (2023).
(2) Gao, L. et al. Diverse enzymatic activities mediate antiviral immunity in prokaryotes. Science 369, 1077–1084; 10.1126/science.aba0372 (2020).
(3) Carabias, A. et al. Retron-Eco1 assembles NAD+-hydrolyzing filaments that provide immunity against bacteriophages. Mol. Cell 84, 2185-2202.e12; 10.1016/j.molcel.2024.05.001 (2024).
(4) Wang, Y. et al. DNA methylation activates retron Ec86 filaments for antiphage defense. Cell Rep. 43, 114857; 10.1016/j.celrep.2024.114857 (2024).
(5) Wang, Y. et al. Cryo-EM structures of Escherichia coli Ec86 retron complexes reveal architecture and defence mechanism. Nat. Microbiol. 7, 1480–1489; 10.1038/s41564-022-01197-7 (2022).
(6) Milo, R. & Phillips, R. Cell biology by the numbers (Garland Science Taylor & Francis Group, New York NY, 2016).
(7) Sathiamoorthy, S. & Shin, J. A. Boundaries of the origin of replication: creation of a pET-28a-derived vector with p15A copy control allowing compatible coexistence with pET vectors. PLOS ONE 7, e47259; 10.1371/journal.pone.0047259 (2012).
(8) Sun, J. et al. Extensive diversity of branched-RNA-linked multicopy single-stranded DNAs in clinical strains of Escherichia coli. Proc. Natl. Acad. Sci. U. S. A. 86, 7208–7212; 10.1073/pnas.86.18.7208 (1989).
(9) Rice, S. A. & Lampson, B. C. Bacterial reverse transcriptase and msDNA. Virus Genes 11, 95–104; 10.1007/BF01728651 (1995).
(10) Simon, A. J., Ellington, A. D. & Finkelstein, I. J. Retrons and their applications in genome engineering. Nucleic Acids Res. 47, 11007–11019; 10.1093/nar/gkz865 (2019).
(11) Mirochnitchenko, O., Inouye, S. & Inouye, M. Production of single-stranded DNA in mammalian cells by means of a bacterial retron. J. Biol. Chem. 269, 2380–2383; 10.1016/S0021-9258(17)41956-9 (1994).
(12) Lopez, S. C., Crawford, K. D., Lear, S. K., Bhattarai-Kline, S. & Shipman, S. L. Precise genome editing across kingdoms of life using retron-derived DNA. Nat. Chem. Biol. 18, 199–206; 10.1038/s41589-021-00927-y (2022).
(13) Lampson, B. C. et al. Reverse transcriptase in a clinical strain of Escherichia coli: production of branched RNA-linked msDNA. Science 243, 1033–1038; 10.1126/science.2466332 (1989).
(14) Filonov, G. S., Moon, J. D., Svensen, N. & Jaffrey, S. R. Broccoli: rapid selection of an RNA mimic of green fluorescent protein by fluorescence-based selection and directed evolution. J. Am. Chem. Soc. 136, 16299–16308; 10.1021/ja508478x (2014).
(15) Renggli Sabine, Keck Wolfgang, Jenal Urs & Ritz Daniel. Role of Autofluorescence in Flow Cytometric Analysis of Escherichia coli Treated with Bactericidal Antibiotics. J. Bacteriol. 195, 4067–4073; 10.1128/jb.00393-13. (2013).
(16) Millman, A. et al. Bacterial Retrons Function In Anti-Phage Defense. Cell 183, 1551-1561.e12; 10.1016/j.cell.2020.09.065 (2020).
RRID: Addgene_138479
DOI: 10.1038/s41440-025-02535-y
Resource: RRID:Addgene_138479
Curator: @dhovakimyan1
SciCrunch record: RRID:Addgene_138479
RRID:SCR_008567
DOI: 10.1038/s41440-025-02535-y
Resource: Statistical Analysis System (RRID:SCR_008567)
Curator: @scibot
SciCrunch record: RRID:SCR_008567
RRID:CVCL_0554
DOI: 10.1038/s41440-025-02535-y
Resource: (KCB Cat# KCB 92027YJ, RRID:CVCL_0554)
Curator: @scibot
SciCrunch record: RRID:CVCL_0554
RRID:Addgene_12253
DOI: 10.1038/s41440-025-02535-y
Resource: RRID:Addgene_12253
Curator: @scibot
SciCrunch record: RRID:Addgene_12253
RRID:Addgene_102325
DOI: 10.1038/s41440-025-02535-y
Resource: RRID:Addgene_102325
Curator: @scibot
SciCrunch record: RRID:Addgene_102325
RRID:SCR_009550
DOI: 10.1186/s12967-026-07708-y
Resource: Connectivity Toolbox (RRID:SCR_009550)
Curator: @scibot
SciCrunch record: RRID:SCR_009550
y this: realize that it’s complicated, get confused, spend some time thinking about the information and what it means. And by the time you’ve done all the slow thinking for a college
Slower thinking forces you to analyze , access the gravity of , and improve a situation. For example when creating an essay instead of jumping into writing, slow thinking may cause you to pause and survey that material, and essay prompt. You may also come up with a format or plan first .
**Monitor de Salud de Workers:**Busca registros en network_operations con estado PROCESSING cuya última actualización (updated_at) sea mayor a X minutos (ej. 10m).**Acción:**1. Asume que el worker murió. 2. Si tiene reintentos disponibles, la vuelve a poner en QUEUED (Dead Letter recovery). 3. Si excedió el tiempo máximo de vida (TTL), la marca como FAILED y emite el evento de falla para que el usuario n
tiene que verificar en cola de peristencia y cola de redis para que no se vuelva a ejecutar.
tenerlo en cuenta para usar un flujo de alertas para nosotros en n8n, capturando el evento.
ROV-UC-07-02Aplicar Acción Tecnica de Límites (Throttling)PolicyMedia
provider no conoce de limites, sacar cu y todo lo asociado al mismo.
El provider_code debe corresponder a una integración activa y saludable.
1° TIENE QUE CONSULTAR BINDING SI ESTA LIGADO, RECIEN RECONOCE PROVIDER_CODE SIM_TYPE LO TIENE BINDING
ExecuteSimActivation -iccid por le momento -idempotency_key
PROV-CAP-12 | Resolución de Binding de Línea | Resolver y mantener en caché la asociación entre una línea (ICCID / IMSI / MSISDN / EID) y el proveedor/adaptador técnico correspondiente, con el objetivo de enrutar correctamente las operaciones técnicas. Gestiona cache, invalidación y fallback de resolución cuando el binding no está disponible localmente. | Sistema | 1 |
Note: This response was posted by the corresponding author to Review Commons. The content has not been altered except for formatting.
Learn more at Review Commons
We are grateful to the Review Commons reviewers for their constructive feedback, which has significantly strengthened the manuscript. In response, we have performed additional experiments, revised and expanded multiple figures, incorporated new statistical and functional analyses, and carefully edited the text to improve clarity and precision. A detailed point-by-point response to all reviewer comments, together with a summary of revised figures, is provided.
To address the reviewers' suggestions, we have conducted additional experiments that are now incorporated into new figures, or we have added new images to several existing figures where appropriate.
For this reason, please note that all figures have been renumbered to improve clarity and facilitate cross-referencing throughout the text. As recommended by Referee #3, all figure legends have been thoroughly revised to reflect these updates and are now labeled following the standard A-Z panel format, enhancing readability and ensuring easier identification. In addition, all figure legends now include the sample size for each statistical analysis.
For clarity and ease of reference, we provide below a comprehensive list of all figures included in the revised version. Figures that have undergone modifications are underlined.
Figure 1____. The first spermatogenesis wave in prepuberal mice.
This figure now includes amplified images of representative spermatocytes and a summary schematic illustrating the timeline of spermatogenesis. In addition, it now presents the statistical analysis of spermatocyte quantification to support the visual data.
__Figure 2.____ Cilia emerge across all stages of prophase I in spermatocytes during the first spermatogenesis wave. __
The images of this figure remain unchanged from the original submission, but all the graphs present now the statistical analysis of spermatocyte quantification.
Figure 3. Ultrastructure and markers of prepuberal meiotic cilia.
This figure remains unchanged from the original submission; however, we have replaced the ARL3-labelled spermatocyte image (A) with one displaying a clearer and more representative signal.
__Figure 4. Testicular tissue presents spermatocyte cysts in prepuberal mice and adult humans. __
This figure remains unchanged from the original submission.
__Figure 5. Cilia and flagella dynamics are correlated during prepuberal meiosis. __
This figure remains unchanged from the original submission.
__Figure 6. Comparative proteomics identifies potential regulators of ciliogenesis and flagellogenesis. __
This figure remains unchanged from the original submission.
Figure 7.____ Deciliation induces persistence of DNA damage in meiosis.
This figure has been substantially revised and now includes additional experiments analyzing chloral hydrate treatment, aimed at more accurately assessing DNA damage under both control and treated conditions. Images F-I and graph J are new.
Figure 8____. Aurora kinase A is a regulator of cilia disassembly in meiosis.
This figure is remodelled as the original version contained a mistake in previous panel II, for this, graph in new Fig.8 I has been corrected. In addition, it now contains additional data of αTubulin staining in arrested ciliated metaphases I after AURKA inhibition (new panel L1´).
__Figure 9. Schematic representation of the prepuberal versus adult seminiferous epithelium. __
This figure remains unchanged from the original submission.
__Supplementary Figure 1. Meiotic stages during the first meiotic wave. __
This figure remains unchanged from the original submission.
__Supplementary Figure 2 (new)____. __
This is a new figure that includes additional data requested by the reviewers. It includes additional markers of cilia in spermatocytes (glutamylated Tubulin/GT335), and the control data of cilia markers in non-ciliated spermatocytes. It also includes now the separated quantification of ciliated spermatocytes for each stage, as requested by reviewers, complementing graphs included in Figure 2.
Please note that with the inclusion of this new Supplementary Figure 2, the numbering of subsequent supplementary figures has been updated accordingly.
Supplementary Figure 3 (previously Suppl. Fig. 2)__. Ultrastructure of prophase I spermatocytes. __
This figure is equal in content to the original submission, but some annotations have been included.
Supplementary Figure 4 (previously Suppl. Fig. 3).__ Meiotic centrosome under the electron microscope. __
This figure remains unchanged from the original submission, but additional annotations have been included.
Supplementary Figure 5 (previously Suppl. Fig. 4)__. Human testis contains ciliated spermatocytes. __
This figure has been revised and now includes additional H2AX staining to better determine the stage of ciliated spermatocytes and improve their identification.
Supplementary Figure 6 (previously Suppl. Fig. 5). GLI1 and GLI3 readouts of Hedgehog signalling are not visibly affected in prepuberal mouse testes.
This figure has been remodeled and now includes the quantification of GLI1 and GLI3 and its corresponding statistical analysis. It also includes the control data for Tubulin, instead of GADPH.
Supplementary Figure 7 (previously Suppl. Fig. 6)__. CH and MLN8237 optimization protocol. __
This figure has been remodeled to incorporate control experiments using 1-hour organotypic culture treatment.
Supplementary Figure 8 (previously Suppl. Fig. 7)__. Tracking first meiosis wave with EdU pulse injection during prepubertal meiosis. __This figure remains unchanged from the original submission.
Supplementary Figure 9 (previously Suppl. Fig. 8)__. PLK1 and AURKA inhibition in cultured spermatocytes. __
This figure has been remodeled and now includes additional data on spindle detection in control and AURKA-inhibited spermatocytes (both ciliated and non ciliated).
DETAILED POINT-BY-POINT RESPONSE TO THE REVIEWERS
We will submit both the PDF version of the revised manuscript and the Word file with tracked changes relative to the original submission. Each modification made in response to reviewers' suggestions is annotated in the Word document within the corresponding section of the text. all new figures have also been uploaded to the system.
Response to the Referee #1
In this manuscript by Perez-Moreno et al., titled "The dynamics of ciliogenesis in prepubertal mouse meiosis reveal new clues about testicular maturation during puberty", the authors characterize the development of primary cilia during meiosis in juvenile male mice. The authors catalog a variety of testicular changes that occur as juvenile mice age, such as changes in testis weight and germ cell-type composition. They next show that meiotic prophase cells initially lack cilia, and ciliated meiotic prophase cells are detected after 20 days postpartum, coinciding with the time when post-meiotic spermatids within the developing testes acquire flagella. They describe that germ cells in juvenile mice harbor cilia at all substages of meiotic prophase, in contrast to adults where only zygotene stage meiotic cells harbor cilia. The authors also document that cilia in juvenile mice are longer than those in adults. They characterize cilia composition and structure by immunofluorescence and EM, highlighting that cilia polymerization may initially begin inside the cell, followed by extension beyond the cell membrane. Additionally, they demonstrate ciliated cells can be detected in adult human testes. The authors next perform proteomic analyses of whole testes from juvenile mice at multiple ages, which may not provide direct information about the extremely small numbers of ciliated meiotic cells in the testis, and is lacking follow up experiments, but does serve as a valuable resource for the community. Finally, the authors use a seminiferous tubule culturing system to show that chemical inhibition of Aurora kinase A likely inhibits cilia depolymerization upon meiotic prophase I exit and leads to an accumulation of metaphase-like cells harboring cilia. They also assess meiotic recombination progression using their culturing system, but this is less convincing.
Author response: We sincerely thank Ref #1 for the thorough and thoughtful evaluation of our manuscript. We are particularly grateful for the reviewer's careful reading and constructive feedback, which have helped us refine several sections of the text and strengthen our discussion. All comments and suggestions have been carefully considered and addressed, as detailed below.
__Major comments: __
There are a few issues with the experimental set up for assessing the effects of cilia depolymerization on DNA repair (Figure 7-II). First, how were mid pachytene cells identified and differentiated from early pachytene cells (which would have higher levels of gH2AX) in this experiment? I suggest either using H1t staining (to differentiate early/mid vs late pachytene) or the extent of sex chromosome synapsis. This would ensure that the authors are comparing similarly staged cells in control and treated samples. Second, what were the gH2AX levels at the starting point of this experiment? A more convincing set up would be if the authors measure gH2AX immediately after culturing in early and late cells (early would have higher gH2AX, late would have lower gH2AX), and then again after 24hrs in late cells (upon repair disruption the sampled late cells would have high gH2AX). This would allow them to compare the decline in gH2AX (i.e., repair progression) in control vs treated samples. Also, it would be informative to know the starting gH2AX levels in ciliated vs non-ciliated cells as they may vary.
Response:
We thank Ref #1 for this valuable comment, which significantly contributed to improving both the design and interpretation of the cilia depolymerization assay.
Following this suggestion, we repeated the experiment including 1-hour (immediately after culturing), and 24-hour cultures for both control and chloral hydrate (CH)-treated samples (n = 3 biological replicates). To ensure accurate staging, we now employ triple immunolabelling for γH2AX, SYCP3, and H1T, allowing clear distinction of zygotene (H1T−), early pachytene (H1T−), and late pachytene (H1T+) cells. The revised data (Figure 7) now provide a more complete and statistically robust analysis of DNA damage dynamics. These results confirm that CH-induced deciliation leads to persistence of the γH2AX signal at 24 hours, indicating impaired DNA repair progression in pachytene spermatocytes. The new images and graphs are included in the revised Figure 7.
Regarding the reviewer's final point about the comparison of γH2AX levels between ciliated and non-ciliated cells, we regret that direct comparison of γH2AX levels between ciliated and non-ciliated cells is not technically feasible. To preserve cilia integrity, all cilia-related imaging is performed using the squash technique, which maintains the three-dimensional structure of the cilia but does not allow reliable quantification of DNA damage markers due to nuclear distortion. Conversely, the nuclear spreading technique, used for DNA damage assessment, provides optimal visualization of repair foci but results in the loss of cilia due to cytoplasmic disruption during the hypotonic step. Given that spermatocytes in juvenile testes form developmentally synchronized cytoplasmic cysts, we consider that analyzing a statistically representative number of spermatocytes offers a valid and biologically meaningful measure of tissue-level effects.
In conclusion, we believe that the additional experiments and clarifications included in revised Figure 7 strengthen our conclusion that cilia depolymerization compromises DNA repair during meiosis. Further functional confirmation will be pursued in future works, since we are currently generating a conditional genetic model for a ciliopathy in our laboratory.
The authors analyze meiotic progression in cells cultured with/without AURKA inhibition in Figure 8-III and conclude that the distribution of prophase I cells does not change upon treatment. Is Figure 8-III A and B the same data? The legend text is incorrect, so it's hard to follow. Figure 8-III A shows a depletion of EdU-labelled pachytene cells upon treatment. Moreover, the conclusion that a higher proportion of ciliated zygotene cells upon treatment (Figure 8-II C) suggests that AURKA inhibition delays cilia depolymerization (page 13 line 444) does not make sense to me.
Response:
We thank Ref#1 for identifying this issue and for the careful examination of Figure 8. We discovered that the submitted version of Figure 8 contained a mismatch between the figure legend and the figure panels. The legend text was correct; however, the figure inadvertently included a non-corresponding graph (previously panel II-A), which actually belonged to Supplementary Figure 7 in the original submission. We apologize for this mistake.
This error has been corrected in the revised version. The updated Figure 8 now accurately presents the distribution of EdU-labelled spermatocytes across prophase I substages in control and AURKA-inhibited cultures (previously Figure 8-II B, now Figure 8-A). The corrected data show no significant differences in the proportions of EdU-labelled spermatocytes among prophase I substages after 24 hours of AURKA inhibition, confirming that meiotic progression is not delayed and that no accumulation of zygotene cells occurs under this treatment. Therefore, the observed increase in ciliated zygotene spermatocytes upon AURKA inhibition (new Figure 8 H-I) is best explained by a delay in cilia disassembly, rather than by an arrest or slowdown in meiotic progression. The figure legend and main text have been revised accordingly.
How do the authors know that there is a monopolar spindle in Figure 8-IV treated samples? Perhaps the authors can use a different Tubulin antibody (that does not detect only acetylated Tubulin) to show that there is a monopolar spindle.
Response:
We appreciate Ref#1 for this excellent suggestion. In the original submission (lines 446-447), we described that ciliated metaphase I spermatocytes in AURKA-inhibited samples exhibited monopolar spindle phenotypes. This description was based on previous reports showing that AURKA or PLK1 inhibition produces metaphases with monopolar spindles characterized by aberrant yet characteristic SYCP3 patterns, abnormal chromatin compaction, and circular bivalent alignment around non-migrated centrosomes (1). In our study, we observed SYCP3 staining consistent with these characteristic features of monopolar metaphases I.
However, we agree with Ref #1 that this could be better sustained with data. Following the reviewer's suggestion, we performed additional immunostaining using α-Tubulin, which labels total microtubules rather than only the acetylated fraction. For clarity purposes, the revised Figure 8 now includes α-Tubulin staining in the same ciliated metaphase I cells shown in the original submission, confirming the presence of defective microtubule polymerization and defective spindle organization. For clarity, we now refer to these ciliated metaphases I as "arrested MI". This new data further support our conclusion that AURKA inhibition disrupts spindle bipolarization and prevents cilia depolymerization, indicating that cilia maintenance and bipolar spindle organization are mechanistically incompatible events during male meiosis. The abstract, results, and discussion section has been expanded accordingly, emphasizing that the persistence of cilia may interfere with microtubule polymerization and centrosome separation under AURKA inhibition. The Discussion has been expanded to emphasize that persistence of cilia may interfere with centrosome separation and microtubule polymerization, contrasting with invertebrate systems -e.g. Drosophila (2) and P. brassicae (3)- in which meiotic cilia persist through metaphase I without impairing bipolar spindle assembly.
The authors state in the abstract that they provide evidence suggesting that centrosome migration and cilia depolymerization are mutually exclusive events during meiosis. This is not convincing with the data present in the current manuscript. I suggest amending this statement in the abstract.
Response:
We thank Ref#1 for this valuable observation, with which we fully agree. To avoid overstatement, the original statement has been removed from the Abstract, Results, and Discussion, and replaced with a more accurate formulation indicating that cilia maintenance and bipolar spindle formation are mutually exclusive events during mouse meiosis.
This revised statement is now directly supported by the new data presented in Figure 8, which demonstrate that AURKA inhibition prevents both spindle bipolarization and cilia depolymerization. We are grateful to the reviewer for highlighting this important clarification.
Minor comments:
The presence of cilia in all stages of meiotic prophase I in juvenile mice is intriguing. Why is the cellular distribution and length of cilia different in prepubertal mice compared to adults (where shorter cilia are present only in zygotene cells)? What is the relevance of these developmental differences? Do cilia serve prophase I functions in juvenile mice (in leptotene, pachytene etc.) that are perhaps absent in adults?
Related to the above point, what is the relevance of the absence of cilia during the first meiotic wave? If cilia serve a critical function during prophase I (for instance, facilitating DSB repair), does the lack of cilia during the first wave imply differing cilia (and repair) requirements during the first vs latter spermatogenesis waves?
In my opinion, these would be interesting points to discuss in the discussion section.
Response:
We thank the reviewer for these thoughtful observations, which we agree are indeed intriguing.
We believe that our findings likely reflect a developmental role for primary cilia during testicular maturation. We hypothesize that primary cilia at this stage might act as signaling organelles, receiving cues from Sertoli cells or neighboring spermatocytes and transmitting them through the cytoplasmic cysts shared by spermatocytes. Such intercellular communication could be essential for coordinating tissue maturation and meiotic entry during puberty. Although speculative, this hypothesis aligns with the established role of primary cilia as sensory and signaling hubs for GPCR and RTK pathways regulating cell differentiation and developmental patterning in multiple tissues (e.g., 1, 2). The Discussion section has been expanded to include these considerations.
On the other hand, while we cannot confirm that the cilia observed in zygotene spermatocytes persist until pachytene within the same cell, it is reasonable to speculate that they do, serving as longer-lasting signaling structures that facilitate testicular development during the critical pubertal window. In addition, the observation of ciliated spermatocytes at all prophase I substages at 20 dpp, together with our proteomic data, supports the idea that the emergence of meiotic cilia exerts a significant developmental impact on testicular maturation.
In summary, although we cannot yet define specific prophase I functions for meiotic cilia in juvenile spermatocytes, our data demonstrate that the first meiotic wave differs from later waves in cilia dynamics, suggesting distinct regulatory requirements between puberty and adulthood. These findings underscore the importance of considering developmental context when using the first meiotic wave as a model for studying spermatogenesis.
The authors state on page 9 lines 286-288 that the presence of cytoplasmic continuity via intercellular bridges (between developmentally synchronous spermatocytes) hints towards a mechanism that links cilia and flagella formation. Please clarify this statement. While the correlation between the timing of appearance of cilia and flagella in cells that are located within the same segment of the seminiferous tubule may be hinting towards some shared regulation, how would cytoplasmic continuity participate in this regulation? Especially since the cytoplasmic continuity is not between the developmentally distinct cells acquiring the cilia and flagella?
Response:
We thank Ref#1 for this excellent question and for the opportunity to clarify our statement.
The presence of intercellular bridges between spermatocytes is well known and has long been proposed to support germ cell communication and synchronization (1,2) as well as sharing mRNA (3) and organelles (4). A classic example is the Akap gene, located on the X chromosome and essential for the formation of the sperm fibrous sheath; cytoplasmic continuity through intercellular bridges allows Akap-derived products to be shared between X- and Y-bearing spermatids, thereby maintaining phenotypic balance despite transcriptional asymmetry (5). In addition, more recent work has further demonstrated that these bridges are critical for synchronizing meiotic progression and for processes such as synapsis, double-strand break repair, and transposon repression (6).
In this context, and considering our proteomic data (Figure 6), our statement did not intend to imply direct cytoplasmic exchange between ciliated and flagellated cells. Although our current methods do not allow comprehensive tracing of cytoplasmic continuity from the basal to the luminal compartment of the seminiferous epithelium, we plan to address this limitation using high-resolution 3D and ultrastructural imaging approaches in future studies.
Based on our current data, we propose that cytoplasmic continuity within developmentally synchronized spermatocyte cysts could facilitate the coordinated regulation of ciliogenesis, and similarly enable the sharing of regulatory factors controlling flagellogenesis within spermatid cysts. This coordination may occur through the diffusion of centrosomal or ciliary proteins, mRNAs, or signaling intermediates involved in the regulation of microtubule dynamics. However, we cannot exclude the possibility that such cytoplasmic continuity extends across all spermatocytes derived from the same spermatogonial clone, potentially providing a larger regulatory network.]] This mechanism could help explain the temporal correlation we observe between the appearance of meiotic cilia and the onset of flagella formation in adjacent spermatids within the same seminiferous segment.
We have revised the Discussion to explicitly clarify this interpretation and to note that, although hypothetical, it is consistent with established literature on cytoplasmic continuity and germ cell coordination.
Individual germ cells in H&E-stained testis sections in Figure 1-II are difficult to see. I suggest adding zoomed-in images where spermatocytes/round spermatids/elongated spermatids are clearly distinguishable.
Response:
Ref#1 is very right in this suggestion. We have revised Figure 1 to improve the quality of the H&E-stained testis sections and have added zoomed-in panels where spermatocytes, round spermatids, and elongated spermatids are clearly distinguishable. These additions significantly enhance the clarity and interpretability of the figure.
In Figure 2-II B, the authors document that most ciliated spermatocytes in juvenile mice are pachytene. Is this because most meiotic cells are pachytene? Please clarify. If the data are available (perhaps could be adapted from Figure 1-III), it would be informative to see a graph representing what proportions of each meiotic prophase substages have cilia.
Response:
We thank the reviewer for this valuable observation. Indeed, the predominance of ciliated pachytene spermatocytes reflects the fact that most meiotic cells in juvenile testes are at the pachytene stage (Figure 1). We have clarified this point in the text and have added a new supplementary figure (Supplementary Figure 2, new figure) presenting a graph showing the proportion of spermatocytes at each prophase I substage that possess primary cilia. This visualization provides a clearer quantitative overview of ciliation dynamics across meiotic substages.
I suggest annotating the EM images in Sup Figure 2 and 3 to make it easier to interpret.
Response:
We thank the reviewer for this helpful suggestion. We have now added annotations to the EM images in Supplementary Figures 3 and 4 to facilitate their interpretation. These visual guides help readers more easily identify the relevant ultrastructural features described in the text.
The authors claim that the ratio between GLI3-FL and GLI3-R is stable across their analyzed developmental window in whole testis immunoblots shown in Sup Figure 5. Quantifying the bands and normalizing to the loading control would help strengthen this claim as it hard to interpret the immunoblot in its current form.
Response:
We thank the reviewer for this valuable suggestion. Following this recommendation, Supplementary Figure 5 has been revised to include quantification of GLI1 and GLI3 protein levels, normalized to the loading control.
After quantification, we observed statistically significant differences across developmental stages. Specifically, GLI1 expression is slightly higher at 21 dpp compared to 8 dpp. For GLI3, we performed two complementary analyses:
We have expanded the Discussion to address these findings and to highlight the potential involvement of the Desert Hedgehog (DHH) pathway, which plays key roles in testicular development, Sertoli-germ cell communication, and spermatogenesis (1, 2, 3). We plan to investigate these pathways further in future studies.
There are a few typos throughout the manuscript. Some examples: page 5 line 172, Figure 3-I legend text, Sup Figure 5-II callouts, Figure 8-III legend, page 15 line 508, page 17 line 580, page 18 line 611.
Response:
We thank the reviewer for detecting this. All typographical errors have been corrected, and figure callouts have been reviewed for consistency.
Response to the Referee #2
This study focuses on the dynamic changes of ciliogenesis during meiosis in prepubertal mice. It was found that primary cilia are not an intrinsic feature of the first wave of meiosis (initiating at 8 dpp); instead, they begin to polymerize at 20 dpp (after the completion of the first wave of meiosis) and are present in all stages of prophase I. Moreover, prepubertal cilia (with an average length of 21.96 μm) are significantly longer than adult cilia (10 μm). The emergence of cilia coincides temporally with flagellogenesis, suggesting a regulatory association in the formation of axonemes between the two. Functional experiments showed that disruption of cilia by chloral hydrate (CH) delays DNA repair, while the AURKA inhibitor (MLN8237) delays cilia disassembly, and centrosome migration and cilia depolymerization are mutually exclusive events. These findings represent the first detailed description of the spatiotemporal regulation and potential roles of cilia during early testicular maturation in mice. The discovery of this phenomenon is interesting; however, there are certain limitations in functional research.
We thank Referee #2 for their careful reading of the manuscript and for highlighting important limitations regarding functional interpretation.
Our primary objective in this study was to provide a rigorous structural, temporal, and developmental characterization of meiotic ciliogenesis in the mammalian testis, a process for which almost no prior data exist. Given this lack of foundational information, we focused on establishing when, where, and in which meiotic stages primary cilia form during prepubertal development, and on identifying candidate regulatory pathways using complementary imaging, proteomic, and pharmacological approaches.
We agree that genetic ablation models would provide the most direct means to test ciliary function during spermatogenesis. However, we believe that such functional analyses must be preceded by a detailed developmental and phenotypic framework, which was previously unavailable. The present study therefore represents a necessary first step, defining the dynamics, ultrastructure, and molecular context of meiotic cilia during the transition from juvenile to adult spermatogenesis. We are currently generating conditional genetic models to directly address functional mechanisms in future work.
Regarding the temporal coincidence between the emergence of meiotic cilia and the onset of flagellogenesis, we do not interpret this observation as evidence of stochastic or non-functional protein expression. Rather, we present it as a developmental correlation that may reflect shared regulatory constraints on axonemal assembly during testicular maturation. We have clarified in the revised manuscript that this relationship is descriptive and hypothesis-generating, and we avoid assigning direct causal roles.
With respect to the proteomic analysis, we agree that proteomics alone cannot establish function. Our intent was not to assign causality, but to provide a developmental, hypothesis-generating dataset identifying candidate regulators that are enriched at the precise developmental window when both meiotic cilia and spermatid flagella first emerge. We have revised the text to explicitly frame these data as a resource for future mechanistic studies, rather than as direct functional evidence.
Taken together, we believe that the revised manuscript now more accurately reflects the scope and limitations of the study, while providing a robust and much-needed developmental framework for future genetic and functional analyses of meiotic ciliogenesis in mammals. We would be happy to further clarify any aspect of these interpretations if the reviewer or editor considers it helpful.
Major points:
The prepubertal cilia in spermatocytes discovered by the authors lack specific genetic ablation to block their formation, making it impossible to evaluate whether such cilia truly have functions. Because neither in the first wave of spermatogenesis nor in adult spermatogenesis does this type of cilium seem to be essential. In addition, the authors also imply that the formation of such cilia appears to be synchronized with the formation of sperm flagella. This suggests that the production of such cilia may merely be transient protein expression noise rather than a functionally meaningful cellular structure.
Response:
We agree that a genetic ablation model would represent the ideal approach to directly test cilia function in spermatogenesis. However, given the complete absence of prior data describing the dynamics of ciliogenesis during testis development, our priority in this study was to establish a rigorous structural and temporal characterization of this process in the main mammalian model organism, the mouse. This systematic and rigorous phenotypic characterization is a necessary first step before any functional genetics could be meaningfully interpreted.
To our knowledge, this study represents the first comprehensive analysis of ciliogenesis during prepubertal mouse meiosis, extending our previous work on adult spermatogenesis (1). Beyond these two contributions, only four additional studies have addressed meiotic cilia-two in zebrafish (2, 3), with Mytlys et al. also providing preliminary observations relevant to prepubertal male meiosis that we discuss in the present work, one in Drosophila (4) and a recent one in butterfly (5). No additional information exists for mammalian gametogenesis to date.
We thus maintain that the present work constitutes a necessary and timely contribution, providing a robust reference dataset that will facilitate and guide future functional studies in the field of cilia and meiosis.
Taking this into account, we would be very pleased to address any additional, concrete suggestions from Ref#2 that could further strengthen the current version of the manuscript
The high expression of axoneme assembly regulators such as TRiC complex and IFT proteins identified by proteomic analysis is not particularly significant. This time point is precisely the critical period for spermatids to assemble flagella, and TRiC, as a newly discovered component of flagellar axonemes, is reasonably highly expressed at this time. No intrinsic connection with the argument of this paper is observed. In fact, this testicular proteomics has little significance.
Response:
We appreciate this comment but respectfully disagree with the reviewer's interpretation of our proteomic data. To our knowledge, this is the first proteomic study explicitly focused on identifying ciliary regulators during testicular development at the precise window (19-21 dpp) when both meiotic cilia and spermatid flagella first emerge.
While Piprek et al (1) analyzed the expression of primary cilia in developing gonads, proteomic data specifically covering the developmental transition at 19-21 dpp were not previously available. Furthermore, a recent cell-sorting study (2), detected expression of cilia proteins in pachytene spermatocytes compared to round spermatids, but did not explore their functional relevance or integrate these data with developmental timing or histological context.
In contrast, our dataset integrates histological staging, high-resolution microscopy, and quantitative proteomics, revealing a set of candidate regulators (including DCAF7, DYRK1A, TUBB3, TUBB4B, and TRiC) potentially involved in cilia-flagella coordination. We view this as a hypothesis-generating resource that outlines specific proteins and pathways for future mechanistic studies on both ciliogenesis and flagellogenesis in the testis.
Although we fully agree that proteomics alone cannot establish causal function, we believe that dismissing these data as having little significance overlooks their value as the first molecular map of the testis at the developmental window when axonemal structures arise. Our dataset provides, for the first time, an integrated view of proteins associated with ciliary and flagellar structures at the developmental stage when both axonemal organelles first appear. We thus believe that our proteomic dataset represents an important and novel contribution to the understanding of testicular development and ciliary biology.
Considering this, we would again welcome any specific suggestions from Ref#2 on additional analyses or clarifications that could make the relevance of this dataset even clearer to readers.
In "The dynamics of ciliogenesis in prepubertal mouse meiosis reveals new clues about testicular development" Pérez-Moreno, et al. explore primary cilia in prepubertal mouse spermatocytes. Using a combination of microscopy, proteomics, and pharmacological perturbations, the authors carefully characterize prepubertal spermatocyte cilia, providing foundational work regarding meiotic cilia in the developing mammalian testis.
Response: We sincerely thank Ref#3 for their positive assessment of our work and for the thoughtful suggestions that have helped us strengthen the manuscript. We are pleased that the reviewer recognizes both the novelty and the relevance of our study in providing foundational insights into meiotic ciliogenesis during prepubertal testicular development. All specific comments have been carefully considered and addressed as detailed below.
Major concerns:
The authors provide evidence consistent with cilia not being present in a larger percentage of spermatocytes or in other cells in the testis. The combination of electron microscopy and acetylated tubulin antibody staining establishes the presence of cilia; however, proving a negative is challenging. While acetylated tubulin is certainly a common marker of cilia, it is not in some cilia such as those in neurons. The authors should use at least one additional cilia marker to better support their claim of cilia being absent.
Response:
We thank the reviewer for this helpful suggestion. In the revised version, we have strengthened the evidence for cilia identification by including an additional ciliary marker, glutamylated tubulin (GT335), in combination with acetylated tubulin and ARL13B (which were included in the original submission). These data are now presented in the new Supplementary Figure 2, which also includes an example of a non-ciliated spermatocyte showing absence of both ARL13B and AcTub signals.
Taken together, these markers provide a more comprehensive validation of cilia detection and confirm the absence of ciliary labelling in non-ciliated spermatocytes.
The conclusion that IFT88 localizes to centrosomes is premature as key controls for the IFT88 antibody staining are lacking. Centrosomes are notoriously "sticky", often sowing non-specific antibody staining. The authors must include controls to demonstrate the specificity of the staining they observe such as staining in a genetic mutant or an antigen competition assay.
Response:
We appreciate the reviewer's concern and fully agree that antibody specificity is critical when interpreting centrosomal localization. The IFT88 antibody used in our study is commercially available and has been extensively validated in the literature as both a cilia marker (1, 2), and a centrosome marker in somatic cells (3). Labelling of IFT88 in centrosomes has also been previously described using other antibodies (4, 5). In our material, the IFT88 signal consistently appears at one of the duplicated centrosomes and at both spindle poles-patterns identical to those reported in somatic cells. We therefore consider the reported meiotic IFT88 staining as specific and biologically reliable.
That said, we agree that genetic validation would provide the most definitive confirmation. We would like to inform that we are currently since we are currently generating a conditional genetic model for a ciliopathy in our laboratory that will directly assess both antibody specificity and functional consequences of cilia loss during meiosis. These experiments are in progress and will be reported in a follow-up study.
There are many inconsistent statements throughout the paper regarding the timing of the first wave of spermatogenesis. For example, the authors state that round spermatids can be detected at 21dpp on line 161, but on line 180, say round spermatids can be detected a 19dpp. Not only does this lead to confusion, but such discrepancies undermine the validity of the rest of the paper. A summary graphic displaying key events and their timing in the first wave of spermatogenesis would be instrumental for reader comprehension and could be used by the authors to ensure consistent claims throughout the paper.
Response:
We thank the reviewer for identifying this inconsistency and apologize for the confusion. We confirm that early round spermatids first appear at 19 dpp, as shown in the quantitative data (Figure 1J). This can be detected in squashed spermatocyte preparations, where individual spermatocytes and spermatids can be accurately quantified. The original text contained an imprecise reference to the histological image of 21 dpp (previous line 161), since certain H&E sections did not clearly show all cell types simultaneously. However, we have now revised Figure 1, improving the image quality and adding a zoomed-in panel highlighting early round spermatids. Image for 19 dpp mice in Fig 1D shows early, yet still aflagellated spermatids. The first ciliated spermatocytes and the earliest flagellated spermatids are observed at 20 dpp. This has been clarified in the text.
In addition, we also thank the reviewer for the suggestion of adding a summary graphic, which we agree greatly facilitates reader comprehension. We have added a new schematic summary (Figure 1K) illustrating the key stages and timing of the first spermatogenic wave.
In the proteomics experiments, it is unclear why the authors assume that changes in protein expression are predominantly due to changes within the germ cells in the developing testis. The analysis is on whole testes including both the somatic and germ cells, which makes it possible that protein expression changes in somatic cells drive the results. The authors need to justify why and how the conclusions drawn from this analysis warrant such an assumption.
Response:
We agree with the reviewer that our proteomic analysis was performed on whole testis samples, which contain both germ and somatic cells. Although isolation of pure spermatocyte populations by FACS would provide higher resolution, obtaining sufficient prepubertal material for such analysis would require an extremely large number of animals. To remain compliant with the 3Rs principle for animal experimentation, we therefore used whole-testis samples from three biological replicates per age.
We acknowledge that our assumption-that the main differences arise from germ cells-is a simplification. However, germ cells constitute the vast majority of testicular cells during this developmental window and are the population undergoing major compositional changes between 15 dpp and adulthood. It is therefore reasonable to expect that a substantial fraction of the observed proteomic changes reflects alterations in germ cells. We have clarified this point in the revised text and have added a statement noting that changes in somatic cells could also contribute to the proteomic profiles.
The authors should provide details on how proteins were categorized as being involved in ciliogenesis or flagellogenesis, specifically in the distinction criteria. It is not clear how the categorizations were determined or whether they are valid. Thus, no one can repeat this analysis or perform this analysis on other datasets they might want to compare.
Response:
We thank the reviewer for this opportunity to clarify our approach. The categorization of protein as being involved in ciliogenesis or flagellogenesis was based on their Gene Ontology (GO) cellular component annotations obtained from the PANTHER database (Version 19.0), using the gene IDs of the Differentially Expressed Proteins (DEPs). Specifically, we used the GO terms cilium (GO:0005929) and motile cilium (GO:0031514). Since motile cilium is a subcategory of cilium, proteins annotated only with the general cilium term, but not included under motile cilium, were considered to be associated with primary cilia or with shared structural components common to different types of cilia. These GO terms are represented in the bottom panel of the Figure 6.
This information has been added to the Methods section and referenced in the Results for transparency and reproducibility.
In the pharmacological studies, the authors conclude that the phenotypes they observe (DNA damage and reduced pachytene spermatocytes) are due to loss of or persistence of cilia. This overinterprets the experiment. Chloral hydrate and MLN8237 certainly impact ciliation as claimed, but have additional cellular effects. Thus, it is possible that the observed phenotypes were not a direct result of cilia manipulation. Either additional controls must address this or the conclusions need to be more specific and toned down.
Response:
We thank the reviewer for this fair observation and have taken steps to strengthen and refine our interpretation. In the revised version, we now include data from 1-hour and 24-hour cultures for both control and chloral hydrate (CH)-treated samples (n = 3 biological replicates). The triple immunolabelling with γH2AX, SYCP3, and H1T allows accurate staging of zygotene (H1T⁻), early pachytene (H1T⁻), and late pachytene (H1T⁺) spermatocytes.
The revised Figure 7 now provides a more complete and statistically supported analysis of DNA damage dynamics, confirming that CH-induced deciliation leads to persistent γH2AX signal at 24 hours, indicative of delayed or defective DNA repair progression. We have also toned down our interpretation in the Discussion, acknowledging that CH could affect other cellular pathways.
As mentioned before, the conditional genetic model that we are currently generating will allow us to evaluate the role of cilia in meiotic DNA repair in a more direct and specific way.
Assuming the conclusions of the pharmacological studies hold true with the proper controls, the authors still conflate their findings with meiotic defects. Meiosis is not directly assayed, which makes this conclusion an overstatement of the data. The conclusions need to be rephrased to accurately reflect the data.
Response:
We agree that this aspect required clarification. As noted above, we have refined both the Results and Discussion sections to make clear that our assays specifically targeted meiotic spermatocytes.
We now present data for meiotic stages at zygotene, early pachytene and late pachytene. This is demonstrated with the labelling for SYCP3 and H1T, both specific marker for meiosis that are not detectable in non meiotic cells. We believe that this is indeed a way to assay the meiotic cells, however, we have specified now in the text that we are analysing potential defects in meiosis progression. We are sorry if this was not properly explained in the original manuscript: it is now rephrased in the new version both in the results and discussion section.
It is not clear why the authors chose not to use widely accepted assays of Hedgehog signaling. Traditionally, pathway activation is measured by transcriptional output, not GLI protein expression because transcription factor expression does not necessarily reflect transcription levels of target genes.
Response:
We agree with the reviewer that measuring mRNA levels of Hedgehog pathway target genes, typically GLI1 and PTCH1, is the most common method for measuring pathway activation, and is widely accepted by researchers in the field. However, the methods we use in this manuscript (GLI1 and GLI3 immunoblots) are also quite common and widely accepted:
Regarding GLI1 immunoblot, many articles have used this method to monitor Hedgehog signaling, since GLI1 protein levels have repeatedly been shown to also go up upon pathway activation, and down upon pathway inhibition, mirroring the behavior of GLI1 mRNA. Here are a few publications that exemplify this point:
As for GLI3 immunoblot, Hedgehog pathway activation is well known to inhibit GLI3 proteolytic processing from its full length form (GLI3-FL) to its transcriptional repressor (GLI3-R), and such processing is also commonly used to monitor Hedgehog signal transduction, of which the following are but a few examples:
In summary, we think that we have used two well established markers to look at Hedgehog signaling (three, if we include the immunofluorescence analysis of SMO, which we could not detect in meiotic cilia).
These Hh pathway analyses did not provide any convincing evidence that the prepubertal cilia we describe here are actively involved in this pathway, even though Hh signaling is cilia-dependent and is known to be active in the male germline (Sahin et al 2014 Andrology PMID: 24574096; Mäkelä et al 2011 Reproduction PMID: 21893610; Bitgood et al 1996 Curr Biol. PMID: 8805249).
That said, we fully agree that our current analyses do not allow us to draw definitive conclusions regarding Hedgehog pathway activity in meiotic cilia, and we now state this explicitly in the revised Discussion.
Also in the Hedgehog pathway experiment, it is confusing that the authors report no detection of SMO yet detect little to no expression of GLIR in their western blot. Undetectable SMO indicates Hedgehog signaling is inactive, which results in high levels of GLIR. The impact of this is that it is not clear what is going on with Hh signaling in this system.
Response:
It is true that, when Hh signaling is inactive (and hence SMO not ciliary), the GLI3FL/GLI3R ratio tends to be low.
Although our data in prepuberal mouse testes show a strong reduction in total GLI3 protein levels (GLI3FL+GLI3R) as these mice grow older, this downregulation of total GLI3 occurs without any major changes in the GLI3FL/GLI3R ratio, which is only modestly affected (suppl. Figure 6).
Hence, since it is the ratio that correlates with Hh signaling rather than total levels, we do not think that the GLI3R reduction we see is incompatible with our non-detection of SMO in cilia: it seems more likely that overall GLI3 expression is being downregulated in developing testes via a Hh-independent mechanism.
Also potentially relevant here is the fact that some cell types depend more on GLI2 than on GLI3 for Hh signaling. For instance, in mouse embryos, Hh-mediated neural tube patterning relies more heavily on GLI2 processing into a transcriptional activator than on the inhibition of GLI3 processing into a repressor. In contrast, the opposite is true during Hh-mediated limb bud patterning (Nieuwenhuis and Hui 2005 Clin Genet. PMID: 15691355). We have not looked at GLI2, but it is conceivable that it could play a bigger role than GLI3 in our model.
Moreover, several forms of GLI-independent non-canonical Hh signaling have been described, and they could potentially play a role in our model, too (Robbins et al 2012 Sci Signal. PMID: 23074268).
We have revised the discussion to clarify some of these points.
All in all, we agree that our findings regarding Hh signaling are not conclusive, but we still think they add important pieces to the puzzle that will help guide future studies.
There are multiple instances where it is not clear whether the authors performed statistical analysis on their data, specifically when comparing the percent composition of a population. The authors need to include appropriate statistical tests to make claims regarding this data. While the authors state some impressive sample sizes, once evaluated in individual categories (eg specific cell type and age) the sample sizes of evaluated cilia are as low as 15, which is likely underpowered. The authors need to state the n for each analysis in the figures or legends.
We thank the reviewer for highlighting this important issue. We have now included the sample size (n) for every analysis directly in the figure legends. Although this adds length, it improves transparency and reproducibility.
Regarding the doubts of Ref#3 about the different sample sizes, the number of spermatocytes quantified in each stage is in agreement with their distribution in meiosis (example, pachytene lasts for 10 days this stage is widely represented in the preparations, while its is much difficult to quantify metaphases I that are less present because the stage itself lasts for less than 24hours). Taking this into account, we ensured that all analyses remain statistically valid and representative, applying the appropriate statistical tests for each dataset. These details are now clearly indicated in the revised figures and legends.
Minor concerns:
The phrase "lactating male" is used throughout the paper and is not correct. We assume this term to mean male pups that have yet to be weaned from their lactating mother, but "lactating male" suggests a rare disorder requiring medical intervention. Perhaps "pre-weaning males" is what the authors meant.
Response:
We thank the reviewer for noticing this terminology error. The expression has been corrected to "pre-weaning males" throughout the manuscript.
The convention used to label the figures in this paper is confusing and difficult to read as there are multiple panels with the same letter in the same figure (albeit distinct sections). Labeling panels in the standard A-Z format is preferred. "Panel Z" is easier to identify than "panel III-E".
Response:
We thank the reviewer for this suggestion. All figures have been relabelled using the standard A-Z panel format, ensuring consistency and easier readability across the manuscript.
Note: This response was posted by the corresponding author to Review Commons. The content has not been altered except for formatting.
Learn more at Review Commons
Reviewer #1 (R1)
R1 General statement: Here, Escalera-Maurer and colleagues, present an up-to-date distribution of homologues of Hok toxic proteins belonging to the well-annotated, but otherwise functionally obscure, hok/Sok type I toxin-antitoxin system, across the RefSeq database. Although such computational analyses have been done in the past, the authors here find many more hok homologs than described before, and they categorise their distribution based on whether they are encoded on chromosomes, plasmids, or (pro)phages. These computational analyses are in general tricky with T1TAs, as their toxins are quite short (~50 amino acids, as is the case for Hok), which is why the authors here used three separate approaches to expand their search (nucleotide-level BLAST, protein-homology, or both combined with Infernal). The authors cluster the Hok homologues they find based on a 60% sequence identity cut-off (expanding the known clusters in the process), and proceeded to test 31 candidates belonging to 15 sequence-clusters for their toxicity in Salmonella Typhimurium LT2, showing that 30/31 were toxic upon induction. An interesting finding from their endeavours is that hok/Sok homologues are enriched within prophages and large plasmids, but are not enriched near bacterial anti-phage defense systems (in contrast to the SymE/SymR T1TA). The findings suggest that hok/Sok are indeed sometimes linked to phage and plasmid biology, although they might not be antiphage defenses per se (they have been clearly shown in the past to be addiction modules, and this is still clearly true).
Authors' answer to R1 General statement: __We do not state here that hok/Sok are not anti-phage defense systems, but we simply observe that they do not cluster with anti-phage defense systems. We have also observed (unpublished data) that known defense systems do not systematically cluster together with other defense systems. Therefore, strong association with other defense systems would have been a strong indication of their function in phage defense but the fact that we did not observe any association with defense systems does not exclude they are involved in phage defense. __
R1_C1: My expertise lies towards the experimental side of the authors' work, I thus cannot comment on the accuracy/robustness of the computational analyses performed here. The authors do a fine job in clearly stating their findings overall; I could follow most of the conclusions, and I deemed that most of them were supported by their work. Additionally, I find that this paper is a missed opportunity to uncover even more novel biology connected to the interesting hok/Sok T1TAs. The paper does not provide a new framework to think about what is the function of the chromosomal/prophage hok/Sok T1TA systems, although I realize that this is very difficult to accomplish, especially when considering that hok/Sok systems have been around in the literature for almost 40 years.
Authors' answer to R1_C1: We agree with the reviewer, as we indeed performed this analysis having in mind to clarify the role of hok/Sok systems. However, we still believe that our strong survey of Hok loci put in light their enrichment in various mobile genetic elements, such as prophage and large conjugative plasmids, which is indubitably linked to their function. In addition, our study will guide future experimental efforts in uncovering the function of these systems, for example by helping researchers to select relevant homologs to test for a specific function.__ __
R1_C2: My major comment is in regard to the Hok toxicity assays (Fig. 2). The authors state in the discussion that "Hok peptides originating from chromosomes are as toxic as those from plasmids", but I believe that the way that they tested their constructs might not have allowed them to see toxicity differences between the two groups. Specifically, using the multi-copy plasmid pAZ3 (pBR322 origin of replication; ~15-20 plasmid copies per chromosome) to induce the different Hok toxin homologues in Salmonella Typhimurium LT2 with arabinose might have masked toxicity differences that would otherwise be apparent on the chromosomal expression-level.
Some of the authors themselves have previously used the FASTBAC-Seq method to study the Hok homologue from plasmid R1, a useful technique during which a toxin is integrated in the chromosome, in order to study their toxicity under natural levels of expression. I believe that an ideal scenario would be to apply FASTBAC-seq to some of the 31 Hok homologues described here (e.g., a subset of plasmidic vs chromosomal Hok homologues) to shed light on potential toxicity differences between the Hok clusters. This would increase the value of the presented study.
Alternatively, the authors could employ an L-arabinose concentration gradient to titrate the expression levels of the Hok toxins in order to potentially see different toxicity levels from the different homologues. However, this is not going to work in the system as they are using it now for two reasons:
- a) the S. Typhimurium LT2 (STm) used here has its arabinose utilization operon intact (araBAD), which means that Salmonella can catabolize arabinose to use it as a carbon source. This catabolization process interferes with the arabinose induction (i.e., Salmonella eats arabinose instead of using it as the Hok inducer). To ameliorate this, the authors could delete the araBAD operon in STm, rendering STm incapable of catabolizing arabinose, and repeat the experiments in that strain. Or use E. coli BW25113 as the expression host, which already has the araBAD operon deleted (it is not clear to me why the different Hok homologues would not be toxic in E. coli, as the different Hok homologues are widely diverse in sequence, as the authors found here).
- b) Even with the araBAD operon deleted, the arabinose induction would be bimodally on or off in the population, due to the bimodal expression of the arabinose transporter (AraE; see Khlebnikov et al., 2002). This would again not allow for titratable arabinose-inducible expression from different concentrations of arabinose. The solution for this would be to co-express a separate plasmid with araE, which would render every cell the same in regards to arabinose permeability, and thus the system would be titratable (as explained in Khlebnikov et al., 2002). Therefore, if the authors would be interested to go towards this route, they would have to first delete the araBAD from STm, then transform STm with an araE plasmid, and redo the experiments. In addition, I would propose to the authors to use the drop plate method (agar plate-based), which is more sensitive compared to the liquid assays employed here.
Having said all that, I understand that all this experimental work would be strenuous and time-consuming, and although I would like to see it happen, this is not my paper. I would be content therefore if the authors toned down the claim that plasmidic vs chromosomal Hok homologues have the same toxicity, and discuss that chromosomal levels of toxicity are an important caveat that has not been explored here.
__Authors' answer to R1_C2: __ We thank the reviewer for the detailed suggestion on how to better assess toxicity differences by using an araBAD deletion mutant overexpressing araE. We repeated the arabinose induction assays using drop assays and strain BW25223 with plasmid pJAT13araE and our pAZ3 based plasmid carrying Hok CDS homologs. However, we obtained similar data, not being able to distinguish between the toxicity of chromosomal versus plasmidic CDS, even using different concentration of Arabinose. This is probably because low concentration of the Hok protein are sufficient for activity, but here we are bypassing all post-transcriptional silencing by the native Hok mRNAs by expressing directly the protein, and we are using a multicopy plasmid. We now included 0.01% arabinose induction drop assays in the manuscript as the data obtained with other arabinose concentration did not provide new information. In any case, we are still not accessing the native expression levels for the following reasons 1/ chromosomal level of toxicity were not explored here and 2/ only the toxicity of the coding sequence but not the full mRNA was tested. Indeed, we do not know the exact sequence of the hok homolog mRNAs and this is beyond the scope of the study. These remarks were clearly added in the discussion.
We agree that the sentence "Hok peptides originating from chromosomes are as toxic as those from plasmids" was too strong and we have added the caveats of our experimental design in the discussion. While we indeed did not compare the toxicity of the peptides, we still showed that chromosomal Hok can be toxic upon overexpression, which would not be the case if the sequences were degenerated.
The reviewer also suggests the use of the FASTBAC-Seq method, that we previously used to study Hok from the R1 plasmid, which is a method to study toxic type I toxins at the native expression level. While FASTBAC-Seq identifies loss-of-function mutants of the systems, it does not allow to determine a difference of toxicity between systems per se. In addition, FASTBAC-Seq was always done in the context of the full mRNA, not only the coding sequence, and these sequences are presently unknown for most homologs.
Other comments:
__R1_C3: __a) There is barely any discussion of the Sok component (RNA antitoxin) of the homologues; why is that? Could you please discuss Sok differences across the homologues, or at least explain why this is not discussed at all in the paper (e.g., in the discussion)?
Authors' answer to R1_C3: __It is not trivial to identify the Sok RNA sequence, this is why it was not done in this study, a paragraph was added in the discussion explaining this. __
__R1_C4: __b) In the results section, the Hok clusters are referred to as 62 in number ("Because Hok sequences were too short and variable to construct a meaningful phylogenetic tree, we clustered the Hok sequences with a 60% identity threshold and obtained 62 clusters"), but then in the discussion section, the cluster number becomes 74 ("We highlighted the high sequence variability within Hok peptides by obtaining a total of 74 clusters with 60% identity (Fig. S7)."). Which one is the right number, and why is there a discrepancy?
Authors' answer to R1_C4: We apologize for the discrepancy between the number. The first number corresponded to the Hok hits from the refSeq and we then added the Hok hits from the plasmid and virus databases (performed later in the manuscript). We clarified this information both in the result and discussion texts (61 clusters from RefSeq and 79 in total, 74 was a typo).__ __
__R1 Significance: __The most well-clarified aspect of the paper presented here is the distribution of Hok homologues, with the novel aspect of the location in which the hok/Sok T1TAs reside (i.e., chromosome, plasmid, or phage). There is room for the molecular genetics part to be developed further, as I discussed earlier, however this study is the most up-to-date characterization of the diversity of Hok homologues, and will be of interest to the T1TA and the general toxin-antitoxin field.
__Reviewer #2 (R2) __
R2 General statement: The authors examined how the Hok toxins are spread across bacterial genomes. The manuscript including its figures is hard to read and understand. I commented figure 1 in details, but similar comments apply to the other figures. Overall, the data lack clarity and precision. Finding information about sequences, clusters in the supplementary materials was not easy. The manuscript should be thoroughly revised. In addition, I believe that other aspects should be developed to expand the interest of the study, such as the co-occurrence of multiple systems in chromosomes, on plasmids and whether they are able to crosstalk. This might provide some evolutionary insights into the biology of these toxins.
__Authors' answer to R2 General statement: __We designed all figures according to established standards for scientific data visualization, although we recognize that different presentations may work better for different audiences. In our detailed response to Figure 1A, we explain how UpSet plots are constructed and interpreted, which we hope clarifies the visualization approach for the full dataset. We are open to discussing specific improvements if the reviewer has suggestions for enhanced clarity. To address concerns about accessibility, we want to clarify that all sequences are compiled in Table S1 with their clus100 identifiers, making them easy to locate. We are open to reorganizing supplementary materials if a different structure would be more user-friendly. Finally, we agree that an extensive analysis of co-occurrences and crosstalks would be valuable. However, predicting crosstalk bioinformatically for all genomes presents challenges, as it would require predicting RNA:RNA interactions between hok mRNA and Sok sequences, which are currently unknown. Given these limitations, this analysis was beyond the scope of the current study.
R2_C1: The introduction lacks information regarding the Hok protein (size, structure prediction, localization) as well as a bit of explanation about the reason of looking at these toxins. The description of the potential roles should be a bit expanded.
Authors' answer to R2_C1: Following the comment from the reviewer, we have provided additional information about Hok in the introduction.
__R2_C2: __When the authors talk about 'loci', they mean genes encoding Hok homologs if I understand correctly. They did not look for the Sok sequences (hok-sok loci).
__Author's answer to R2_C2: __Indeed, we did not look for the Sok sequences and we are only describing Hok homologs loci, that could either encode or lack a Sok homolog.
__R2_C3: __It is not clear what the authors did with the sequences for which they could not detect a start codon and a SD (although it is unusual to refer to SD in the context of protein sequence)
Authors' answer to R2_C3: The peptides were annotated by extending the initial hit until the first start codon. Therefore, all annotated peptides have a start codon. Shine-Dalgarno sequences were annotated when confidently predicted, to provide additional information. Sequences were not excluded based on the presence or absence of the SD.
__R2_C4: __Figure 1A is not clear. The total of the bars equal 32,532 which is the number of 'loci' detected by the combination of the different methods. However, it is not clear to me how many are redundant. For instance, I suppose that all the 8483 sequences that were retrieved using blastn and Infernal were retrieved using MMseqs2, blastn and Infernal. So, what is the actual number of sequences that were found? When the authors talk about 1264 distinct peptides, what do they mean? What are the numbers on the X axis (18209, 2260, 27728)?
Author's answer to R2_C4: Figure A1 is a very typical "UpSet" plot, as indicated in the legend (A. Lex, N. Gehlenborg, H. Strobelt, R. Vuillemot and H. Pfister, "UpSet: Visualization of Intersecting Sets," in IEEE Transactions on Visualization and Computer Graphics, vol. 20, no. 12, pp. 1983-1992, 31 Dec. 2014, doi: 10.1109/TVCG.2014.2346248). Those plots are a data visualization method for showing data with more than two intersecting sets. The Hok sequence hits were obtained by 3 different methods stated on the rows (MMseqs2, blastn and Infernal, therefore the number 18209 is the number of hits by the MMseqs2, 22680 the number of hits by blastn and 27728 the number of hits by Infernal). The columns show the intersections between these three sets. For example, the mentioned 8483 sequences (second column) were only found by blastn and Infernal but not by MMseqs2. The actual total number of sequences found is indeed 32 532. The 1264 distinct peptides are peptides with different sequences. After removing false positives, degenerated sequences and small peptides, we obtained 1264 unique Hok sequences that are found in the 32532 bacterial loci.
__R2_C5: __About Infernal: first the authors are stating that only 8% of the sequences are lost when not considering the mRNA structure - which they seem to consider as negligeable. Then in the next section, they state that Infernal is the best tool at identifying clusters that are not detected otherwise. Seems a bit contradictory.
__Authors' answer to R2_C5: __We appreciate the reviewer pointing out this apparent contradiction, we have clarified this part in the revised manuscript. Infernal uses both sequence and structure information simultaneously for homology detection. While only 8% of Infernal's hits are detected uniquely when structural information was considered, these sequences account for 9 additional clusters with notably high sequence diversity, which would otherwise have been undetected. Therefore, we believe that Infernal is the best tool to capture novel cluster diversity.
__R2_C6: __Cluster determination. The threshold was put at 60% identity. What is the rationale for the 60% identity? Given that the Hok sequences (like toxins and antitoxins from TA systems in general) are highly variable, this leads to a high number of clusters. I'm not sure of the relevance of these clusters. Are there any other criteria to define clusters?
Authors' answer to R2_C6: We selected 60% identity as a balance between capturing sequence diversity and generating interpretable results. We also tested 70, 80 and 90% and obtained 128, 221, 377 clusters, respectively, which would be too many for a meaningful visualization and interpretation. The best clustering method would be constructing a phylogenetic tree. However, as explained in the discussion, because the high sequence diversity prevented the construction of a reliable phylogenetic tree, clustering was used as an alternative strategy to identify and interpret patterns of sequence variability.
__R2_C7: __The authors claim that most of the Hok diversity is found on chromosomes. However, the number of chromosomal Hok is higher than that located on plasmids, which might be related to the different sizes of the different replicons ie, chromosomes being larger than plasmids. Is there a way to normalize by determining the density per size?
Authors' answer to R2_C7: We do not claim that chromosomes contain most of Hok diversity, as this would be indeed influenced by biases in the databases. We are just describing that we found most of the diversity in chromosomes, but we cannot conclude whether this is a true representation of the frequencies in nature.__ __
R2_C8: '46 of the 62 clusters contained 10 or less distinct sequences and might be in the process of degenerating'. The authors also linked this with SD detection. Please explain. From what was indicated earlier, I understand that sequences with premature stop codons or short sequences (Authors' answer to R2_C8: We did not remove sequences for which we could not predict the SD. Indeed, lacking SD is a sign that the hok mRNA might not be able to play its biological role and would be indicative that the sequences have degenerated. To evaluate this hypothesis, we experimentally tested 5 sequences without a predicted SD and two of those were not toxic (see Table S2). In order to assess if the low abundant clusters contained degenerated sequences we experimentally tested representatives from some of the clusters with only one Hok CDS and found most of them to be toxic.
R2_C9: 'Only 7.3% of the unique sequences were found on both plasmids and chromosomes'. From this observation, the authors conclude that 'there is little stable transfer from chromosomes to plasmids or vice-versa'. I don't understand what this means. Do they mean identical sequences? The fact that sequences differ from chromosomes to plasmids does not rule out 'stable transfer'. What do they actually mean by stable transfer? Once the gene is horizontally transferred, it is fixed and vertically transmitted? Same comments apply to the inter-genera horizontal transfer by plasmids.
__Authors' answer to R2_C9: __Due to the impossibility of constructing a reliable phylogenetic tree, we used identity of sequences across different localizations or genera as our marker for recent, stable transfer events. We define stable transfer as the persistence of sequences in an unchanged form following horizontal transfer; long enough to be detected in current databases. Our approach likely underestimates total transfer events, as sequences accumulating mutations after transfer would not be captured. We would expect to observe numerous identical sequences across plasmids and chromosomes if frequent exchange were occurring, unless rapid mutation after the transfer prevented their detection as identical sequences. We have added a sentence to clarify this in the manuscript and removed the term stable transfer.
__R2_C10: __I don't understand the next section about 'family'. What do the authors mean about 'family'? Genera? The same apply to the next section about the Y to C recoding. Did the authors do point mutations in the conserved amino acids/codons to test whether they are important for toxicity? Some Hok variants lacks some of the conserved amino acids and are toxic (under overexpression conditions in Salmonella). What about T18, C31 and E42?
Authors' answer to R2_C10: Families (Enterobacteriaceae, Vibrionaceae etc... ) and genera (Escherichia, Salmonella etc...) refer to the taxonomic categories. Following the reviewer comment, we experimentally assessed the toxicity of Hok from R1 plasmid after mutating the conserved amino acids to alanine residues. All the mutants were found to be toxic under our expression conditions.
__R2_C11: __The prevalence of Hok in chromosomes or on plasmids might depend on various confounding parameters, such as the size, number of sequences available among others. The authors should find methods to correct for all that.
Authors' answer to R2_C11: Normalization would indeed be needed if we were comparing the prevalence on chromosomes vs the prevalence on plasmids. Here, we do not claim that Hok homologs are more prevalent in plasmid or chromosomes and only describe where we found them.
__R2_C12: __Link with defense systems. The threshold was set at 20 kb. Why this threshold?
Authors' answer to R2_C12: The size of defense islands in a previous report was approximately 40 kb, by setting up a 20 kb threshold we searched for defense systems in a region of 40 kb adjacent to each of the homologs (https://doi.org/10.1126/science.aar4120). If the specific homolog was part of a defense island we would expect that it is less than 20 kb apart from any defense system.
__R2 Significance: __The paper in its current state appears to serve the role of a data repository rather than a thorough and original analysis. It requires extensive revisions before it can be of interest to experts in the toxin-antitoxin field.
__ ____Reviewer #3 (R3): __
R3 General statement: In the manuscript, "The Hok bacterial toxin: diversity, toxicity, distribution and genomic localization," by Escalera-Maurer et al., investigate the distribution of Hok type I toxin proteins across bacterial species. The Hok-Sok type I toxin-antitoxin system was first described on plasmids where it serves to maintain the plasmid in a population of bacterial cells: translation of the hok mRNA is prevented via the small antitoxin RNA Sok. Upon plasmid loss, with no new transcription of sok, the highly stable hok mRNA is translated into a small protein, killing the plasmid-less cell. Homologues to the system were identified in the chromosome of E. coli in the 1990s, and subsequent analyses have identified identical systems in other bacterial chromosomes, though they are close relatives to E. coli. Given the increased number of bacterial genomes sequenced, the group examined how widespread Hok may be across bacteria. They used a combination of BLASTn, MMseqs2 (protein) and Infernal (RNA) to identify, as best possible, all possible homologs. They then used sequence identity cut-offs to form Hok "clusters," and identified key features of the cluster as well as tested toxicity of overproduction of 31 homologs in a strain of Salmonella. Overall, though a variety of bioinformatic predictions and analyses, the manuscript identifies an expanded number of Hok members not previously identified and broaden the species it is found in, supported that Hok is not associate with defense systems, and provides additional support that horizontal transfer of hok genes is likely via plasmids (where hok is presumed to have originated).
Major comments: There are some areas of the text that are a bit too definitive (these can be fixed or better explained in the text) and a few questions raised about the analyses and interpretations.
Authors' answer to R3 Major Comment: As suggested by the reviewer, we rephrased parts of the manuscript.
__These are the specific comments: __
Introduction R3_C1: First paragraph: "Toxin production leads to the death of the cell encoding it" For many chromosomally encoded systems, toxicity has only been observed via artificial overexpression. This is an important point, as for many systems, a true biological function remains unknown. Further, add caveats regarding toxin function (for systems with validated function, they are involved in...). Again, there are still many questions for many t-at systems, in particular the Type I systems.
__Authors' answer to R3_C1: __Indeed, the function of type 1 TA, in particular chromosomal ones, is still a matter of debate. While for hok/Sok R1, we previously showed death by expression at the chromosomal level, this was not shown for all TA (Le Rhun et al., NAR, 2023). We added that it could lead to the death or growth arrest of the cell instead and added the reviewer changes to for the function part.
__R3_C2: __Introduction: type I's are more narrow in distribution, but much of this is due to their size and lack of biochemical domains. Again, please clarify more here.
__Authors' answer to R3_C2: __We added the reviewer suggestion to the text.
__R3_C3: __Introduction: while Hok's have been found on chromosomes, in E. coli strains, there is clear evidence that many are inactive. This comes up in the discussion, but it is worth including briefly in the introduction.
Authors' answer to R3_C3: We have now added in the introduction that in the K12 laboratory strain, most chromosomal hok/Sok were found to be inactive.
__R3_C4: __For the predicted transmembrane domain: it would be worth to include a box/indication as to where that is within the peptide (with the understanding it may not be exact). Is there more/less variation here? I'm assuming all clusters/family have a predicted TM domain?
__Authors' answer to R3_C4: __When predicting the TM domain using DeepTMHMM - 1.0 prediction (https://services.healthtech.dtu.dk/services/DeepTMHMM-1.0/), 227 out of the 1264 unique Hok sequence are predicted to have a TM (transmembrane), 7 a SP (signal peptide) and a TM and 1025 have a SP. When predicting the TM of the consensus sequence (most abundant amino-acid) shown in Fig. 1D, region A8 to L25 is predicted to be inserted in the membrane, with the Nterm inside and Cterm outside.
__R3_C5: __What is the cutoff for being a Hok? Did they take the "last hit" and use that in additional searches to see if more appeared? If that was done, and the search was exhaustive, this really important to add for the reader.
Authors' answer to R3_C5: The MMseqs2 search was performed using 5 iterations as indicated in the M&M, meaning that the hits of the one search were used to search the database again five time in a raw. Importantly, an attempt to increase the number of iterations to 10 did not significantly increase the number of hits. Therefore, at least for the MMseqs2 search in the RefSeq database, we are close to being exhaustive.
__R3_C6: __Figure S4: the authors state that there was no difference in the degree of toxicity between the clusters. There do appear to be some peptides tested that at the arabinose concentration used did not repress growth as immediately as others. If higher arabinose concentration is used, does that eliminate these differences? OR are many of these suppressors-if diluted back again, do they grow as if they are non-toxic in arabinose?
Authors' answer to R3_C6: As suggested by Reviewer 1 (R1_C2), we performed titration of arabinose in a system overexpressing araE in a ΔaraBAD but were not able to find difference of toxicity in our conditions, see also our answer to R1_C2.
__R3_C7: __Discussion: "because non-functional homologs are expected to quickly accumulate mutations..." is a bit problematic. Hok is highly regulated-as are some of the other well-described type I toxins. In MG1655, while the coding sequence may be intact, there are other mutations and/or insertion elements that prevent expression (and be extension, function. Given the lack of consensus data for type Is, it is best to provide more context for this. If the authors wish to argue that they should quickly accumulate mutations, it would be good to provide additional rates/evidence (even for other loci) from the Enterobacteriaceae.
__Authors' answer to R3_C7: __We agree this statement might need to be supported further. We have removed this sentence to address this concern.
__Minor comments: __
__R3_C8: __For the sequences used in the search: please provide the sequence used in addition to the reference to the T1TAdb. Was the full-length hok mRNA, including mok, used? Please provide the nucleic acid sequence (and include description of whether full-length, etc.) in Materials and Methods or in Supplemental.
__Authors' answer to R3_C8: __Sequences and code were deposited on https://gitub.u-bordeaux.fr/alerhun/Escalera-Maurer_2025. This files named curated_Hok.fasta and hok.fa, corresponding to Hok protein and mRNA sequences respectively are available in the file "T1TAdb input".
__R3_C9: __60% identity was used for clustering. Did this become a problem-meaning separation of same property amino acid?
__Authors' answer to R3_C9: __We checked amino acid signatures for each cluster (Fig S2), but could not find anything relevant.
__R3_C10: __Fig. S2: for the clusters shown, please add in HokB, HokE, etc., to better correspond to Figure 1 in the main text.
__Authors' answer to R3_C10: __The clusters were annotated according to the suggestion.
__R3_C11: __Fig S1: this figure is challenging to orient-what are the numbers (8_10_85)?
Authors' answer to R3_C11: The figure was generated using the CLANS tool, with each unique sequence retrieved by our analysis shown as a dot. Hok homologous sequences are in red and cluster together, the outlier clusters are annotated with the numbers corresponding to their 60% identity cluster. We understand that separating the number using an underscore could lead to confusion, therefore we have now separated the numbers using a coma.
__R3_C12: __Please make a separate table or sheet for the experimentally tested peptides. Table S1 is quite large and a separate table/sheet would make this easier to find. If possible, please give the files names a more descriptive title (Table S1 in the name for example). This may be an issue with Review Commons but the individual file names were non-descript and the descriptions on the webpage did not indicate what the file contained.
__Authors' answer to R3_C12: __We named the files Table S1 and File_S1 to S7. We added a table S2 with the experimentally tested peptides. Note that identical peptides can be sometime found in several bacterial loci.
__R3_C13: __Figure S9: the black arrow for Hok is hard to see-it appears that the long grey bar going through multiple loci is indicative of Hok. Perhaps label this differently to make it easier on the reader (the line initially seemed to be a formatting issue and not indicative of the position of Hok.
__Authors' answer to R3_C13: __We have now added a new label to indicate where is Hok, and clarified it in the figure legend.
__R3_C14: __While the authors focused on Hok for this approach, which is fine and appropriate, can they comment at all about where mok is there in these new clusters/sub-families? Sok potential?
__Authors' answer to R3_C14: __We added a paragraph about Mok in the discussion.
__R3 Significance: __Overall the paper is a sound bioinformatic exercise and is improved with the testing of numerous "new" Hok proteins. Most of the comments can be done with some clarifications and maybe some additional analyses and/or verification which should take minimal time. The authors are over-emphatic at points as indicated and need to be more careful and precise with their language.
In terms of advancement, it advances the distribution of these systems and adds to the depth of sub-classes. The audience will be more specialized to those who study these systems.
Expertise: I have been studying type I toxin-antitoxin systems since the mid-2000s. We published a study examining (and mentioned well by this article!) the distribution in chromosomes of type I toxin-antitoxin systems, identified brand-new systems (that were chromosomally-limited at the time). My lab has continued to study regulation of type I toxins and distribution of chromosomally-only-encoded systems (so not Hok).
Note: This preprint has been reviewed by subject experts for Review Commons. Content has not been altered except for formatting.
Learn more at Review Commons
The authors examined how the Hok toxins are spread across bacterial genomes. The manuscript including its figures is hard to read and understand. I commented figure 1 in details, but similar comments apply to the other figures. Overall, the data lack clarity and precision. Finding information about sequences, clusters in the supplementary materials was not easy. The manuscript should be thoroughly revised. In addition, I believe that other aspects should be developed to expand the interest of the study, such as the co-occurrence of multiple systems in chromosomes, on plasmids and whether they are able to crosstalk. This might provide some evolutionary insights into the biology of these toxins.
Introduction:
The introduction lacks information regarding the Hok protein (size, structure prediction, localization) as well as a bit of explanation about the reason of looking at these toxins. The description of the potential roles should be a bit expanded.
Results:
When the authors talk about 'loci', they mean genes encoding Hok homologs if I understand correctly. They did not look for the Sok sequences (hok-sok loci).
It is not clear what the authors did with the sequences for which they could not detect a start codon and a SD (although it is unusual to refer to SD in the context of protein sequence)
Figure 1A is not clear. The total of the bars equal 32,532 which is the number of 'loci' detected by the combination of the different methods. However, it is not clear to me how many are redundant. For instance, I suppose that all the 8483 sequences that were retrieved using blastn and Infernal were retrieved using MMseqs2, blastn and Infernal. So, what is the actual number of sequences that were found? When the authors talk about 1264 distinct peptides, what do they mean? What are the numbers on the X axis (18209, 2260, 27728)?
About Infernal: first the authors are stating that only 8% of the sequences are lost when not considering the mRNA structure - which they seem to consider as negligeable. Then in the next section, they state that Infernal is the best tool at identifying clusters that are not detected otherwise. Seems a bit contradictory.
Cluster determination. The threshold was put at 60% identity. What is the rationale for the 60% identity? Given that the Hok sequences (like toxins and antitoxins from TA systems in general) are highly variable, this leads to a high number of clusters. I'm not sure of the relevance of these clusters. Are there any other criteria to define clusters?
The authors claim that most of the Hok diversity is found on chromosomes. However, the number of chromosomal Hok is higher than that located on plasmids, which might be related to the different sizes of the different replicons ie, chromosomes being larger than plasmids. Is there a way to normalize by determining the density per size?
'46 of the 62 clusters contained 10 or less distinct sequences and might be in the process of degenerating'. The authors also linked this with SD detection. Please explain. From what was indicated earlier, I understand that sequences with premature stop codons or short sequences (<40aa) were removed from the analysis earlier. Lacking an SD is a sign of decay? Were these sequences lacking SD not discarded before starting the analysis? Did the authors experimentally validate some of these sequences?
'Only 7.3% of the unique sequences were found on both plasmids and chromosomes'. From this observation, the authors conclude that 'there is little stable transfer from chromosomes to plasmids or vice-versa'. I don't understand what this means. Do they mean identical sequences? The fact that sequences differ from chromosomes to plasmids does not rule out 'stable transfer'. What do they actually mean by stable transfer? Once the gene is horizontally transferred, it is fixed and vertically transmitted? Same comments apply to the inter-genera horizontal transfer by plasmids.
I don't understand the next section about 'family'. What do the authors mean about 'family'? Genera? The same apply to the next section about the Y to C recoding. Did the authors do point mutations in the conserved amino acids/codons to test whether they are important for toxicity? Some Hok variants lacks some of the conserved amino acids and are toxic (under overexpression conditions in Salmonella). What about T18, C31 and E42?
The prevalence of Hok in chromosomes or on plasmids might depend on various confounding parameters, such as the size, number of sequences available among others. The authors should find methods to correct for all that.
Link with defense systems. The threshold was set at 20 kb. Why this threshold?
The paper in its current state appears to serve the role of a data repository rather than a thorough and original analysis. It requires extensive revisions before it can be of interest to experts in the toxin-antitoxin field.
Author response:
The following is the authors’ response to the original reviews.
Reviewer #1 (Public review):
(1) The authors devote significant effort to characterizing the physical interaction between Bicc1 and Pkd2. However, the study does not examine or discuss how this interaction relates to Bicc1's well-established role in posttranscriptional regulation of Pkd2 mRNA stability and translation efficiency.
The reviewer is correct that the present study has not addressed the downstream consequences of uthis interaction considering that Bicc1 is a posttranscriptional regulator of Pkd2 (and potentially Pkd1). We think that the complex of Bicc1/Pkd1/Pkd2 retains Bicc1 in the cytoplasm and thus restrict its activity in participating in posttranscriptional regulation (see Author response image 1). We, however, do not yet have data to support this and thus have not included this model in the manuscript. Yet, we have updated the discussion of the manuscript to further elaborate on the potential mechanism of the Bicc1/Pkd1/Pkd2 complex.
We have updated the discussion to include a discussion on the potential consequences on posttranscriptional regulation by Bicc1.
Author response image 1.
Model of BICC1, PC1 and PC2 self-regulation. In this model Bicc1 acts as a positive regulator of PKD gene expression. In the presence of ‘sufficient’ amounts of PC1/PC2 complex, it is tethered to the complex and remains biologically inactive (Fig. 1A). However, once the levels of the PC1/PC2 complex are reduced, Bicc1 is now present in the cytoplasm to promote expression of the PKD proteins, thereby raising their levels (Fig. 4B), which then in turn will ‘shutdown’ Bicc1 activity by again tethering it to the plasma membrane.
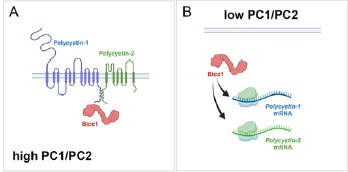
(2) Bicc1 inactivation appears to downregulate Pkd1 expression, yet it remains unclear whether Bicc1 regulates Pkd1 through direct interaction or by antagonizing miR-17, as observed in Pkd2 regulation. This should be further examined or discussed.
This is a very interesting comment. Vishal Patel published that PKD1 is regulated by a mir-17 binding site in its 3’UTR (PMID: 35965273). We, however, have not evaluated whether BICC1 participates in this regulation. A definitive answer would require utilization of the mice described in above reference, which is beyond the scope of this manuscript. We, however, have revised the discussion to elaborate on this potential mechanism.
We have updated the discussion to include a statement on the potential direct regulation of Pkd1 mRNA by Bicc1.
(3) The evidence supporting Bicc1 and ADPKD gene cooperativity, particularly with Pkd1, in mouse models is not entirely convincing, likely due to substantial variability and the aggressive nature of Bpk/Bpk mice. Increasing the number of animals or using a milder Bicc1 strain, such as jcpk heterozygotes, could help substantiate the genetic interaction.
We have initially performed the analysis using our Bicc1 complete knockout, we previously reported on (PMID 20215348) focusing on compound heterozygotes. Yet, similar to the Pkd1/Pkd2 compound heterozygotes (PMID 12140187) no cyst development was observed when we sacrificed the mice as late as P21. Our strain is similar to the above mentioned jcpk, which is characterized by a short, abnormal transcript thought to result in a null allele (PMID: 12682776). We thank the reviewer for pointing us to the reference showing the heterozygous mice exhibit glomerular cysts in the adults (PMID: 7723240). This suggestion is an interesting idea we will investigate. In general, we agree with the reviewer that a better understanding of the contribution of Bicc1 to the adult PKD phenotype will be critical. To this end, we are currently generating a floxed allele of Bicc1 that will allow us to address the cooperativity in the adult kidney, when e.g. crossed to the Pkd1<sup>RC/RC</sup> mice. Yet, these experiments are beyond the timeframe for this revision.
No changes were made in the revised manuscript.
Reviewer #2 (Public review):
(1) These results are potentially interesting, despite the limitation, also recognized by the authors, that BICC1 mutations seem exceedingly rare in PKD patients and may not "significantly contribute to the mutational load in ADPKD or ARPKD". The manuscript has several intrinsic limitations that must be addressed.
As mentioned above, the study was designed to explore whether there is an interaction between BICC1 and the PKD1/PKD2 and whether this interaction is functionally important. How this translates into the clinical relevance will require additional studies (and we have addressed this in the discussion of the manuscript).
(2) The manuscript contains factual errors, imprecisions, and language ambiguities. This has the effect of making this reviewer wonder how thorough the research reported and analyses have been.
We respectfully disagree with the reviewer on the latter interpretation. The study was performed with rigor. We have carefully assessed the critiques raised by the reviewer. As presented below, most of the criticisms raised by the reviewer have been easily addressed in the revised version of the manuscript. Yet, none of the critiques seems to directly impact the overall interpretation of the data.
Reviewer #1 (Recommendations for the authors):
(1) The manuscript requires further editing. For example, figure panels and legends are mismatched in Figure 1
We have corrected the labeling of Figure 1.
(2) Y-axis units and values are inconsistent in Figures 4b-4g, Supplementary Figures S2e and S2f are not referenced in the text, genotypes are missing in Supplementary Figure S3f, and numerous typographical errors are present.
In respect to the y-axis in Figure 4b-g, the scale is different for each of them, but that is intentional as one would lose the differences if they were all scaled identically. But we have now mentioned this in the figure legend to make the reader aware of it. In respect to the Supplemental Figure S2e,f, we included the panels in the description of the mutant BICC1 lines, but unfortunately forgot to reference them. This has now been done.
We have updated the labeling of the Y-axis for the cystic indices adding “[%]” as the unit and updated the figure legend of Figure 4. We have included the genotypes in Supplementary Figure S3f. The Supplementary Figure S2e,f is now mentioned in the supplemental material (page 9, 2<sup>nd</sup> paragraph).
Reviewer #2 (Recommendations for the authors):
(1) Previous data from mouse, Xenopus, and zebrafish suggest a crucial role for the RNAbinding protein Bicc1 in the pathogenesis of PKD, although BICC1 mutations in human PKD have not been previously reported." The cited sources (and others that were not cited) link Bicc1 mutations to renal cysts, similar to a report by Kraus (PMID: 21922595) that the authors cite later. However, a more direct link to PKD was reported by Lian and colleagues using whole Pkd1 mice (PMID: 20219263) and by Gamberi and colleagues using Pkd1 kidneys and human microarrays (PMID: 28406902). Although relevant, neither is cited here, and only the former is cited later in the manuscript.
Thanks for pointing this out. We have added these three citations.
We have added these three citations (PMID: 21922595, PMID: 20219263 and PMID: 28406902) in the indicated sentence.
(2) In Figure 1B, the lanes do not seem to correspond among panels, particularly evident in the panel with myc-mBicc1. Hence, it is difficult to agree with the presented conclusions.
We have corrected the labeling of the lanes in Figure 1b.
(3) In the Figure 1 legend: "(g) Western blot analysis following co-IP experiments, using an anti-mouse Bicc1 or anti-goat PC2 antibody as bait, identified protein interactions between endogenous PC2 and BICC1 in UCL93 cells. Non-immune goat and mouse IgG were included as a negative control." There is no mention of panel H, although this reviewer can imagine what the authors meant. The capitalization differs in the figure and legend. More troublingly, in panel G, a non-defined star indicates a strong band present in both immune and non-immune control.
We have corrected the figure legend of Figure 1 and clarified the non-specific band in the figure legend.
(4) In Figure 4, the authors do not show the matched control for the Bicc1 Pkd1 interaction in panel d, nor do they show a scale bar in either a) or d). Thus, the phenotypic severity cannot be properly assessed.
Thanks for pointing out the missing scale bars, which have now been added. In respect to the two kidneys shown in Figure 4d, the two kidneys shown are from littermates to illustrate the kidney size in agreement with the cumulative data shown in Figure 4e. Unfortunately, this litter did not have a wildtype control. As the data analysis in Figure 4e is based on littermates, mixing and matching kidneys of different litters does not seem appropriate. Thus, we have omitted showing a wildtype control in this panel. However, the size of the wildtype kidney can be seen in Figure 4a.
We have added the scale bar to both panels and have updated the figure legend to emphasize that the kidneys shown are from littermates and that no wildtype littermate was present in this litter.
(5) "Surprisingly, an 8-fold stronger interaction was observed between full-length PC1 and myc-mBicc1-ΔKH compared to mycmBicc1 or myc-mBicc1-ΔSAM." Assuming all the controls for protein folding and expression levels have been carried out and not shown/mentioned, this sentence seems to contradict the previous statement that Bicc1deltaSAM reduced the interaction with PC1 by 55%. Because the full length and SAM deletion have different interaction strengths, the latter sentence makes no sense.
The reduction in the levels of myc-mBicc1-ΔSAM compared to wildtype mycmBicc1 in respect to PC1 binding was not significant. We have clarified this in the text.
We have corrected the sentence and modified the Figure accordingly.
(6) Imprecise statements make a reader wonder how to interpret the data: "More than three independent experiments were analyzed." Stating the sample size or including it in the figure would save space and improve confidence in the data presented.
We have stated the exact number of animals per conditions above each of the bars.
(7) "Next, we performed a similar mouse study for Pkd1 by reducing the gene dose of Pkd1 postnatally in the collecting ducts using a Pkhd1-Cre as previously described40" What did the authors mean?
The reference was included to cite the mouse strain, but realized that it can be mis-interpreted that the exact experiments has been performed previously. We have clarified this in the text.
We have reworded the sentence to avoid misinterpretation.
(8) The authors examined the additive effects of knocking down Bicc1, Pkd1, and Pkd2 with morpholinos in Xenopus and, genetically, in mice. While the Bicc1[+/-] Pkd1 or 2[+/-] double heterozygote mice did not show phenotypes, the authors report that the Bicc1[-/-] Pkd1 or 2 [+/-] did instead show enlarged kidneys. What is the phenotype of a Bicc1[+/-] Pkd1 or 2 [-/-]? What we learn from the author's findings among the PKD population suggests that the latter situation would be potentially translationally relevant.
The mouse experiments were designed to address a cooperativity between Bicc1 and either Pkd1 or Pkd2 and whether removal of one copy of Pkd1 or Pkd2 would further worsen the Bicc1 cystic kidney phenotype. Thus, the parental crosses were chosen to maximize the number of animals obtained for these genotypes. Unfortunately, these crosses did not yield the genotypes requested by the reviewer. To address the contribution of Bicc1 towards the PKD population, we will need to perform a different cross, where we eliminate Pkd1 or Pkd2 in a floxed background of Bicc1 postnatally in adult mice. While we are gearing up to perform such an experiment, this is timewise beyond the scope of the manuscript. In addition, please note that we have addressed the question about the translation towards the PKD population already in the discussion of the original submission (page 13/14, last/first paragraph).
No changes have been made to the revised version of the manuscript.
(9) How do the authors interpret the milder effects of the Bicc1[-/-] Pkd1[+/-] compared to Bicc1[-/-] Pkd2[+/-] relative to the respective protein-protein interactions?
The milder effects are due to the nature of the crosses. While the Pkd2 mutant is a germline mutation, the Pkd1 mutant is a conditional allele eliminating Pkd1 only in the collecting ducts of the kidney. As such, we spare other nephron segments such as the proximal tubules, which also significantly contribute to the cyst load. As such these mouse data support the interaction between Pkd1 and Pkd2 with Bicc1, but do not allow us to directly compare the outcomes. While this was mentioned in the previous version of the manuscript, we have expanded on this in the revised version of the manuscript.
We have expanded the results section in the revised version of the manuscript highlighting that the two different approaches cannot be directly compared.
(10) How do the authors interpret that the strong Bicc1[Bpk] Pkd1 or Pkd2 double heterozygote mice did not have defects and "kidneys from Bicc1+/-:Pkd2+/- did not exhibit cysts (data not shown)", when the VEO PKD patients and - although not a genetic reduction - also the morpholino-treated Xenopus did?
VEO PKD patients are characterized by a loss of function of PKD1 or PKD2 and – as we propose in this manuscript - that BICC1 further aggravates the phenotype. Yet, we do not address either in the mouse or Xenopus experiments whether BICC1 is a genetic modifier. We are simply addressing whether the two genes show a genetic interaction. In the mouse studies, we eliminate one copy of Pkd1 or Pkd2 in the background of a hypomorphic allele of Bicc1. Similarly, in the Xenopus experiments, we employ suboptimal doses of the morpholino oligomers, i.e., concentrations that did not yield a phenotypic change and then asked whether removing both together show cooperativity. It is important to state that this is based on a biological readout and not defined based on the amount of protein. While we have described this already in the original manuscript (page 7, first paragraph), we have amended our description of the Xenopus experiment to make this even clearer.
Finally, we agree with the reviewer that if we were to address whether Bicc1 is a modifier of the PKD phenotype in mouse, we would need to reduce Bicc1 function in a Pkd1 or Pkd2 mutants. Yet, we have recognized this already in the initial version of the manuscript in the discussion (page 14, first paragraph).
We have expanded the results section when discussing the suboptimal amounts of the morpholino oligos (Page 6, 1<sup>st</sup> paragraph).
(11) Unclear: "While variants in BICC1 are very rare, we could identify two patients with BICC1 variants harboring an additional PKD2 or PKD1 variant in trans, respectively." Shortly after, the authors state in apparent contradiction that "the patients had no other variants in any of other PKD genes or genes which phenocopy PKD including PKD1, PKD2, PKHD1, HNF1s, GANAB, IFT140, DZIP1L, CYS1, DNAJB11, ALG5, ALG8, ALG9, LRP5, NEK8, OFD1, or PMM2."
The reviewer is correct. This should have been phrased differently. We have now added “Besides the variants reported below” to clarify this more adequately.
The sentence was changed to start with “Besides the variants reported below, […].”
(12) "The demonstrated interaction of BICC1, PC1, and PC2 now provides a molecular mechanism that can explain some of the phenotypic variability in these families." How do the authors reconcile this statement with their reported ultra-rare occurrence of the BICC1 mutations?
As mentioned in the manuscript and also in response to the other two reviewers, Bicc1 has been shown to regulate Pkd2 gene expression in mice and frogs via an interaction with the miR-17 family of microRNAs. Moreover, the miR-17 family has been demonstrated to be critical in PKD (PMID: 30760828, PMID: 35965273, PMID: 31515477, PMID: 30760828). In fact, both other reviewers have pointed out that we should stress this more since Bicc1 is part of this regulatory pathway. Future experiments are needed to address whether Bicc1 contributes to the variability in ADPKD onset/severity. Yet, this is beyond the scope of this study.
Based on the comments of the two other reviewers we have further addressed the Bicc1/miR-17 interaction.
(13) The manuscript should use correct genetic conventions of italicization and capitalization. This is an issue affecting the entire manuscript. Some exemplary instances are listed below.
(a) "We also demonstrate that Pkd1 and Pkd2 modifies the cystic phenotype in Bicc1 mice in a dose-dependent manner and that Bicc1 functionally interacts with Pkd1, Pkd2 and Pkhd1 in the pronephros of Xenopus embryos." Genes? Proteins?
The data presented in this section show that a hypomorphic allele of Bicc1 in mouse and a knockdown in Xenopus yields this. As both affect the proteins, the spelling should reflect the proteins.
No changes have been made in the revised manuscript.
(b) The sentence seems to use both the human and mouse genetic capitalization, although it refers to experiments in the mouse system “to define the Bicc1 interacting domains for PC2 (Fig. 2d,e). Full-length PC2 (PC2-HA) interacted with full-length myc-mBICC1.”
We agree with the review that stating the species of the molecules used is critical, we have adapted a spelling of Bicc1, where BICC1 is the human homologue, mBicc1 is the mouse homologue and xBicc1 the Xenopus one.
We have highlighted the species spelling in the methods section and labeled the species accordingly throughout the manuscript and figures.
(14) “Together these data supported our biochemical interaction data and demonstrated that BICC1 cooperated with PKD1 and PKD2.” Are the authors implying that these results in mice will translate to the human protein?
We agree that we have not formally shown that the same applies to the human proteins. Thus, we have changed the spelling accordingly.
We have revised the capitalization of the proteins.
(15) The text is often unclear, terse, or inconsistent.
(a) “These results suggested that the interaction between PC1 and Bicc1 involves the SAM but not the KH/KHL domains (or the first 132 amino acids of Bicc1). It also suggests that the N-terminus could have an inhibitory effect on PC1-BICC1 association.” How do the authors define the N-terminus? The first 132 aa? KH/KHL domains?
This was illustrated in the original Figure 2A. The DKH constructs lack the first 351 amino acids.
To make this more evident, we have specified this in the text as well.
(b) Similarly, the authors state below, "Unlike PC1, PC2 interacted with mycmBICC1ΔSAM, but not myc-mBICC1-ΔKH suggesting that PC2 binding is dependent on the N-terminal domains but not the SAM domain." It is unclear if the authors refer to the KH/KHL domains or others. Whatever the reference to the N-terminal region, it should also be consistent with the section above.
This is now specified in the text.
(c) Unclear: "We have previously demonstrated that Pkd2 levels are reduced in a complete Bicc1 null mice,22 performing qRT-PCR of P4 kidneys (i.e. before the onset of a strong cystic phenotype), revealed that Bicc1, Pkd1 and Pkd2 were statistically significantly down9 regulated (Fig. 4h-j)".
We have changed the text to clarify this.
(d) “Utilizing recombinant GST domains of PC1 and PC2, we demonstrated that BICC1 binds to both proteins in GST-pulldown assays (Fig. 1a, b)." GST-tagged domains? Fusions?
We have changed the text to clarify this.
(e) "To study the interaction between BICC1, PKD1 and PKD2 we combined biochemical approaches, knockout studies in mice and Xenopus, genetic engineered human kidney cells" > genetically engineered.
We have changed the text to clarify this.
(f) Capitalization (e.g., see Figure S3, ref. the Bpk allele) and annotation (e.g., Gly821Glu and G821E) are inconsistent.
We have homogenized the labeling of the capitalization and annotations throughout the manuscript.
(g) What do the authors mean by "homozygous evolutionarily well-conserved missense variant"?
We have changed this is the revised version of the manuscript.
Reviewer #3 (Public review/Recommendations to the authors):
(1) A further study in HUREC cells investigating the critical regulatory role of BICC1 and potential interaction with mir-17 may yet lead to a modifiable therapeutic target.
(2) This study should ideally include experiments in HUREC material obtained from patients/families with BICC1 mutations and studying its effects on the PKD1/2 complex in primary cell lines.
This is an excellent suggestion. We agree with the reviewer that it would have been interesting to analyze HUREC material from the affected patients. Unfortunately, besides DNA and the phenotypic analysis described in the manuscript neither human tissue nor primary patient-derived cells collected once the two patients with the BICC1 p.Ser240Pro variant passed away.
No changes to the revised manuscript have been made to address this point.
(3) Please remove repeated words in the following sentence in paragraph 2 of the introduction: "BICC1 encodes an evolutionarily conserved protein that is characterized by 3 K-homology (KH) and 2 KH-like (KHL) RNA-binding domains at the N-terminus and a SAM domain at the C-terminus, which are separated by a by a disordered intervening sequence (IVS).23-28".
This has been changed.
repositorio reproducible
poner aquí (documentos dinámicos y reproducibles (R Markdown/Quarto), así se puede sacar el punto 6
Author response:
Reviewer #1 (Public review):
The authors analysed large-scale brain-state dynamics while humans watched a short video. They sought to identify the role of thalamocortical interactions.
Major concerns
(1) Rationale for using the naturalistic stimulus
In terms of brain state dynamics, previous studies have already reported large-scale neural dynamics by applying some data-driven analyses, like energy landscape analysis and Hidden Markov Model, to human fMRI/EEG data recorded during resting/task states. Considering such prior work, it'd be critical to provide sufficient biological rationales to perform a conceptually similar study in a naturalistic condition, i.e., not just "because no previous work has been done". The authors would have to clarify what type of neural mechanisms could be missed in conventional resting-state studies using, say, energy landscape analysis, but could be revealed in the naturalistic condition.
We appreciate your insightful comments regarding the need for a biological rationale in our study. As you mentioned, there are similar studies, just like Meer et al. utilized Hidden Markov Models to identify various activation modes of brain networks that included subcortical regions[1], Song et al. linked brain states to narrative understandings and attentional dynamics[2, 3]. These studies could answer why we use naturalistic stimuli datasets. Moreover, there is evidence suggesting that the thalamus plays a crucial role in processing information in a more naturalistic context while pointing out the vital role in thalamocortical communications[4, 5]. So, we tended to bridge thalamic activity and cortical state transition using the energy landscape description.
To address these gaps in conventional resting-state studies, we explored an alternative method—maximum entropy modeling based on the energy landscape. This allowed us to validate how the thalamus responds to cortical state transitions. To enhance clarity, we will update our introduction to emphasize the motivations behind our research and the significance of examining these neural mechanisms in a naturalistic setting.
(2) Effects of the uniqueness of the visual stimulus and reproducibility
One of the main drawbacks of the naturalistic condition is the unexpected effects of the stimuli. That is, this study looked into the data recorded from participants who were watching Sherlock, but what would happen to the results if we analyzed the brain activity data obtained from individuals who were watching different movies? To ensure the generalizability of the current findings, it would be necessary to demonstrate qualitative reproducibility of the current observations by analysing different datasets that employed different movie stimuli. In fact, it'd be possible to find such open datasets, like www.nature.com/articles/s41597-023-02458-8.
We appreciate your concern regarding the reproducibility of our findings. The dataset from the "Sherlock" study is of high quality and has shown good generalizability in various research contexts. We acknowledge the importance of validating our results with different datasets to enhance the robustness of our conclusions. While we are open to exploring additional datasets, we intend to pursue this validation once we identify a suitable alternative. Currently, we are considering a comparison with the dataset from "Forrest Gump" as part of our initial plan.
(3) Spatial accuracy of the "Thalamic circuit" definition
One of the main claims of this study heavily relies on the accuracy of the localization of two different thalamic architectures: matrix and core. Given the conventional or relatively low spatial resolution of the fMRI data acquisition (3x3x3 mm^3), it appears to be critically essential to demonstrate that the current analysis accurately distinguished fMRI signals between the matrix and core parts of the thalamus for each individual.
We acknowledge the importance of accurately localizing the different thalamic architectures, specifically the matrix and core regions. To address this, we downsampled the atlas of matrix and core cell populations from the previous study from a resolution of 2x2x2 mm<sup>3</sup> to 3x3x3 mm<sup>3</sup>, which aligns with our fMRI data acquisition. We would report the atlas as Supplementary Figures in our revision.
(4) More detailed analysis of the thalamic circuits
In addition, if such thalamic localisation is accurate enough, it would be greatly appreciated if the authors perform similar comparisons not only between the matrix and core architectures but also between different nuclei. For example, anterior, medial, and lateral groups (e.g., pulvinar group). Such an investigation would meet the expectations of readers who presume some microscopic circuit-level findings.
We appreciate your suggestion regarding a more detailed analysis of thalamic circuits. We have touched upon this in the discussion section as a forward-looking consideration. However, we believe that performing nuclei segmentation with 3T fMRI may not be ideal due to well-documented concerns regarding signal-to-noise ratio and spatial resolution. That said, we are interested in exploring these nuclei-pathway connections to cortical areas in future studies with a proper 7T fMRI naturalistic dataset.
(5) Rationale for different time window lengths
The authors adopted two different time window lengths to examine the neural dynamics. First, they used a 21-TR window for signal normalisation. Then, they narrowed down the window length to 13-TR periods for the following statistical evaluation. Such a seemingly arbitrary choice of the shorter time window might be misunderstood as a measure to relax the threshold for the correction of multiple comparisons. Therefore, it'd be appreciated if the authors stuck to the original 21-TR time window and performed statistical evaluations based on the setting.
Thank you for your valuable feedback regarding the choice of time window lengths. We aimed to maintain consistency in window lengths across our analyses. In light of your comments and suggestions from other reviewers, we plan to test our results using different time window lengths and report findings that generalize across these variations. Should the results differ significantly, we will discuss the implications of this variability in our revised manuscript.
(6) Temporal resolution
After identifying brain states with energy landscape analysis, this study investigated the brain state transitions by directly looking into the fMRI signal changes. This manner seems to implicitly assume that no significant state changes happen in one TR (=1.5sec), which needs sufficient validation. Otherwise, like previous studies, it'd be highly recommended to conduct different analyses (e.g., random-walk simulation) to address and circumvent this problem.
Thank you for raising this important point regarding temporal resolution. Many fMRI studies, such as those examining event boundaries during movie watching, operate under similar assumptions concerning state changes within one TR. For example, Barnett et al. processed the dynamic functional connectivity (dFC) with a window of 20 TRs (24.4s). So, we do not think it is a limitation but is a common question related to fMRI scanning parameters. To strengthen our analysis of state transitions and ensure they are not merely coincidental, we plan to conduct random-walk simulations, as suggested, to validate our findings in accordance with methodologies used in previous research.
Reviewer #2 (Public review):
Summary:
In this study, Liu et al. investigated cortical network dynamics during movie watching using an energy landscape analysis based on a maximum entropy model. They identified perception- and attention-oriented states as the dominant cortical states during movie watching and found that transitions between these states were associated with inter-subject synchronization of regional brain activity. They also showed that distinct thalamic compartments modulated distinct state transitions. They concluded that cortico-thalamo-cortical circuits are key regulators of cortical network dynamics.
Strengths:
A mechanistic understanding of cortical network dynamics is an important topic in both experimental and computational neuroscience, and this study represents a step forward in this direction by identifying key cortico-thalamo-cortical circuits. The analytical strategy employed in this study, particularly the LASSO-based analysis, is interesting and would be applicable to other data types, such as task- and resting-state fMRI.
We thanks for this comment and encouragement.
Weaknesses:
Due to issues related to data preprocessing, support for the conclusions remains incomplete. I also believe that a more careful interpretation of the "energy" derived from the maximum entropy model would greatly clarify what the analysis actually revealed.
Thank you for your valuable suggestions, and we apologize for any misunderstandings regarding the interpretation of the energy landscape in our study. To address this issue, we will include a dedicated paragraph in both the methods and results sections to clarify our use of the term "energy" derived from the maximum entropy model. This addition aims to eliminate any ambiguity and provide a clearer understanding of what our analysis reveals.
(1) I think the method used for binarization of BOLD activity is problematic in multiple ways.
a) Although the authors appear to avoid using global signal regression (page 4, lines 114-118), the proposed method effectively removes the global signal. According to the description on page 4, lines 117-122, the authors binarized network-wise ROI signals by comparing them with the cross-network BOLD signal (i.e., the global signal): at each time point, network-wise ROI signals above the cross-network signal were set to 1, and the rest were set to −1. If I understand the binarization procedure correctly, this approach forces the cross-network signal to be zero (up to some noise introduced by the binarization of network-wise signals), which is essentially equivalent to removing the global signal. Please clarify what the authors meant by stating that "this approach maintained a diverse range of binarized cortical states in data where the global signal was preserved" (page 4, lines 121-122).
Thank you for highlighting the potential issue with our binarization method. We appreciate your insights regarding the comparison of network-wise ROI signals with the cross-network BOLD signal, as this may inadvertently remove the global signal. To address this, we will conduct a comparative analysis of results obtained from both our current approach and the original pipeline. If we decide to retain our current method, we will carefully reconsider the rationale and rephrase our descriptions to ensure clarity regarding the preservation of the global signal and the diversity of binarized cortical states.
b) The authors might argue that they maintained a diverse range of cortical states by performing the binarization at each time point (rather than within each network). However, I believe this introduces another problem, because binarizing network-wise signals at each time point distorts the distribution of cortical states. For example, because the cross-network signal is effectively set to zero, the network cannot take certain states, such as all +1 or all −1. Similarly, this binarization biases the system toward states with similar numbers of +1s and −1s, rather than toward unbalanced states such as (+1, −1, −1, −1, −1, −1). These constraints and biases are not biological in origin but are simply artifacts of the binarization procedure. Importantly, the energy landscape and its derivatives (e.g., hard/easy transitions) are likely to be affected by these artifacts. I suggest that the authors try a more conventional binarization procedure (i.e., binarization within each network), which is more robust to such artifacts.
Related to this point, I have a question regarding Figure S1, in which the authors plotted predicted versus empirical state probabilities. As argued above, some empirical state probabilities should be zero because of the binarization procedure. However, in Figure S1, I do not see data points corresponding to these states (i.e., there should be points on the y-axis). Did the authors plot only a subset of states in Figure S1? I believe that all states should be included. The correlation coefficient between empirical and predicted probabilities (and the accuracy) should also be calculated using all states.
Thank you for your thoughtful examination of our data processing pipeline. We agree that a comparison between the conventional binarization method and our current approach is warranted, and we appreciate your suggestion. Upon reviewing Figure S1, we discovered that there was indeed an error related to the plotting style set to "log10." As you correctly pointed out, the data should reflect that the probabilities for states where all networks are either activated or deactivated are zero. We are very interested in exploring the state distributions obtained from both the original and current approaches, as your comments highlight important considerations. We sincerely appreciate your insightful feedback and will make sure to address these points thoroughly in our first revision.
c) The current binarization procedure likely inflates non-neuronal noise and obscures the relationship between the true BOLD signal and its binarized representation. For example, consider two ROIs (A and B): both (+2%, +1%) and (+0.01%, −0.01%) in BOLD signal changes would be mapped to (+1, −1) after binarization. This suggests that qualitatively different signal magnitudes are treated identically. I believe that this issue could be alleviated if the authors were to binarize the signal within each network, rather than at each time point.
Thank you for your important observation regarding the potential inflation of non-neuronal noise in our current binarization procedure. We recognize that this process could lead to qualitatively different signal magnitudes being treated similarly after binarization, as you illustrated with your example. While we acknowledge your point, we believe that conventional binarization pipelines may also encounter this issue, albeit by comparing signals to a network's temporal mean activity. To address this concern and maintain consistency with previous studies, we will discuss this limitation in our revised manuscript. Additionally, if deemed necessary, we will explore implementing a percentile-based threshold above the baseline to further refine our binarization approach. Your suggestion provides a valuable perspective, and we appreciate your insights.
(2) As the authors state (page 5, lines 145-148), the "energy" described in the energy landscape is not biological energy but rather a statistical transformation of probability distributions derived from the Boltzmann distribution. If this is the case, I believe that Figure 2A is potentially misleading and should be removed. This type of schematic may give the false impression that cortical state dynamics are governed by the energy landscape derived from the maximum entropy model (which is not validated).
Thank you for your valuable feedback regarding Figure 2A. We apologize for any confusion it may have created. While we recognize that similar figures are commonly used in literature involving energy landscapes (maximum entropy model), we agree that Figure 2A may mislead readers into thinking that cortical state dynamics are directly governed by the energy landscape derived from the maximum entropy model, which has not been validated. In light of your comments, we will remove Figure 2A and instead emphasize the analytical strategy presented in Figure 2B. Additionally, we will provide a simplified line graph as an illustrative example to clarify the concepts without the potential for misinterpretation.
Reviewer #3 (Public review):
Summary:
In this study, Liu et al. analyze fMRI data collected during movie watching, applied an energy landscape method with pairwise maximum entropy models. They identify a set of brain states defined at the level of canonical functional networks and quantify how the brain transitions between these states. Transitions are classified as "easy" or "hard" based on changes in the inferred energy landscape, and the authors relate transition probabilities to inter-subject correlation. A major emphasis of the work is the role of the thalamus, which shows transition-linked activity changes and dynamic connectivity patterns, including differential involvement of parvalbumin- and calbindin-associated thalamic subdivisions.
Strengths:
The study is methodologically complex and technically sophisticated. It integrates advanced analytical methods into high-dimensional fMRI data. The application of energy landscape analysis to movie-watching data appears to be novel as well. The finding on the thalamus involved energy state transition and provides a strong linkage to several theories on thalamic control functions, which is a notable strength.
Thanks for your comments on the novelty of our study.
Weaknesses:
The main weakness is the conceptual clarity and advances that this otherwise sophisticated set of analyses affords. A central conceptual ambiguity concerns the energy landscape framework itself. The authors note that the "energy" in this model is not biological energy but a statistical quantity derived from the Boltzmann distribution. After multiple reads, I still have major trouble mapping this measure onto any biological and cognitive operations. BOLD signal is a measure of oxygenation as a proxy of neural activity, and correlated BOLD (functional connectivity) is thought to measure the architecture of information communication of brain systems. The energy framework described in the current format is very difficult for most readers to map onto any neural or cognitive knowledge base on the structure and function of brain systems. Readers unfamiliar with maximum entropy models may easily misinterpret energy changes as reflecting metabolic cost, neural effort, or physiological variables, and it is just very unclear what that measure is supposed to reflect. The manuscript does not clearly articulate what conceptual and mechanistic advances the energy formalism provides beyond a mathematical and statistical report. In other words, beyond mathematical description, it is very hard for most readers to understand the process and function of what this framework is supposed to tell us in regards to functional connectivity, brain systems, and cognition. The brain is not a mathematical object; it is a biological organ with cognitive functions. The impact of this paper is severely limited until connections can be made.
Thank you for your insightful and constructive comments regarding the conceptual clarity of our energy landscape framework. We appreciate your perspective on the challenges of mapping the statistical measure of "energy" derived from the Boltzmann distribution onto biological and cognitive operations. To address these concerns, we will revise our manuscript to clarify our expressions surrounding "energy" and emphasize its probabilistic nature. Additionally, we will incorporate a series of analyses that explicitly relate the features of the energy landscape to cognitive processes and key parameters, such as brain integration and functional connectivity. We believe these changes will help bridge the gap between our mathematical framework and its relevance to understanding brain systems and cognitive functions.
Relatedly, the use of metaphors such as "valleys," "hills," and "routes" in multidimensional measures lacks grounding. Valleys and hills of what is not intuitive to understand. Based on my reading, these features correspond to local minima and barriers in a probability distribution over binarized network activation patterns, but similar to the first point, the manuscript does not clearly explain what it means conceptually, neurobiologically, or computationally for the brain to "move" through such a landscape. The brain is not computing these probabilities; they are measurement tools of "something". What is it? To advance beyond mathematical description, these measurements must be mapped onto neurobiological and cognitive information.
Thank you for your valuable feedback. In our revisions, we would aim to link the concept of rapid transition routes in the energy landscape to cognitive processes, such as narrative understanding and related features. By exploring these connections, we hope to provide a clearer context for how our framework can enhance understanding of cognitive functions and their neural correlates.
This conceptual ambiguity goes back to the Introduction. At the level of motivation, the purpose and deliverables of the study are not defined in the Introduction. The stated goal is "Transitions between distinct cortical brain states modulate the degree of shared neural processing under naturalistic conditions". I do not know if readers will have a clear answer to this question at the end. Is the claim that state transitions cause changes in inter-subject correlation, that they index moments of narrative alignment, or that they reflect changes in attentional or cognitive mode? This level of explanation is largely dissociated from the methods in their current form.
Thank you for highlighting this important point regarding the conceptual clarity in our Introduction. We appreciate your feedback about the motivation and objectives of the study. To clarify the stated goal of investigating how transitions between distinct cortical brain states modulate shared neural processing under naturalistic conditions, we will revise the manuscript to explicitly define the specific claims we aim to address. We will ensure that these explanations are closely tied to the methods employed in our study, providing a clearer framework for our readers.
Several methodological choices can use clarification. The use of a 21-TR window centered on transition offsets is unusually long relative to the temporal scale of fMRI dynamics and to the hypothesized rapidity of state transitions. On a related note, what is the temporal scale of state transition? Is it faster than 21 TRs?
Thank you for your insightful questions regarding our methodological choices. Our focus on specific state transitions necessitated the use of a 21-TR window. While it’s true that other transitions may occur within this window, averaging across the same transitions at different times allows us to identify distinctive thalamic BOLD patterns that precede cortical state transitions. This methodology enables us to capture relevant dynamics while ensuring that we focus on the transitions of interest. We appreciate your feedback, and this clarification will be included in our revised manuscript. We would also add a figure that describe the dwell time of cortical states.
The choice of movie-watching data is a strength. But, many of the analyses performed here, energy landscape estimation, clustering of states, could in principle be applied to resting-state data. The manuscript does not clearly articulate what is gained, mechanistically or cognitively, by using movie stimuli beyond the availability of inter-subject correlation.
Thank you for your question, which closely aligns with a concern raised by Reviewer #1. Our core hypothesis posits that naturalistic stimuli yield a broader set of brain states compared to those observed during resting-state conditions. To support this assertion, we will clearly articulate the findings from previous studies that relate to this hypothesis. Additionally, if appropriate, we will provide a comparative analysis between our data and resting-state data to highlight the differences and emphasize the uniqueness of the brain states elicited by naturalistic stimuli.
Because of the above issues, a broader concern throughout the results is the largely descriptive nature of the findings. For example, the LASSO analysis shows that certain state transitions predict ISC in a subset of regions, with respectable R² values. While statistically robust, the manuscript provides little beyond why these particular transitions should matter, what computations they might reflect, or how they relate to known cognitive operations during movie watching. Similar issues arise in the clustering analyses. Clustering high-dimensional fMRI-derived features will almost inevitably produce structure, whether during rest, task, or naturalistic viewing. What is missing is an explanation of why these specific clusters are meaningful in functional or mechanistic terms.
Thank you for your questions. In our revisions, we will perform additional analyses aimed at linking state transitions to cognitive processes more explicitly. Regarding clustering, we will provide a thorough discussion in the revised manuscript.
Finally, the treatment of the thalamus, while very exciting, could use a bit more anatomical and circuit-level specificity. The manuscript largely treats the thalamus as a unitary structure, despite decades of work demonstrating big functional and connectivity differences across thalamic nuclei. A whole-thalamus analysis without more detailed resolution is increasingly difficult to justify. The subsequent subdivision into PVALB- and CALB-associated regions partially addresses this, but these markers span multiple nuclei with overlapping projection patterns.
This suggestion aligns with the feedback from Reviewer #1. We believe that performing nuclei segmentation with 3T fMRI may not be ideal due to well-documented concerns regarding signal-to-noise ratio and spatial resolution. Therefore, investigating core and matrix cell projections across different thalamic nuclei using 7T fMRI presents a promising avenue for further study.
(1) Van Der Meer J N, Breakspear M, Chang L J, et al. Movie viewing elicits rich and reliable brain state dynamics [J]. Nature Communications, 2020, 11(1): 5004.
(2) Song H, Park B Y, Park H, et al. Cognitive and Neural State Dynamics of Narrative Comprehension [J]. Journal of Neuroscience, 2021, 41(43): 8972-8990.
(3) Song H, Shim W M, Rosenberg M D. Large-scale neural dynamics in a shared low-dimensional state space reflect cognitive and attentional dynamics [J]. Elife, 2023, 12.
(4) Shine J M, Lewis L D, Garrett D D, et al. The impact of the human thalamus on brain-wide information processing [J]. Nature Reviews Neuroscience, 2023, 24(7): 416-430.
(5) Yang M Y, Keller D, Dobolyi A, et al. The lateral thalamus: a bridge between multisensory processing and naturalistic behaviors [J]. Trends in Neurosciences, 2025, 48(1): 33-46.
Reviewer #2 (Public review):
Summary:
In this study, Liu et al. investigated cortical network dynamics during movie watching using an energy landscape analysis based on a maximum entropy model. They identified perception- and attention-oriented states as the dominant cortical states during movie watching and found that transitions between these states were associated with inter-subject synchronization of regional brain activity. They also showed that distinct thalamic compartments modulated distinct state transitions. They concluded that cortico-thalamo-cortical circuits are key regulators of cortical network dynamics.
Strengths:
A mechanistic understanding of cortical network dynamics is an important topic in both experimental and computational neuroscience, and this study represents a step forward in this direction by identifying key cortico-thalamo-cortical circuits. The analytical strategy employed in this study, particularly the LASSO-based analysis, is interesting and would be applicable to other data types, such as task- and resting-state fMRI.
Weaknesses:
Due to issues related to data preprocessing, support for the conclusions remains incomplete. I also believe that a more careful interpretation of the "energy" derived from the maximum entropy model would greatly clarify what the analysis actually revealed.
(1) Major Comment 1:
I think the method used for binarization of BOLD activity is problematic in multiple ways.
a) Although the authors appear to avoid using global signal regression (page 4, lines 114-118), the proposed method effectively removes the global signal. According to the description on page 4, lines 117-122, the authors binarized network-wise ROI signals by comparing them with the cross-network BOLD signal (i.e., the global signal): at each time point, network-wise ROI signals above the cross-network signal were set to 1, and the rest were set to −1. If I understand the binarization procedure correctly, this approach forces the cross-network signal to be zero (up to some noise introduced by the binarization of network-wise signals), which is essentially equivalent to removing the global signal. Please clarify what the authors meant by stating that "this approach maintained a diverse range of binarized cortical states in data where the global signal was preserved" (page 4, lines 121-122).
b) The authors might argue that they maintained a diverse range of cortical states by performing the binarization at each time point (rather than within each network). However, I believe this introduces another problem, because binarizing network-wise signals at each time point distorts the distribution of cortical states. For example, because the cross-network signal is effectively set to zero, the network cannot take certain states, such as all +1 or all −1. Similarly, this binarization biases the system toward states with similar numbers of +1s and −1s, rather than toward unbalanced states such as (+1, −1, −1, −1, −1, −1). These constraints and biases are not biological in origin but are simply artifacts of the binarization procedure. Importantly, the energy landscape and its derivatives (e.g., hard/easy transitions) are likely to be affected by these artifacts. I suggest that the authors try a more conventional binarization procedure (i.e., binarization within each network), which is more robust to such artifacts.
Related to this point, I have a question regarding Figure S1, in which the authors plotted predicted versus empirical state probabilities. As argued above, some empirical state probabilities should be zero because of the binarization procedure. However, in Figure S1, I do not see data points corresponding to these states (i.e., there should be points on the y-axis). Did the authors plot only a subset of states in Figure S1? I believe that all states should be included. The correlation coefficient between empirical and predicted probabilities (and the accuracy) should also be calculated using all states.
c) The current binarization procedure likely inflates non-neuronal noise and obscures the relationship between the true BOLD signal and its binarized representation. For example, consider two ROIs (A and B): both (+2%, +1%) and (+0.01%, −0.01%) in BOLD signal changes would be mapped to (+1, −1) after binarization. This suggests that qualitatively different signal magnitudes are treated identically. I believe that this issue could be alleviated if the authors were to binarize the signal within each network, rather than at each time point.
(2) Major Comment 2:
As the authors state (page 5, lines 145-148), the "energy" described in the energy landscape is not biological energy but rather a statistical transformation of probability distributions derived from the Boltzmann distribution. If this is the case, I believe that Figure 2A is potentially misleading and should be removed. This type of schematic may give the false impression that cortical state dynamics are governed by the energy landscape derived from the maximum entropy model (which is not validated).
Author response:
The following is the authors’ response to the original reviews
Public Reviews:
Reviewer #1(Public review):
In this study, Acosta-Bayona et al. aim to better understand how environmental conditions could have influenced specific gene functions that may have been selected for during the domestication of teosinte parviglumis into domesticated maize. The authors are particularly interested in identifying the initial phenotypic changes that led to the original divergence of these two subspecies. They selected heavy metal (HM) stress as the condition to investigate. While the justification for this choice remains speculative, paleoenvironmental data would add value; the authors hypothesize that volcanic activity near the region of origin could have played a role.
The justification of choice to investigate the effects of heavy metal stress is not speculative. As mentioned now in the Abstract, the elucidation of the genome from the Palomero toluqueño maize landrace revealed heavy metal effects during domestication (Vielle-Calzada et al., Science 2009). Our aim was to test the hypothesis that heavy metal (HM) stress influenced the evolutionary transition of teosinte parviglumis to maize.
(1) Although the paper presents some interesting findings, it is difficult to distinguish which observations are novel versus already known in the literature regarding maize HM stress responses. The rationale behind focusing on specific loci is often lacking. For example, a statistically significant region identified via LOD score on chromosome 5 contains over 50 genes, yet the authors focus on three known HM-related genes without discussing others in the region. It is unclear why ZmHMA1 was selected for mutagenesis over ZmHMA7 or ZmSKUs5.
We appreciated the depth and value of this comment.
Maize phenotypic responses to sublethal concentrations to heavy metals – copper (Cu) and cadmium (Cd) in particular - are well characterized and published, and in agreement with our results. In the first section of the Results (pgs 7 and 8), we added pertinent references to clearly show which observations are already known. By contrast, teosinte parviglumis responses are in all cases novel. To our knowledge this is the first study that analyzed in detail the phenotypic response of teosinte to sublethal concentrations of heavy metals, specifically Cu and Cd. We have now emphasized the novelty of these observations (pg 8).
To address the fact that we only focused on three known HM-related genes without discussing others in the statistically significant region identified via LOD score on chr.5, we have added a full section that reads as follows (pgs. 11 to 13 of the new version):
“Large-scale genomic and transcriptomic comparisons indicate that many HM response genes were positively selected across the maize genome.
To expand the results well beyond the analysis of the three genes previously described, we performed a detailed analysis of genetic diversity across the 11.47 Mb genomic region comprised between Z_mSKUs5_ and ZmHMA1. This additional analysis reveals general tendencies in the quantity and nature of loci that were affected by positive selection during the teosinte parviglumis to maize transition in a region identified via LOD score on chr.5. We compared nucleotide variability by using 100 bp bins covering loci composed of two 30 Kb segments up and downstream of coding sequences, respectively, and the coding sequence itself, for 173 genes present within the genomic region comprised between ZmSKUs5 and ZmHMA (Figure S1 and Supplementary File 6). Two types of statistical tests (ANOVA and Wilcoxon) were applied to nucleotide variability comparisons using the entirety of each locus. The Benjamini-Hochber procedure allowed an estimation of the false discovery rate (FDR<0.05) to avoid type I errors (false positives). Although some individual loci appear as differently classified depending on the statistical test applied (22 out of 173 loci), the general differences in nucleotide variability are consistently maintained within the subregions described below. We found that 166 out of 173 loci show signatures of positive selection and are roughly organized in five independent subregions of variable length. The first six loci are consecutively ordered in a 402 Kb subregion that includes ZmSKUs5. A second group of 13 consecutive loci expands over a 1.44 Mb subregion that contains NRAMP ALUMINUM TRANSPORTER1, also involved in HM response through uptake of divalent ions. A third group of 17 consecutive loci expands over 1.28 Mb; eleven contain genes encoding for uncharacterized proteins. The fourth group is composed of 57 consecutive loci expanding over 3.22 Mb and contains genes encoding for DEFECTIVE KERNEL55, AUXIN RESPONSE FACTOR16, and peroxydases involved in responses to oxydative stress. The fifth group contains 12 consecutive loci expanding over 713 Kb and contains ZmHMA1. An additional segment of approximately 1.17 Mb and containing 25 consecutive loci that were positively selected expands away from the ZmSKUs5-ZmHMA1 segment; it also contains several genes encoding for peroxydases. Although multiple loci include genes that could be involved in abiotic stress and oxidative responses, these results suggest that multiple factors other than HM stress could have played a role in the evolutionary mechanisms that affected the genetic diversity of chr.5 during the teosinte parviglumis to maize transition.
To further analyze the possibility that HM response could have played a role in maize emergence and subsequent domestication, we analyzed large scale transcriptomic data corresponding to independent experiments aiming at understanding the response of maize roots to HM stress. Six available transcriptomes were selected for in-depth analysis because they presented a fold change strictly higher than 1, and their results were supported by false discovery rates (FDR<0.05). These six transcriptomes (Table S5) included HM response datasets corresponding to growth conditions that not only incorporated Cu, but also lead (Pb) and chromium (Cr) that were not included in the substrate of our experiments. Transcriptional profiles were obtained from roots of plants at different stages: maize seedlings (Shen et al., 2012; Gao et al., 2015; Zhang et al., 2024a), three week old plantlets (Yang et al., 2023), and plants at V2 stage (Zhang et al., 2024b; Fengxia et al., 2025). A total of 120 genes shared by all six transcriptomes were found to be differentially expressed under HM stress conditions (66 upegulated and 54 downregulated; Figure S3), including ZmSKUs5, ZmHMA1 and ZmHMA7; 52 of them (43.3%) are located in maize loci showing less than 70% of the nucleotide variability found in teosinte parviglumis, suggesting that they were affected by positive selection (Yamasaki et al., 2005; Supplementary File 7). Of 18 mapping in chr.5, twelve are within the 82 cM that fractionates into multiple QTLs under selection during the parviglumis to maize transition. Interestingly, five additional loci containing HM response genes completely lack SNPs within their total length in both parviglumis and maize, and 19 additional loci lack SNPs in at least one 30 Kb segment or their coding region (Supplementary File 7), suggesting the frequent presence of ultraconserved genomic regions in many loci containing HM response genes. When this same analysis was conducted in a set of loci comprising 63 genes previously identified as differentially expressed in response to abiotic stress not directly related to HM responses (hypoxia; nutritional deficiency; soil alkalinity; drought; soil salinity), 18 loci (28.6%) showed less than 70% of the nucleotide variability found in teosinte parviglumis. Only one of them maps in chr.5 and none contained segments or coding regions lacking SNPs in parviglumis or maize. These results suggest that in contrast to other types of abiotic stress response genes, loci comprising a large set of genes that unambiguously respond to HM stress caused by chemical elements of diverse nature were affected by positive selection during the parviglumis to maize transition, irrespectively of their position in the genome.”
The detailed analysis of genetic diversity across 11.47 Mb of chr.5 in the genomic region comprised between ZmSKUs5 and ZmHMA1 in presented as Supplementary File 6.
The analysis of genetic diversity in loci encompassing heavy metal response genes shared by six transcriptomes and abiotic stress controls are described in Supplementary File 7.
In the Discussion (pgs. 21 and 22), we added a paragraph section that reads as follows:
“Although loss of genetic diversity is usually the result of human selection during domestication, it can also represent a consequence of natural selective pressures favoring fitness of specific teosinte parviglumis allelic variants better adapted to environmental changes and subsequently affected by human selection during the domestication process. This possibility is reflected by widely spread selective sweeps affecting a large portion of chr.5 that contains hundreds of genes showing signatures of positive selection. The analysis of 11.47 Mb covering the ZmHMA1ZmSKUs5 segment confirms the presence of large but discrete genomic subregions that were positively selected during the teosinte parviglumis to maize transition. Although several contain genes involved in HM response and oxidative stress, the diversity of gene functions does not necessarily favor abiotic stress over other factors that could be at the origin of selective forces affecting these regions. By contrast, a large scale transcriptomic survey indicates that genes consistently responding to HMs (Cu, Cd, Pb and Cr ) show signatures of positive selection at unusual high frequencies (43.3%) as compared to loci containing genes responding to other types of abiotic stress (28.6%). Our identification of HM response genes affected by positive selection is far from being exhaustive. Nevertheless, it agrees with the expected effects of a widespread selective sweep caused by environmental changes that influenced the parviglumis to maize transition at the genetic level. Of intriguing interest are 24 loci that partially or completely lack SNPs in both teosinte parviglumis and maize, suggesting possible genetic bottlenecks occurred before the teosinte to maize transition. Examples of other edaphological factors driving genetic divergence either in the teosintes or maize include local adaptation to phosphorus concentration in mexicana and parviglumis (Aguirre-Liguori et al. 2019), and fast maize adaptation to changing iron availability through the action of genes involved in its mobilization, uptake, and transport (Benke and Stich 2011). Our results reveal a teosinte parviglumis environmental plasticity that could be related to the function of HM response genes positively selected during the teosinte parviglumis to maize transition. Previous studies have demonstrated that transposable elements (TEs) contribute to activation of maize genes in response to abiotic stress, affecting up to 20% of the genes upregulated in response to abiotic stress, and as many as 33% of genes that are only expressed in response to stress (Makarevitch et al., 2015). It is therefore possible that the HM response of some specific genes that influenced maize emergence or domestication could be mediated by TEs influencing or driving their transcriptional regulation.”
The mutagenic analysis of ZmHMA7 and ZmSKUs5 will be included in a different publication.
(2) The idea that HM stress impacted gene function and influenced human selection during domestication is of interest. However, the data presented do not convincingly link environmental factors with human-driven selection or the paleoenvironmental context of the transition. While lower nucleotide diversity values in maize could suggest selective pressure, it is not sufficient to infer human selection and could be due to other evolutionary processes. It is also unclear whether the statistical analysis was robust enough to rule out bias from a narrow locus selection. Furthermore, the addition of paleoclimate records (Paleoenvironmental Data Sources as a starting point) or conducting ecological niche modeling or crop growth models incorporating climate and soil scenarios would strengthen the arguments.
We think that the detailed analysis of genetic diversity across 11.46 Mb covering the ZmSKUs5 to ZmHMA1 genomic segment – and its statistical validation - provides a precise understanding of the selective sweep dimensions in chr.5.
We do agree that lower nucleotide diversity values in maize are not sufficient to infer human selection. Because many HM response loci show unusually low nucleotide variability in teosinte parviglumis (see the results of the transcriptomic analysis presented above), we cannot discard the possibility that natural selection forces related to environmental changes could have affected native populations of teosinte parviglumis.
To further explore the link between environmental factors, natural or human-driven selection, and the paleoenvironmental context of the parviglumis to maize transition, we revised paleoenvironmental and geological records and added results in two sections that read as follows (pgs. 17 to 20):
“Paleoenvironmental studies reveal periods of climatic instability in the presumed region of maize emergence during the early Holocene.
It is well accepted that temperature fluctuations, volcanism and anthropogenic impact shaped the distribution and abundance of plant species in the Transmexican Volcanic Belt (TMVB) during the last 14,000 years (Torrescano-Valle et al. 2019). The TMVB has produced close to 8000 volcanic structures (Ferrari et al., 2011), transforming the relief multiple times, and causing hydrographic and soil changes that actively modified the distribution and composition of plant communities in Central Mexico. Detailed paleoenvironmental data for the Pleistocene and Holocene is available for several lacustrine zones located within the 50 to 100 km range of the region currently considered the cradle of maize domestication (Matzuoka et al. 2002; Figure 5a). In Lake Zirahuén (102°44′ W; 19°26′ N and approximately 2075 meters above sea level; index [i] in Figure 5a), pollen, microcharcoal and magnetic susceptibility analyses of two sedimentary sequences reveals three periods of major ecological change during the early and middle Holocene.
Between 9500 and 9000 calibrated years before present (cal yr BP), pine forests seem to have been associated with summer insolation increases. A second peak of forest change occurred at around 8200 cal yr BP, coinciding with cold oscillations documented in the North Atlantic. Finally, events occurred between 7500 and 7100 cal yr BP shows an abrupt change in the plant community related to humid Holocene climates and a presumed volcanic event (Lozano-García et al., 2013). The environmental history of the central Balsas watershed has also been documented by pollen, charcoal, and sedimentary analysis conducted in three lakes and a swamp of the Iguala valley (Piperno et al. 2007). Paleoecological records of lake Ixtacyola (8°20N, 99°35W and approximately 720 meters above sea level; index [ii] in Figure 5a) and lake Ixtapa (8°21N, 99°26W) indicate that an important increase in temperature and precipitation occurred between 13000 and 10000 cal yr BP. The pollen record of Ixtacyola showed that members of the genus Zea were already part of the vegetation coverage by 12900 to 13000 cal yr BP, suggesting that some teosintes – likely including parviglumis - were commonly found at elevation areas where they do not presently occur. Lake Almoloya (also named Chignahuapan; 19°05N, 99°20E and approximately 2575 meters above sea level; index [iii] in Figure 5a) in the upper Lerma basin is only 20 Km from the crater of the Nevado de Toluca that is responsible for creating the late Pleistocene Upper Toluca Pumice layer over which the Lerma basin is deposited. Pollen records indicate the presence of Zea species by 11080 to 10780 cal yr BP. As for other locations, an important period of climatic instability prevailed between 11500 and 8500 cal yr BP (Ludlow-Wiechers et al., 2005). Humidity fluctuations occurred until 8000 cal yr BP, with a stable temperate climate between 8500 and 5000 cal yr BP. Although pollen and diatom studies are often difficult to interpret at a regional scale, the overall results presented above suggest consistent periods of Zea plants present in periods of environmental and climatic instability that correlate with the history of volcanic activity during the early Holocene, as described in the next section.
Temporal and geographical convergence between volcanic eruptions and maize emergence during the Holocene.
Current evidence indicates that the emergence and domestication of maize initiated in Mesoamerica some time around 9,000 yr BP (Matsuoka et al. 2002). The current location of teosinte parviglumis populations that are phylogenetically most closely allied with maize are currently distributed in a region located between the Michoacan-Guanajuato Volcanic Field (MGVF) at their northwest, and the Nevado de Toluca and Popocatéptl volcanoes at their east and northeast (Figure 5a; Matsuoka et al. 2002). Precise records of field data indicate that ten accessions were collected in the Balsas river drainage near Teloloapan and Sierra de Huautla (Guerrero), at approximately 100 km south of the Nevado de Toluca crater. Three other accessions were collected near Tejupilco de Hidalgo and Zacazonapan (Estado de México), at approximately 50 to 60 km from the Nevado de Toluca crater (8762, JSG y LOS-161, and JSG-391). And four other accessions were located in Michoacan, at a location within the MGVF (accession 8763), or at mid-distance between the MGVF and the Nevado de Toluca crater (accessions JSG y LOS-130, 8761, and 8766).
The most important source of HMs in ancient soils of Mesoamerica is TMBV-dependent volcanic activity through short- and long-term effects related to lava deposits, ores, hydrothermal flow, and ash (Torrescano-Valle et al. 2019). The Nevado de Toluca volcano produced one of the most powerful eruptions from central Mesoamerica in the Holocene, giving rise to the Upper Toluca Pumice deposit at 12621 to 12025 cal yr BP (Arce et al., 2003; Figure 5b). The pumice fallout blanketed the Lerma and Mexico basins with 40 cm of coarse ash (Bloomfield and Valastro 1977; Arce et al. 2003). A second eruption dated by 36Cl exposure occurred at 9700 cal yr BP (Arce et al. 2003; Figure 5b), and the most recent eruption occurred at 3580 to 3831 cal yr BP (Macías et al. 1997). During the early and middle Holocene, the Popocatéptl volcano produced at least four eruptions dated 13037-12060, 10775–9564, 8328-7591, and 6262-5318 cal yr BP (Siebe et al. 1997); three other important eruptions occurred during the late Holocene, between 2713 and 733 cal yr BP (Siebe and Macías, 2006). In addition, the MGFV is a monogenetic volcanic field for which 23 independent eruptions have been documented during the Holocene, 21 of them located towards the southern part of the field, in close proximity to the region harboring some of the teosinte parviglumis populations most closely related to maize. Three of these eruptions occurred in the early Holocene (El Huanillo 1130 to 9688 cal yr BP; La Taza 10649 to 10300 cal yr BP; Cerro Grande 10173 to 9502 cal yr BP; Figure 5b), and three others during the initial period of the middle Holocene, between 8400 and 7696 cal yr BP (La Mina, Los Caballos, and Cerro Amarillo; Figure 5b). On average, a new volcano forms every ~435 years in the MGFV (Macías and Arce, 2019). No less than 16 other eruptions occurred between 7159 cal yr BP and the present time (Figure 5b). Soils of volcanic origin (andosols) are currently distributed in regions north-west from the Nevado de Toluca and Popocatéptl craters, in close proximity with teosinte parviglumis populations most closely related to maize (Figure S5). Although modern distribution of teosinte populations may differ from their distribution around 9000 yr BP, and unknown populations more closely related to maize may yet to be discovered, this data indicates that the date and region where maize emerged is convergent with the dates and locations of several volcanic eruptions occurred during the Holocene in that same region.”
(3) Despite the interest in examining HM stress in maize and the presence of a pleiotropic phenotype, the assessment of the impact of gene expression is limited. The authors rely on qPCR for two ZmHMA genes and the locus tb1, known to be associated with maize architecture. A transcriptomic analysis would be necessary to 1- strengthen the proposed connection and 2- identify other genes with linked QTLs, such as those in the short arm of chromosome 5.
Real-time qPCR is an accurate and reliable approach to assess the expression of specific genes such as ZMHMA1 and Tb1, but we agree that our results do not allow to establish a direct regulatory link between the function of Tb1, the pleiotropic parviglumis phenotype under HM stress, and the function of ZmHMA1. We also concede that the large transcriptional analysis of HM response in maize (presented above) does not allow to elucidate a possible connection between these two genes. We have substantially downplayed our conclusion in this section by modifying the end of the section in pg. 17, that now reads:
“These results do not allow to directly link the regulation of ZmHMA1 expression to the function of Tb1; however, they open an opportunity to further investigate the possibility that under HM stress, the formation of secondary ramifications in teosinte parviglumis could be repressed by transcription factors of the TCP family, including Tb1.”
This is also emphasized in the Discussion (pg 21) as follows:
“Under HM stress, we also show that Tb1 is overexpressed in the apical meristem of teosinte parviglumis, suggesting that formation of secondary ramifications is repressed by Tb1 function under HM stress, as in extant maize. At this stage we cannot discard the possibility that Tb1 upregulation in parviglumis reflects a more generalized response to abiotic stress; however, the expression ZmHMA1 is downregulated in W22 wild-type maize meristems in the presence of HMs but upregulated in teosinte parviglumis meristems, suggesting that a specific regulatory shift relating HM responses and ZmHMA1 function occurred during the teosinte parviglumis to maize transition.”
On the other hand, the transcriptional analysis the identification of 52 additional HM response genes showing signatures of positive selection occurred during the parviglumis to maize transition; 12 of them map to chr.5 within the region having linked QTLs within the short arm of chr.5. So far, genes involved in HM response and oxidative stress represent the most prevalent class of genes identified within the genomic region showing pleiotropic effects on domestication and multiple linked QTLs in chr.5.
Reviewer #2 (Public review):
Summary:
This work explores the phenotypic developmental traits associated with Cu and Cd responses in teosinte parviglumis, a species evolutionary related to extant maize crops. Cu and Cd could serve as a proxy for heavy metals present in the soils. The manuscript explores potential genetic loci associated with heavy metal responses and domestication identified in previous studies. This includes heavy metal transporters, which are unregulated during stress. To study that, the authors compare the plant architecture of maize defective in ZmHMA1 and speculate on its association with domestication.
Strengths:
Very few studies covered the responses of teosintes to heavy metal stress. The physiological function of ZmHMA1 in maize also gives some novelty in this study. The idea and speculation section is interesting and well-implemented.
Weaknesses:
The authors explored Cu/Cd stress but not a more comprehensive panel of heavy metals, making the implications of this study quite narrow. Some techniques used, such as end-point RT-PCR and qPCR, are substandard for the field. The phenotypic changes explored are not clearly connected with the potential genetic mechanisms associated with them, with the exception of nodal roots. If teosintes in response to heavy metal have phenotypic similarity with modern landraces of maize, then heavy metal stress might have been a confounding factor in the selection of maize and not a potential driving factor. Similar to the positive selection of ZmHMA1 and its phenotypic traits. In that sense, there is no clear hypothesis of what the authors are looking for in this study, and it is hard to make conclusions based on the provided results to understand its importance. The authors do not provide any clear data on the potential influence of heavy metals in the field during the domestication of maize. The potential role of Tb-1 is not very clear either.
Thank you for these comments. We have now emphasized our hypothesis in the abstract and the last paragraph of the Introduction (pg. 6):
“To test the hypothesis that heavy metal (HM) stress influenced the evolutionary transition of teosinte to maize, we exposed both subspecies to sublethal concentrations of copper and cadmium etc…”
A comprehensive panel of heavy metals would not be more accurate in terms of simulating the composition of soils evolving across 9,000 years in the region where maize presumably emerged. Copper (Cu) and cadmium (Cu) correspond each to a different affinity group for proteins of the ZmHMA family. ZmHMA1 has preferential affinity for Cu and Ag (silver), whereas ZmHMA7 has preferential affinity to Cd, Zn (zinc), Co (cobalt), and Pb (lead). Since these P1b-ATPase transporters mediate the movement of divalent cations, their function remains consistent regardless of the specific metal tested, provided it belongs to the respective affinity group. By applying sublethal concentrations of Cd (16 mg/kg) and Cu (400 mg/kg), we caused a measurable physiological response while allowing plants to complete their life cycle, including the reproductive phase, facilitating a comprehensive analysis of metal stress adaptation. Whereas higher doses impair flowering or are lethal, lower Cu/Cd concentrations do not consistently show conventional phenotypic responses such as reduced plant growth (AbdElgawad et al. 2020; Atta et al., 2023)
Based on comments by both reviewers, we present now a large transcriptional analysis that incorporates HM responses to lead (Pb) and chromium (Cr), in addition to Cu. Results show that many genes responding to Pb and Cr were also positively selected across the maize genome, suggesting that HM stress led to a ubiquitous rather than a specific evolutionary response to heavy metals (please see our response to Reviewer#1 and sections in pgs. 11 to 13) .
Real-time qPCR is an accurate and reliable approach to assess the expression of specific genes such as ZMHMA1 and Tb1, but we agree that our results do not allow to establish a direct regulatory link between the function of Tb1, the pleiotropic parviglumis phenotype under HM stress, and the function of ZmHMA1. We also concede that the large transcriptional analysis of HM response in maize (presented above) does not allow to elucidate a possible connection between these two genes. Therefore, we have substantially downplayed our conclusion in this section by modifying the end of the section in pg. 17, that now reads:
“These results do not allow to directly link the regulation of ZmHMA1 expression to the function of Tb1; however, they open an opportunity to further investigate the possibility that under HM stress, the formation of secondary ramifications in teosinte parviglumis could be repressed by transcription factors of the TCP family, including Tb1.”
There are two phenotypic changes clearly connected with the genetic mechanisms involved in the parviglumis to maize transition: plant height and the number of seminal roots (not nodal roots). These changes have been now emphasized in the Abstract and the description of the results.
Regarding the possibility for HM stress to represent a confounding factor in the selection of maize and not a driving factor, we expanded the genomic analysis of genetic diversity well beyond the analysis of the three genes under initial study, to cover a segment of 11.47 Mb comprised between ZmSKUs5 and ZmHMA1. We compared nucleotide variability by using 100 bp bins covering loci composed of two 30 Kb segments up and downstream of coding sequences, respectively, and the coding sequence itself, for 173 genes present within the genomic region comprised between ZmSKUs5 and ZmHMA (Figure S1 and Supplementary File 6). The full analysis is presented in a new section pgs. 11 and 12. We found that 166 out of 173 loci show signatures of positive selection and are roughly organized in five independent subregions of variable length. Four out of five subregions contain more than one HM or oxidative stress response gene within loci showing signatures of positive selection. Although multiple factors other than HM stress could have played a role in the evolutionary mechanisms that affected the genetic diversity of chr.5, large scale transcriptomic data corresponding to independent experiments aiming at understanding the response of maize roots to HM stress allowed the identification of 49 additional HM response genes within loci showing positive selection across the genome, a proportion (43.3%) far greater than the proportion of loci containing response genes to other types of abiotic stress not related to HMs (28.6%). These results are described in detail in pgs. 12 and 13 (Figure S3 and Supplementary File 7). These results provide strong evidence in favor of HM stress and not another factor driving positive selection.
We now provide precise and pertinent paleoenvironmental data on the potential influence of heavy metals in the field. In sections pgs. 17 to 20 we review paleoenvironmental studies revealing periods of climatic instability in the presumed region of maize emergence during the early Holocene, and data indicating that the date and region where maize emerged is convergent with the dates and locations of several volcanic eruptions occurred during the early and middle Holocene in that same region. Please see responses to Reviewer#1 for details.
We agree that our results do not allow to establish a direct regulatory link between the function of Tb1, the pleiotropic parviglumis phenotype under HM stress, and the function of ZmHMA1. We also concede that the large transcriptional analysis of HM response in maize (presented above) does not allow to elucidate a possible connection between these two genes. Therefore, we have substantially downplayed our conclusion in this section by modifying the end of the section in pg. 17, that now reads:
“These results do not allow to directly link the regulation of ZmHMA1 expression to the function of Tb1; however, they open an opportunity to further investigate the possibility that under HM stress, the formation of secondary ramifications in teosinte parviglumis could be repressed by transcription factors of the TCP family, including Tb1.”
This is also emphasized in the Discussion (pg 21) as follows:
“Under HM stress, we also show that Tb1 is overexpressed in the apical meristem of teosinte parviglumis, suggesting that formation of secondary ramifications is repressed by Tb1 function under HM stress, as in extant maize. At this stage we cannot discard the possibility that Tb1 upregulation in parviglumis reflects a more generalized response to abiotic stress; however, the expression ZmHMA1 is downregulated in W22 wild-type maize meristems in the presence of HMs but upregulated in teosinte parviglumis meristems, suggesting that a specific regulatory shift relating HM responses and ZmHMA1 function occurred during the teosinte parviglumis to maize transition.”
Recommendations for the authors:
Reviewer #1 (Recommendations for the authors):
While the dataset generated provides an interesting foundation for hypothesis testing on HM stress and domestication, the current data do not sufficiently support the conclusions of the manuscript.
(1) The description of maize and teosinte architecture under HM stress is well presented.
However, traits like shoot height, leaf size reduction, and biomass loss also occur under other environmental stresses such as drought and salinity. Additional evidence beyond shoot and root architecture would help validate the link between tb1 expression and specific ZmHMA genes under HM stress, or whether it reflects a more generalized stress response.
We have already addressed in detail this point in the public response to Reviewer#1.
(2) The nucleotide variability analysis is interesting, but I would have liked to see additional information to clarify the choice of the data selection and the strength of the conclusions with human selection.
We have already addressed in detail this point in the public response to Reviewer#1.
a) The choice of Tripsacum dactyloides as the outgroup to determine nucleotide variability seems to be distant, and I wonder whether other combinations with a closer outgroup or multiple outgroups were tried to provide a more accurate context.
Nucleotide variability in Tripsacum dactyloides is used to graphically illustrate an external reference and not as an outgroup in the extended analysis of genetic diversity at the locus and genomic level. We did not used Tripsacum dactyloides as an outgroup in our statisticalm analysis. We could have indeed a closer teosinte subspecies as an outgroup, but at this stage no data warrants that environmentally-related selective pressures could have affected genetic diversite in other teosintes. This possibility in currently being investigated.
b) Evolutionary differences not related to human influence could affect the results. The phrase "order of magnitude difference in π values" needs statistical validation (e.g., confidence intervals, p-values).
We agree and have eliminated the sentence, as it is no longer relevant at the light of the detailed genomic analysis of genetic diversity prsented in Supplementary File 6.
c) The comparison with ZmGLB1, a neutral control locus, suggests that domestication-related changes in nucleotide variability are specific to the three candidate genes. However, the concept of neutrality is complex, and while ZmGLB1 may be considered neutral in this case, the argument does not address the possibility of other factors, such as linked selection, that could influence variability in these genes. Referencing Hufford et al. is insufficient and would require a deeper argument.
We also agree with this comment. We think that the influence and consequences of linked selection are now well documented for 11.46 Mb analyzed in chr.5 (pgs 11 and 12) in the main text and Supplementary File 6).
(3) The statement: "Our evidence indicates that HM stress revealed a teosinte parviglumis environmental plasticity that is directly related to the function of specific HM response genes that were affected by domestication through human selection" is not supported by the presented data. The rationale for the specific Cd/Cu dosage used is unclear. A dose-response gradient would better demonstrate the nature and strength of the plastic response.
Previous reports support the rationale for the specific HM dosage in this study; Cu/Cd dosage response gradients have been conducted in maize (AbdElgawad et al. 2020; Atta et al., 202), but since no studies have been conducted in teosinte, we reasoned that it was important to apply the same treatment to both subspecies. We have now emphasized this rationale by adding the following in pg XX: “Whereas higher doses impair flowering or are lethal, lower Cu/Cd concentrations do not consistently show conventional phenotypic responses such as reduced plant growth (AbdElgawad et al. 2020; Atta et al., 2023)”.
We agree that the statement raised by the reviewer needed revision at the light of our results. We did revise the statement to accurately reflect our current evidence as follows: “Our results reveal a teosinte parviglumis environmental plasticity that is likely related to the function of HM response genes positively selected during the teosinte parviglumis to maize transition.”
(4) In maize, TEs are known to influence gene expression under abiotic stress, including for tb1 (PMID: 25569788). Since the author appears to make a causative conclusion between ZmHMA1, TB1, and HM stress, I would have liked to see a whole-transcriptome analysis and not a curation of two genes to determine whether other factors, such as TEs, can have that would lead to similar outcomes.
We agree that is definetely a possibility that we have not investigated at this stage. However, we added a pargraph to reflect this pertinent suggestion:
“Previous studies have demonstrated that transposable elements (TEs) contribute to activation of maize genes in response to abiotic stress, affecting up to 20% of the genes upregulated in response to abiotic stress, and as many as 33% of genes that are only expressed in response to stress (Makarevitch et al., 2015). It is therefore possible that the HM response of some specific genes that influenced maize emergence or domestication could be mediated by TEs influencing or driving their transcriptional regulation.”
(5) I would suggest that the authors carefully review the tables, figures, and the corresponding legends. For example :
a) Table 2 is called before Table 1, I would therefore suggest changing the numbering to reflect the paragraph order.
Thank you for your help, we did change the order of the Tables in the new version.
b) In Table 2, it is not clear whether the P value applies to the mean difference between WT and the mutant zmhma1, either in the presence or the absence of heavy metals. In addition, the authors need to use the P-value to estimate the differences between WT in the absence vs presence of HM, and WT in the absence of HM versus the mutant in the absence of HM (idem for presence).
We did address this issue in detail and added P-values and specific pairwise comparisons to that Table (now Table 1). Data are presented as mean ± standard deviation and were tested by a paired Student’s T-Test. When the effects were significant according to T-Test, the treatments were compared with the Welch two sample T-Test at P < 0.05.
c) Table 1 and Table 2: Indicate what type of statistical test was used and the number of plants used for each experiment (n). Also, I recommend the use of scientific notation for the P-values.
The statistical tests have now been indicated, scientific notation has been added to the P-values; the number of plants and biological replicates are indicated in the Methods section.
d) Lines 202 and 204: I assume Table 1 should be called instead of Table 2.
This error has been corrected.
e) General: In the text, when significance is highlighted along with measurements, the p-value needs to be added.
We have added the P-value along the measurement for all significant differences.
f) In the text, it is also mentioned that "the expression of ZMHMA1 was significantly increased in the presence of HMs (Figure 3c)". We are looking here at an RT-PCR, which is qualitative and without a robust quantitative comparison and statistics, I cannot conclude this assessment based on the presented evidence. No statistical measure is indicated here.
Panel 3c is not RT-PCR but a real-time qPCR, showing relative fold-change, normalized to actin, with a 3-technical triplicate per 3 biological replicates). We have added error bars (SD) and P-values represented by asterisks (calculated with Student's t statistic) to support significant differences (P<0.05 and P<0.01). ZmHMA1 expression was significantly increased in the presence of HMs only in teosinte; there was no significant difference in maize.
g) Figure 3 should at least have the gene name in the figure to quickly understand the figure panel. The key conserved domains should also be identified.
We agree and apologize for the omission. The gene names have been added adjacent to the structures.
h) Sentence at lines 459-460 lacks words and punctuation.
This unfortunate rror has also been corrected.
i) Figure S1, the reference Lemmon and Doebley, 2024 should be Lemmon and Doebley, 2014 to harmonize with the text.
The correct year is 2014. We have corrected this error.
Reviewer #2 (Recommendations for the authors):
(1) The narrative should be clearer, starting with a clearer hypothesis that is later sustained or not in the results, and then discussed in the idea and speculation section.
Thank you for the comment. We have clarified the hypothesis, it is included in the abstract and the last paragraph of the Introduction. We hope it is now clear that the evidence presented supports our hypothesis
(2) Focus more on traits that are relevant, for example, nodal and seminal roots.
We modified the text to emphasize three relevant traits. In the case of teosinte under HM stress, absence of tillering and increase in the number of female inflorescences. In the case of the zmha1 mutant under HM stress, differences in the number of nodal roots, and differences in height.
(3) RNA-seq in Cu/Cd stress could make the work much more useful and complete.
As previously mentioned, we have incorporated a large scale transcriptional analysis on the basis of six transcriptomes statistically validated (Table S5). Please see sections pgs. 11 to 13 for details.
plasmid_99297
DOI: 10.1038/s41467-025-66861-y
Resource: RRID:Addgene_99297
Curator: @scibot
SciCrunch record: RRID:Addgene_99297
RRID:Addgene_12259
DOI: 10.1038/s41467-025-66861-y
Resource: RRID:Addgene_12259
Curator: @scibot
SciCrunch record: RRID:Addgene_12259
RRID:Addgene_60903
DOI: 10.1038/s41467-025-66861-y
Resource: RRID:Addgene_60903
Curator: @scibot
SciCrunch record: RRID:Addgene_60903
RRID:Addgene_120556
DOI: 10.1038/s41467-025-66861-y
Resource: RRID:Addgene_120556
Curator: @scibot
SciCrunch record: RRID:Addgene_120556
RRID:Addgene_12260
DOI: 10.1038/s41467-025-66861-y
Resource: RRID:Addgene_12260
Curator: @scibot
SciCrunch record: RRID:Addgene_12260
Le Sentiment d'Appartenance : Moteur de la Réussite Scolaire
Le sentiment d'appartenance en milieu scolaire est un besoin psychologique fondamental, défini comme le sentiment d'être accepté, respecté, inclus et soutenu au sein de la communauté éducative.
Loin d'être un simple facteur de confort émotionnel, il constitue un levier puissant pour la motivation, la réussite des élèves et la prévention du décrochage.
Son contraire, le sentiment de rejet ou d'exclusion, engendre des émotions négatives telles que l'anxiété et la dépression.
La construction de ce sentiment ne se décrète pas ; elle se cultive à travers une approche systémique et intentionnelle.
Elle repose sur la satisfaction de trois besoins psychologiques de base : l'autonomie, la compétence et l'appartenance sociale.
Les stratégies efficaces incluent la co-construction de projets d'établissement impliquant l'ensemble des acteurs (élèves, enseignants, personnels), la création de rituels et de symboles fédérateurs, et la mise en place d'un climat de confiance et de respect mutuel.
Les initiatives de terrain, comme les systèmes de "maisons", peuvent dynamiser ce sentiment mais comportent des risques de conformité et de rivalité si elles ne sont pas soigneusement encadrées.
Le sentiment d'appartenance ne concerne pas uniquement les élèves.
Il est tout aussi crucial pour les personnels, dont l'engagement et le bien-être dépendent fortement de leur intégration dans une équipe soudée et d'un projet partagé.
En fin de compte, un fort sentiment d'appartenance enclenche un cercle vertueux, renforçant le sentiment d'efficacité personnelle et collective, et incitant les individus à s'engager dans des défis plus complexes, générant ainsi un épanouissement et un accomplissement accrus pour toute la communauté scolaire.
--------------------------------------------------------------------------------
Le sentiment d'appartenance est une motivation humaine si essentielle que son absence peut entraîner de graves conséquences psychologiques.
S'appuyant sur les travaux de référence de Roy Baumeister et Mark Leary (1995), le professeur Jean Eut le définit comme "le sentiment d'être accepté et compris par les gens qui nous entourent".
Ce besoin satisfait génère des émotions positives comme le bien-être et la joie.
Inversement, son contraire est défini comme "le sentiment d'être rejeté, exclu ou ignoré par les autres", menant à des émotions négatives telles que l'anxiété, la dépression, la solitude et la jalousie.
Les recherches montrent que, parmi toutes les variables objectives pouvant contribuer au bonheur (dans les sociétés où les besoins physiologiques sont satisfaits), la seule qui ressort objectivement est la présence d'un réseau social solide.
Appliqué à l'école, le sentiment d'appartenance est défini par Carole Good et Kathleen Grady (1993) comme "la mesure dans laquelle les élèves se sentent personnellement acceptés, respectés, inclus et soutenu par les autres dans l'environnement social scolaire".
Il s'agit d'une construction multidimensionnelle complexe, dont la terminologie dans la recherche est variée (lien scolaire, engagement, climat scolaire, etc.), ce qui a pu affaiblir la cohérence des travaux sur le sujet.
Néanmoins, trois facteurs semblent déterminants pour qu'un enfant se sente bien à l'école :
1. Se sentir compétent sur le plan académique.
2. Se sentir socialement lié et valorisé.
3. Se sentir relativement autonome.
Un outil de mesure, l'échelle du sentiment psychologique d'appartenance à l'école, a été validé en version française en 2024, offrant un moyen pratique pour la communauté éducative d'appréhender ce concept.
Le sentiment d'appartenance est l'un des trois piliers de la théorie de l'autodétermination d'Edward Deci et Richard Ryan.
Pour qu'un individu soit en bonne santé mentale et psychique, trois besoins fondamentaux doivent être satisfaits :
• Le besoin d'autonomie : Le sentiment d'être à l'origine de ses propres actions.
• Le besoin de compétence : Le sentiment d'être efficace dans son environnement.
• Le besoin d'appartenance sociale : Le sentiment d'être connecté et accepté par les autres.
Ces trois besoins sont intrinsèquement liés et doivent être considérés de manière globale lors de la conception de tout dispositif visant à renforcer le climat scolaire.
L'analyse des pratiques de terrain révèle deux approches complémentaires pour cultiver le sentiment d'appartenance : une approche systémique, pilotée par la direction, et des initiatives de terrain portées par les équipes pédagogiques.
Pierre Ronchaud, proviseur d'un lycée ouvert en 2021, a dû créer une culture d'établissement à partir d'une "feuille blanche".
Son approche illustre comment le sentiment d'appartenance peut être intégré au cœur de la stratégie d'un établissement.
• Principes fondateurs :
◦ Le sentiment d'appartenance "ne se décrète pas", il doit naître et être cultivé.
◦ Il repose sur un lieu, une histoire à écrire et une "adhésion à un projet".
◦ Le projet doit être co-construit de manière collaborative, non descendante, avec les élèves et l'ensemble des personnels.
• Actions concrètes mises en œuvre :
◦ Projet d'établissement : Document fédérateur centré sur des valeurs fortes comme le partage, l'émancipation et la création, applicables à tous (élèves et adultes).
◦ Aménagement des espaces : Chaque classe dispose de sa propre salle, que les élèves peuvent utiliser en autonomie lorsqu'ils n'ont pas cours.
◦ Suppression de la sonnerie : Une mesure qui vise à responsabiliser l'ensemble de la communauté.
◦ Laboratoire Pédagogique : Un temps de concertation de deux heures, sanctuarisé tous les 15 jours (vendredi de 16h à 18h), financé sur la dotation globale horaire de l'établissement.
Ce choix managérial fort positionne la collaboration comme un élément central du travail des enseignants.
◦ Inclusion de tous les personnels : Une attention particulière est portée à l'intégration de tous les membres de la communauté, y compris les agents d'accueil, reconnus comme les premiers représentants du lycée.
Natacha Strolsler, enseignante au collège Langevin-Wallon, a mis en place un système de "maisons" (Griffon, Dragon, Phénix, Sphinx) inspiré des modèles anglo-saxons.
• Fonctionnement :
◦ Chaque élève et adulte volontaire est assigné à une maison.
◦ Des activités collectives (olympiades, défis, rallye lecture) sont organisées tout au long de l'année pour rapporter des points et remporter une coupe finale.
◦ Des symboles matériels renforcent l'identité des maisons (blasons, t-shirts, sweatshirts).
◦ Les adultes ("doyens") jouent un rôle crucial d'animation et de motivation, incarnant "l'exemplarité".
• Impacts observés :
◦ Forte motivation des élèves qui adhèrent au projet, y compris ceux en difficulté qui trouvent des domaines où ils peuvent exceller.
◦ Création d'une fierté d'appartenance et d'un esprit de groupe.
◦ Tous les élèves n'accrochent pas, le dispositif étant imposé en 6ème.
Jean Eut apporte un regard de chercheur sur ces dispositifs :
• Sur le système des maisons :
◦ Potentiels : Il peut avoir un "effet booster", encourager l'auto-organisation et peut être ludique.
◦ Risques : Il peut imposer une forte conformité et pousser certains à adopter des comportements ou des valeurs qui ne sont pas les leurs.
Une rivalité exacerbée entre les maisons peut conduire à des dérives dangereuses si le projet est pris "au premier degré".
Il faut également distinguer l'enthousiasme initial ("intérêt situationnel") d'un impact durable sur les valeurs.
• Sur l'approche systémique :
◦ La démarche du lycée Charles Mérieux est jugée "fondamentalement importante" et "tout à fait pertinente".
◦ Sanctuariser un temps de concertation est une décision managériale qui reconnaît les enseignants comme des "cadres concepteurs" et non de simples exécutants. ◦
L'objectif final n'est pas l'activité en elle-même, mais de "faire évoluer le système" dans son ensemble.
Le sentiment d'appartenance des enseignants à leur institution est souvent faible.
Ils subissent une pression permanente et une dégradation de la confiance à leur égard.
Un climat d'établissement positif, où règne une forte cohésion d'équipe et un soutien de la hiérarchie, est fondamental pour leur bien-être et leur maintien dans des environnements parfois difficiles.
Intégrer de nouveaux enseignants dans une équipe déjà soudée est un enjeu majeur. L'expérience de Pierre Ronchaud montre que :
• L'imposition est contre-productive.
• Le collectif est le meilleur vecteur de persuasion.
Il est plus efficace de laisser les collègues expliquer et convaincre un nouvel arrivant que de le faire via la hiérarchie.
• Des entretiens réguliers et informels sont essentiels pour écouter et accompagner les nouveaux personnels.
Il existe un lien direct entre le sentiment d'appartenance et le sentiment d'efficacité personnelle.
Le modèle heuristique de Jean Eut postule que :
1. Le sentiment d'appartenance sociale est le point de départ.
2. Il a un effet positif sur le sentiment d'efficacité personnelle et collective.
3. Cela incite les individus à s'engager dans des actions plus complexes, en sentant le soutien du groupe.
4. La réussite de ces défis "hors norme" génère un sentiment d'accomplissement qui renforce à son tour la cohésion du groupe.
Pierre Ronchaud propose trois principes directeurs pour un chef d'établissement souhaitant cultiver le sentiment d'appartenance :
1. Ne pas être donneur de leçons (Humilité) : Chaque contexte est unique, il n'y a pas de recette miracle.
2. S'appuyer sur l'intelligence collective : Le collectif est la force motrice du changement.
3. Rester centré sur l'intérêt des élèves : Toute action doit viser à les aider à s'épanouir, grandir et réussir.
| Type de Ressource | Auteur(s) / Titre | Description | | --- | --- | --- | | Article Scientifique | Sarasin, Tessier & Trouillou (2006) | Un article de fond dans la Revue française de pédagogie sur le climat motivationnel instauré par l'enseignant et ses effets sur l'implication des élèves. | | Article de Synthèse | Deci & Ryan (2008) | Une traduction en français d'une allocution présentant la théorie de l'autodétermination pour favoriser la motivation et la santé mentale. | | Ouvrage de Management | Jean Eut | Un ouvrage intitulé Piloter l'innovation de l'intérieur, utilisé en formation de cadres pour susciter la réflexion. | | Référence Littéraire | Carlo Lévi - Le Christ s'est arrêté à Eboli | L'histoire d'un intellectuel assigné à résidence qui, par le respect et la mise à profit de ses compétences, parvient à s'intégrer et à être reconnu au sein d'une communauté isolée. |
insalubres
significa que no son saludables y pueden causar daños a la salud.
os cuerpos receptores
Son los medios naturales donde reciben las descargas de contaminación por ejemplo: aire, agua y suelo.
‘As a single-gene condition withhigh autism penetrance, NF1 presents a valuable genetic model foradvancing our understanding of the neurobiological mechanisms ofautism,’ writes one group of researchers.20
A.K. Chisholm, F. Lami, K.M. Haebich, A. Ure, A. Brignell, T. Maloof, N.A. Pride, K.S. Walsh, A. Maier, M. Roue, Y. Granader, B. Barton, H. Darkel, I. Fuelscher, G. Dabscheck, V.A. Anderson, K. Williams, K.N. North & J.M. Payne, ‘Sex- and age-related differences in autistic behaviours in children with neurofibromatosis type 1’, Journal of Autism and Developmental Disorders, vol. 53, 2023, pp. 2835–50.
Seleccionar y colocar:
1 Create the Azure Functions app with a Premium plan type.
2 Create a system-assigned managed identity for the application.
3 Create an access policy in Azure Key Vault for the application identity
Note: This response was posted by the corresponding author to Review Commons. The content has not been altered except for formatting.
Learn more at Review Commons
__Reply to the Reviewers __
We thank the Reviewers for their positive assessment and recognition of the paper achievements. The insightful comments will strengthen the data and manuscript.
Referee #1* *
Minor comments
Fig 1B - add arrows showing mRNAs being translated or not (the latter mentioned in line 113 is not so easy to see). We have magnified the inset of the colocalisation in the right column; we added arrows and arrowheads to differentiate colocalised and non-colocalised bcd with translating SunTag.
Fig 2A - add a sentence explaining why 1,6HD, 2,5HD and NaCl disrupt P bodies. *
We have added the information on the use of 1,6HD, 2,5HD, and NaCl to disrupt P-bodies as below. Revised line 158: “To further show that bcd storage in P bodies is required for translational repression, we treated mature eggs with chemicals known to disrupt RNP granule integrity (31, 37, 69-72). Previous work has shown that the physical properties of P bodies in mature Drosophila oocytes can be shifted from an arrested to a more liquid-like state by addition of the aliphatic alcohol hexanediol (HD) (Sankaranarayanan et al., 2021, Ribbeck and Görlich, 2002; Kroschwald et al., 2017). While 1,6 HD has been widely used to probe the physical state of phase-separated condensates both in vivo and in vitro (Alberti et al., 2019; McSwiggen et al., 2019; Gao et al., 2022), in some cells it appears to have unwanted cellular consequences (Ulianov et al., 2021). These include a potentially lethal cellular consequences that may indirectly affect the ability of condensates to form (Kroschwald et al., 2017) and wider cellular implications thought to alter the activity of kinases (Düster et al., 2021). While we did not observe any noticeable cellular issues in mature Drosophila oocytes with 1,6 HD, we also used 2,5 HD, known to be less problematic in most tissues (Ulianov et al., 2021) and the monovalent salt sodium chloride (NaCl), which changes electrostatic interactions (Sankaranarayanan et al., 2021).”
*Fig 4C - explain in the legend what the white lines drawn over the image represent. And why is there such an obvious distinction in the staining where suddenly the DAPI is much more evident (is the image from tile scans)? *
Figure 4C is the tile scan image of a n.c.10 embryo and the white line classified the image into four quadrants. We used this image to quantify the extent of bcd (magenta) colocalisation to SunTag (green) in the anterior and posterior domains of the embryo in the bar graph shown in panel C’. There is a formatting error in the image. We will correct this in the revised version. We will also include the details of white lines in the legends. Finally, based on further reviewer comments, in the revised version this data is shifted to the supplementary information.
We agree with the reviewer. In this preliminary revision we have changed this statement to: “We did not see any differences in the translation of bcd based on their position with respect to the nuclei position (Figure S5)” (revised line 238-239).
*Line 218: 'The interphase nuclei and their subsequent mitotic divisions appeared to displace bcd towards the apical surface (Figure S6B).' Greater explanation is needed in the legend to Fig S6B to support this statement as the data just seem to show a nuclear division - I would have thought an apical-basal view is needed to conclude this. *
We have rearranged this figure and shown in clarity the apical-basal view of the blastoderm nuclei and the displacement of bcd from the surface of the blastoderm in Figure S8.
New Figure S8: n.c.8 - pre-cortical migration; n.c.12,14- post cortical migration; Mitosis stages of n.c.9-10. The cortical interphase nuclei at n.c. 12,14 displaces bcd. The nuclear area (DAPI, cyan) does not show any bcd particles (magenta) indicated by blue stars. The mitotic nuclei (yellow arrowheads, yellow stars) displace bcd along the plane of nuclear division (doubled headed yellow arrows).
Fig 5B - the authors compare Bcd protein distribution across developmental time. However, in the early time points cytoplasmic Bcd is measured (presumably as it does not appear nuclear until nc8 onwards) and compare the distribution to nuclear Bcd intensities from nc9 onwards. Is most/all of the Bcd protein nuclear localised form nc9 to validate the nuclear quantitation? Does the distribution look the same if total Bcd protein is measured per volume rather than just the nuclear signal? Are the authors assuming a constant fast rate of nuclear import?
From n.c.8 onwards, the Bcd signal in interphase nuclei builds up, with the nuclear intensity becoming very high compared to cytoplasmic Bcd. However, we do see significant Bcd signal in the cytoplasm (i.e., above background). In earlier work, gradients of the nuclear Bcd and nuclear-import mutant Bcd overlapped closely (Figure 1B, Grimm et al., 2010). This essentially suggests the nuclear Bcd gradient reflects the corresponding gradient of cytoplasmic Bcd. Further, the nuclear import of Bcd occurs rapidly after photobleaching (Gregor et al., 2007). Based on these observations, and our own measurements, prior to n.c. 9, the cytoplasmic gradient is likely a good approximation of the overall shape, whereas post n.c. 9 the Bcd signal is largely nuclear localised. Further, the overall profile is not dependent on the nuclear volume.
We will improve the linking of the results to the model. The important point is that when and where Bcd production occurs is more faithfully used, compared with previous approximations. By including more realistic production domains, we can replicate the observed Bcd gradient within the SDD paradigm without resorting to more complex models.
Fig S1A - clarify what the difference is between the 2 +HD panels shown.__ __
The two +HD panels at stage 14 indicate that upon the addition of HD, there are no particles in 70% of the embryos, and 30% show reduced particles. We will add this information to the figure legend.
The density of mRNA is very high in the anterior pole; there is a chance that more than one bcd particle is within the imaged puncta (due to optical resolution limitations). We will change the y-axis to average intensity per molecule to average intensity per puncta.
Yes, we will correct this in the revision.
Beyond 10um from the dorsal surface, the number of bcdsun10 counts is very low. It becomes negligible at the moderate and low domains. We will attach the actual counts of mRNA in all these domains as a supplementary table in the revised version.
General assessment Strengths are: 1) the data are of high quality; 2) the study advances the field by directly visualising Bcd mRNA translation during early Drosophila development; 3) the data showing re-localisation of bcd mRNAs to P bodies nc14 provides new mechanistic insight into its degradation; 4) a new SDD model for Bcd gradient formation is presented. Limitations of the study are: 1) there was already strong evidence (but no direct demonstration) that bcd mRNA translation was associated with release from P bodies at egg activation; 2) it is not totally clear to me how exactly the modified SDD model varies from the original one both in terms of parameters included and model output.
This is the first direct demonstration of the translation of bcd mRNA released as a single mRNA from P bodies. Previously, we have shown that P bodies disruption releases single bcd from the condensates (31). We have captured a comprehensive understanding of the status of individual bcd translation events, from their release from P bodies at the end of oocyte maturation until the end of blastoderm formation.
The underlying SDD model – that of localised production, diffusion, and degradation – is still the same (up to spatially varying diffusion). Yet the model as originally formulated did not fit all aspects of the data, especially with regards to the system dynamics. Here, we demonstrate that by including more accurate approximations of when and where Bcd is produced, we can explain the formation of the Bcd morphogen gradient without recourse to any further mechanism.
Referee #2
Further, we have dedicated supplementary Figure S3 (previously Figure S2) for the validation of our bcdSun10 construct. Briefly, bcdSun10 is inserted into att40 site of chr.2. We did a rescue experiment, where bcdSun10 rescued the lethality of homozygous bcdE1 null mutant. We then performed a colocalisation experiment using smFISH, where we demonstrated that almost all bcd in the anterior pole are of type bcdSun10. We targeted specific fluorescent FISH probes against 10xSunTag sequence (magenta, Figure S2A) and bcd coding sequence (magenta, Figure S2A). Upon colocalisation, we found ~90% of the mRNA are of bcdSun10 type. The remaining 10% could likely be contributed by the noise level (Figure S2B). We will make sure these points are clear in the revised manuscript.
Line 128 and Fig. 1E: The claim that bcd becomes dispersed is difficult to verify by looking at the image. The language could also be more precise. What does it mean to lose tight association? Perhaps the authors could quantify the distribution, and summarize it by a length scale parameter? This is one of the main claims of the paper (cf. Line 23 of the abstract) but it is described vaguely and tersely here.
We have changed the text from, “We also confirmed that bcd becomes dispersed, losing its tight association with the anterior cortex (Figure 1E) (31)” to, “We also confirmed that bcd is released from the anterior cortex at egg activation (Figure 1E) (31, 21).” (Revised line 131).
The release of bcd mRNA at egg activation was first shown in 2008 (Ref 21, Figure 4, D-E) and again in 2021 (Ref 31, Figure 7 B and E). The main point in line 127-128, “P bodies disassembled and bcd was no longer colocalised with P bodies” and the novel aspect of line 23 is “translation observed”. The distribution of bcd mRNA after egg activation was not the point of this section. We have improved the writing in the revision to make this clearer.
Line 146, Fig. 1G: This is a really important figure in the paper, but it is confusing because it seems the authors use the word "translation," when they mean "presence of Bcd protein." In other places in the paper, the authors give the impression that "bcd translation" means translation in progress (assayed by the colocalization of GCN4 and bcd mRNA). However, in Fig. 1G, the focus is only on GCN4. Detecting Bcd protein only at the anterior does not mean that translation happens only at the anterior (e.g., diffusion or spatially-restricted degradation could be in play).
In Figure 1G, we have shown only the “translated” Bcd by staining with a-GCN4. We have changed line 146 from, “Consistent with previous findings, we only observed bcd translation at the anterior of the activated egg and early embryo (Figure 1G-H) (3, 68)” to, “Consistent with previous findings, we only observed the presence of Bcd protein at the anterior of the activated egg and early embryo (Figure 1G-H) (3, 68). (Revised line 151-153). We will use “translating bcd” or “bcd in translation” where we show colocalisation of bcd with BcdSun10 or BcdSun32 elsewhere in the manuscript.
We did not mean to claim that translation occurred only in the anterior pole. We show that the abundance of bcd is very high in the anterior pole (in agreement with previous work) and that this is where the majority of observed translation events took place. Indeed, we have also shown that posteriorly localised mRNAs have the same BcdSun10 intensity per bcd puncta from the posterior pole (Figure 3B & 4C’ and Figure S2 E), but these are much fewer in number.
*It would also be helpful to show a plot with quantification of Bcd detection (or translation) on the y-axis and a continuous AP coordinate on the x-axis, instead of just two points (anterior and posterior poles, the latter of which is uninteresting because observing no Bcd at the posterior pole is expected). *
In Figure 1G,H, our aim was to test whether release from P bodies allowed for bcd mRNA to be translated. We used the presence of Bcd protein at the anterior domain of the oocytes to show this. The posterior pole was included as an internal control. To show the spatial distribution of bcd mRNA and its translation, we used early blastoderm (Figure 3, Figure S4).
Another issue with Fig. 1G is that the A and P panels presumably have different brightness and contrast. If not, just from looking at the A and P panels, the conclusion would be that Bcd protein is diffuse (and abundant) in the posterior and concentrated into puncta in the anterior. The authors should either make the brightness and contrast consistent or state that the P panel had a much higher brightness than the A panel.
We agree with this shortcoming. We have now added the following to Figure 1 legend to clarify this observation. “G: Representative fixed 10 µm Z-stack images (from 10 samples) showing BcdSun32 protein (anti-GCN4) is only present at the anterior of an in vitro activated egg or early embryo 30-minute post fertilization. BcdSun32 protein is not detected in these samples at the posterior pole (image contrast increased to highlight the lack of distinct particles at the posterior). BcdSun32 protein is also not detected at the anterior or posterior of a mature oocyte or an in vitro activated egg incubated with NS8953 (images have the contrast increased to highlight the lack of distinct particles). Scale bar: 20 mm; zoom 2 mm.” (Revised line 623).
In the revised version, we will use Bcd protein when shown with anti-GCN4 staining. We will use “translating bcd” or “bcd in translation” where we show colocalisation of bcd with a-GCN4 (BcdSun10 or BcdSun32). We will change this in the corresponding text.
Line 185: The sentence here is seemingly contradictory: "most...within 100 microns" implies that at least some are beyond 100 microns, while the sentence ends with "[none]...more than 100 microns." The language could perhaps be altered to be less vague/contradictory.
We will clarify this in the revised version. There are few particles visible beyond 100 um. In the lower panel of Figure 3B, the posterior domain shows few particles. However, their actual number compared to bcd counts within the 100 um is negligible (Figure3C). Nonetheless, the few bcd particles we observe do seem to be under translation (quantified in Figure 4C’ and Figure S2E).
In the revised version we will provide the results quantifying the translation events across the anterior- posterior axis. This will provide a clarity to the presence of bcd and their translation in the posterior domain with time.
Our colocalisation analysis is semi-automated. It includes an automated counting of the individual bcd particle counts and a manual judgement of the colocalised BcdSun10 protein (distinct spots, above noise) to bcd particles (Figure S3D). The bcd particle counts ran into thousands in each cyan square box (measuring 50um radius and ~ 20um deep from the dorsal surface). We selected three such boxes covering 150um (continuously) from the anterior pole across A-P axis and 20um deep of the flattened embryo mounts across D-V axis (Figure 3A-C, Figure S4). We have also scanned scarce particles in the posterior; however, bcd counts are very low compared to the anterior. Further, in Figure 4 we have repeated the same technique to measure translation of bcd particles in embryos at different nuclear cycles.
We have also shown continuous intensity measurements of bcd particles with their respective BcdSun10 gradient in Figure 5 across the A-P axis at different nuclear cycles. Here, we know BcdSun10 intensity is not only from the “translating” bcd (colocalised BcdSun10 to bcd particles) but also from the translated BcdSun10 freely diffusing (non-colocalised BcdSun10 to bcd particles). As asked by the reviewer, in the revised version we will add bcd counts and their translation status from anterior to posterior axis for each of the nuclear cycles.
In our future work, we planned to generate MS2 tagged bcdSun10 to measure the rates of translation in live across all nuclear cycles.
*Line 209 and Fig 4C: The authors use the terms "intensity of translation events" or "translation intensity" without clearly defining them. From the figure (specifically from the y-axis label), it looks like the authors are quantifying the intensity per molecule (which is not clearly the same thing as "translation intensity"), but it would be nice if that were stated explicitly. *
In the relevant result section, we have changed the results text to “the intensity of translation events” for explaining the results of Figure 4C’.
In addition to the quantification shown at the anterior and posterior locations of the embryo in the Figure 3 and 4, we will show in the revised version, the quantification of translation events across all locations from the anterior to the posterior. We will use three embryos for each nuclear cycle from n.c.1 to 14.
In n.c.4 in Figure3, we saw few bcd particles in the posterior. However, at n.c.10 in Figure 4C’ the number of posterior bcd particles are higher than at the early stages. We have quantified them in Figure 4C’. We will clarify this from the new set of quantification we are undertaking now to quantify translation across the A-P axis in the revision.
Finally, we will also provide the number of bcd particle counts and their colocalisation with a-GCN4 as a supplementary table.
We have not observed any difference in the translation of bcd particles depending on the position along the Z-axis. We will edit this in our revised version.
We have quantified the bcd mRNA gradient for each n.c. (Figure 5B-C); absolute bcd intensities in Figure 5B, left panel and the normalised intensities in Figure 5C. The length of the mRNA spread appears constant with the half-length maximum of ~75um across all nuclear cycles. Our conclusion of a long ranged Bcd gradient is based on the comparisons of the half-length maximum measurements of bcd particles and BcdSun10 (Figure 5D).
*Line 230: When the authors claim the Bcd gradient is steeper earlier, a quantification of the spatial extent (exponential decay length scale) would be appropriate. Indeed, lambda as a function of time would be beneficial. It should also be placed in context of earlier papers that claim the spatial length scale is constant. *
We will show this effectively from the live movies of bcdSun10/nanos-scFv-sGFP2 in the revised version.
We agree with the reviewer. We will edit this in revision.
Minor comments
*Figure 1 legend: part B says "from 15 samples" but also says N = 20. Which is it, or do these numbers refer to different things? *
We have edited this from, “early embryo (from 15 samples)” to, “early embryo (from 20 samples)”. (Revised line 602).
Edited to “cortical nuclear migration”.
Edited to “nuclear cycles 1-8”.
We will make the changes. It is 100 um.
We will flip the image to match.
It is the standard deviation. This will be explained.
Normalised to the bcd intensity maxima. This will be explained.
Significance
The results, if upheld, are highly significant, as they are foundational measurements addressing a longstanding question of how morphogen gradients are formed, using Bcd (the foundational morphogen gradient) as a model. They also address fundamental questions in genetics and molecular biology: namely, control of mRNA distribution and translation.__ __
We thank Reviewer 2 for highlighting the importance of our work in the field. We are confident that we address the issues raised by Reviewer 2 with the new set of quantifications we are currently working on.
Referee #3
The presentation of the SDD model should be expanded to address how well the characteristic decay length fits A) measured Bcd protein distributions, B) measured at different nuclear cycles. This would strengthen the claim that the new SDD model better captures gradient dynamics given the addition of translation and RNA distribution. These experimental data already exist as reported in Figure 5. In the current Figure 7, panels D and D' add little to the story and could be moved to a supplement if the authors want to include it (in any case, please fix the typo on the time axis of fig 7D' to read "hours"). The model per cell cycle and the comparison of experimental and modeled decay lengths could replace current D and D'.*
Originally, we kept discussion of the SDD model only to core points. It is clear from all Reviewers that expanding this discussion is important. In the revision, we will refocus Figure 7 on describing new results that we can learn. As outlined in the responses above, this paper reveals an important insight: the SDD model – with suitable modifications such as temporally restricted Bcd production – can explain all observed properties of Bcd gradient formation. Other mechanisms – such as bcd mRNA gradients – are not required.
We thank the reviewer for this suggestion. We will add the current models of Bcd gradient formation in the introduction section and will change the narrative of results in the section explaining the models.
(4A) Related to point 3: The entire results text surrounding Figure 2 should be revised to include more detail about A) what specific hypotheses are being tested; and B) to critically evaluate the limitations of the experimental approaches used to evaluate these hypotheses. Hexanediol and high salt conditions are not named explicitly in the text, but the text touts these as "chemicals" that "disrupt P-body integrity." This implies that the treatments are specific to P-bodies. Neither of these approaches are only disrupting P Body integrity. This does not invalidate this approach, but the manuscript needs to state what hypothesis HD and NaCl treatment addresses, and acknowledge the caveats of the approach (such as the non-specificity and the assumptions about the mechanism of action for HD).
We have made the following edits to resolve this point. Revised line 158: “To further show that bcd storage in P bodies is required for translational repression, we treated mature eggs with chemicals known to disrupt RNP granule integrity (31, 37, 69-72). Previous work has shown that the physical properties of P bodies in mature Drosophila oocytes can be shifted from an arrested to a more liquid-like state by addition of the aliphatic alcohol hexanediol (HD) (Sankaranarayanan et al., 2021, Ribbeck and Görlich, 2002; Kroschwald et al., 2017). While 1,6 HD has been widely used to probe the physical state of phase-separated condensates both in vivo and in vitro (Alberti et al., 2019; McSwiggen et al., 2019; Gao et al., 2022), in some cells it appears to have unwanted cellular consequences (Ulianov et al., 2021). These include a potentially lethal cellular consequences that may indirectly affect the ability of condensates to form (Kroschwald et al., 2017) and wider cellular implications thought to alter the activity of kinases (Düster et al., 2021). While we did not observe any noticeable cellular issues in mature Drosophila oocytes with 1,6 HD, we also used 2,5 HD, known to be less problematic in most tissues (Ulianov et al., 2021) and the monovalent salt sodium chloride (NaCl), which changes electrostatic interactions (Sankaranarayanan et al., 2021).”
(4B) Continuing the comment above: it is good that the authors checked that HD and NaCl treatment does not cause egg activation. But no one outside of the field of Drosophila egg activation knows what the 2-minute bleach test is and shouldn't have to delve into the literature to understand this sentence. Please explain in one sentence that "if eggs are activated, then x happens following a short exposure to bleach (citations). We exposed HD and NaCl treated eggs to bleach and observed... ."
We have made the following edits to resolve this point. Revised line 174: “After treating mature eggs with these solutions, we observed BcdSun32 protein in the oocyte anterior (Figure 2A-B). One caveat to this experiment could be that treating mature eggs with these chemicals results in egg activation which would in turn generate Bcd protein. To eliminate this possibility, we first screened for phenotypic egg activation markers, including swelling and a change in the chorion (73). We also applied the classic approach of bleaching eggs for two minutes which causes lysis of unactivated eggs (74). All chemically treated eggs failed this bleaching test meaning they were not activated (74). While we unable to rule out non-specific actions of these treatments, these experiments corroborate that storage in P bodies that adopt an arrested physical state is crucial to maintain bcd translational repression (31).”
(4C) Continuing the comment above: The section of the results related to the endos mutation needs additional information. It is not apparent to the average reader how the endos mutation results in changes in RNP granules, nor what the expected outcome of such an effect would "further test the model" set up by the HD and NaCl experiments. The average reader needs more hand-holding throughout this entire section (related to figure 2) to follow the exposition of the results.
We have made the following edits to resolve this point. Edited line 185: “Finally, we used a genetic manipulation to change the physical state of P bodies in mature oocytes. Mutations in Drosophila Endosulfine (Endos), which is part of the conserved phosphoprotein ⍺-endosulfine (ENSA) family (75), caused a liquid-like P body state after oocyte maturation, similar to that observed with chemical treatment (Figure 2C) (31). This temporal effect matched the known roles of Endos as the master regulator of oocyte maturation (75, 76). endos mutant oocytes lost the colocalisation of bcd mRNA and P bodies, concurrent with P bodies becoming less viscous during oocyte maturation (Figure 2D, Figure S1). Particle size and position analysis showed that bcd mRNA prematurely exhibits an embryo distribution in these mutants (Figure 2E). Due to genetic and antibody constraints, we are unable to test for translation of bcd in the endos mutant. However, it follows that bcd observed in this diffuse distribution outside of P bodies would be translationally active (Figure 2E-F).”
We have made the following edits to resolve this point. Revised line 138: “We next sought to maintain the relationship between bcd mRNA and P bodies through egg activation. This would act as a control to further test if colocalisation of bcd to P bodies was necessary for its translational repression. Previous work has shown that a calcium wave is required at egg activation for further development (references to add Kaneuchi et al., 2015; York-Anderson et al., 2019; Hu and Wolfner, 2019). Chemical treatment with NS8593 disrupts this calcium wave, while other phenotypic markers of egg activation are still observed (58). Using NS8593 to disrupt the calcium wave in the activated egg, we show P bodies are retained during ex vivo egg activation (Figure 1E). In these treated eggs, bcd mRNA remains colocalised with the retained P bodies (Figure 1F). Based on these results and previous observations (31, 66), we hypothesised that the loss of colocalisation between bcd and P bodies correlates with bcd translation.”
*It is unclear why Bcd translation could not be measured in the endos mutant background, but it would be necessary to measure Bcd translation in the endos background. If genotypically it is not possible/inconvenient to invoke the suntag reporter in the endos background, would it not be sufficient to immunostain against Bcd itself? Different Bcd antisera have recently been reported and distributed by the Wieschaus and the Zeitlinger groups. *
We have recently received the Bcd antibody from the Zeitlinger group. This has not been shown to work for immunostaining. It remains unclear if it will be successful in this capacity, but we are currently testing it and will include this experiment in the revision if successful.
*Figure 4 overall is glorious, but there is a problem with panel C. What are the white lines? Why does the intensity for the green and magenta channel change abruptly in the middle of the embryo? *
These white lines divide the embryo into 4 compartments. We used this method to quantify the intensity of Bcd translation with respect to the bcd puncta. We will correct this image as there is a problem in formatting.
*It is noted that neither the methods section or the supplement does not contain any mention of how the modeling was performed. How was parameter beta fit? At least a brief section should be added to the methods describing how beta was fit (pending adjustments suggested in comment 1 above). A platinum-level addition would include a modeling supplement that reports the sensitivity of model outcomes to changes in parameters. *
We apologise for this omission and will include full methodological details in the revision.
Minor Comments:
*Line 39: "blastocyst" should be "blastoderm stage embryo". *
We will edit in the revised version.
We will edit in the revised version.
We will explain in detail in the revised version.
We agree with this shortcoming. We have now added the following to the figure legend to clarify this observation. “G: Representative fixed 10 µm Z-stack images (from 10 samples) showing BcdSun32 protein (anti-GCN4) is only present at the anterior of an in vitro activated egg or early embryo 30-minute post fertilization. BcdSun32 protein is not detected in these samples at the posterior pole (image contrast increased to highlight the lack of distinct particles at the posterior). BcdSun32 protein is also not detected at the anterior or posterior of a mature oocyte or an in vitro activated egg incubated with NS8953 (images have the contrast increased to highlight the lack of distinct particles). Scale bar: 20 mm; zoom 2 mm.” (Revised line 623).
Figure 2 legend: what is +Sch in the x-axis labels of figure 2B? The legend says that 2B is the quantification of the data in 2A, but there is no (presumed control) +Sch image in 2A.__ __
Thank you for this suggestion we have added the data to Figure 2A.
Thank you for this suggestion. We will consider moving Figure 5A to the supplementary.
We will edit in the revised version.
We will edit in the revised version.
We will edit in the revised version.
We have added to Figure 2B: “Quantification of experiments shown in A. The number of oocytes that displayed Bcd protein at the anterior as measured by the presence of BcdSun32 at the anterior of the oocyte, but not the posterior. Schneider’s Insect Medium (+Sch) used as a negative control. N = 30 oocytes for each treatment. Scale bar: 5 um.” (Revised line 646).
Note: This preprint has been reviewed by subject experts for Review Commons. Content has not been altered except for formatting.
Learn more at Review Commons
This is a review of "Dynamics of bicoid mRNA localization and translation dictate morphogen gradient formation" by Athilingam et al. In this manuscript, the authors perform quantification of mRNA localization and translation of bicoid, spanning oogenesis through the maternal to zygotic transition, yielding a definitive characterization of Bicoid gradient formation. The experiments, analysis, and interpretation are on the whole performed rigorously. I very much enjoyed this paper, partly for incorporating the aspects of bcd regulation during oogenesis, which compared to embryonic function of bcd is relatively under-studied. Also valuable is improving the characterization of how bcd expression is shut down at NC14. I have several major comments for revision, and a few minor comments. I should stress that none of the major comments are terrible but are intended to improve the impact/readability/flow of this nice manuscript. With the exception of a straightforward immunostaining experiment, all major comments constitute reworking of the model or the text.
Major Comments:
1) It is not evident from the main results and methods text that the new SDD model incorporates the phenomenon reported in figure 4B. From my reading, the parameter beta accounts for the Bcd translation rate, which according to figure 7B(ii) effectively switches from off to on around fertilization and thereafter remains constant. Figure 4B shows that the fraction of bcd mRNA engaged in translation decreases beginning around NC12/13, and this is one of the more powerful results that comes from monitoring translation in addition to RNA localization/abundance/stability. My expectation based on figure 4B would be that parameter beta should decrease over time beginning around 90-100 minutes and approach zero by ~150 minutes. This rate could be fit to the experimental data that yields figure 4B. The modeling should be repeated while including this information.
2) The presentation of the SDD model should be expanded to address how well the characteristic decay length fits A) measured Bcd protein distributions, B) measured at different nuclear cycles. This would strengthen the claim that the new SDD model better captures gradient dynamics given the addition of translation and RNA distribution. These experimental data already exist as reported in Figure 5. In the current Figure 7, panels D and D' add little to the story and could be moved to a supplement if the authors want to include it (in any case, please fix the typo on the time axis of fig 7D' to read "hours"). The model per cell cycle and the comparison of experimental and modeled decay lengths could replace current D and D'.
3) The exposition of the manuscript would benefit significantly by including a section either in the introduction or the appropriate section of the results that defines the competing models for gradient formation. In the current version, these models are only cited, and the key details only come out late (e.g., lines 302 onward, in the Discussion). Nevertheless, some of the results are presented as if in dialog with these models, but it reads as a one-sided conversation. For instance: Figure 3. The undercurrent in this figure is the RNA-gradient model. In the context of this model, the results clearly show that translation of bcd is restricted to the anterior. Without this context, Figure 3 could read as a fairly unremarkable observation that translation occurs wherever there is mRNA. Restructuring the manuscript to explicitly name competing models and to address how experimental results support or detract from each competing model would greatly enhance the impact of the exposition.
4A) Related to point 3: The entire results text surrounding Figure 2 should be revised to include more detail about A) what specific hypotheses are being tested; and B) to critically evaluate the limitations of the experimental approaches used to evaluate these hypotheses. Hexanediol and high salt conditions are not named explicitly in the text, but the text touts these as "chemicals" that "disrupt P-body integrity." This implies that the treatments are specific to P-bodies. Neither of these approaches are only disrupting P Body integrity. This does not invalidate this approach, but the manuscript needs to state what hypothesis HD and NaCl treatment addresses, and acknowledge the caveats of the approach (such as the non-specificity and the assumptions about the mechanism of action for HD).
4B) Continuing the comment above: it is good that the authors checked that HD and NaCl treatment does not cause egg activation. But no one outside of the field of Drosophila egg activation knows what the 2-minute bleach test is and shouldn't have to delve into the literature to understand this sentence. Please explain in one sentence that "if eggs are activated, then x happens following a short exposure to bleach (citations). We exposed HD and NaCl treated eggs to bleach and observed... ."
4C) Continuing the comment above: The section of the results related to the endos mutation needs additional information. It is not apparent to the average reader how the endos mutation results in changes in RNP granules, nor what the expected outcome of such an effect would "further test the model" set up by the HD and NaCl experiments. The average reader needs more hand-holding throughout this entire section (related to figure 2) to follow the exposition of the results.
4D) Continuing the comment above: The average reader also needs a better explanation of what hypothesis is being tested in Figure 1 with the pharmacological inhibition of calcium.
5) It is unclear why Bcd translation could not be measured in the endos mutant background, but it would be necessary to measure Bcd translation in the endos background. If genotypically it is not possible/inconvenient to invoke the suntag reporter in the endos background, would it not be sufficient to immunostain against Bcd itself? Different Bcd antisera have recently been reported and distributed by the Wieschaus and the Zeitlinger groups.
6) Figure 4 overall is glorious, but there is a problem with panel C. What are the white lines? Why does the intensity for the green and magenta channel change abruptly in the middle of the embryo?
7) It is noted that neither the methods section or the supplement does not contain any mention of how the modeling was performed. How was parameter beta fit? At least a brief section should be added to the methods describing how beta was fit (pending adjustments suggested in comment 1 above). A platinum-level addition would include a modeling supplement that reports the sensitivity of model outcomes to changes in parameters.
Minor Comments:
Referees cross-commenting
OK, We've been asked to comment on each others' reviews. I am reviewer 3. We have not been asked, as far as I can tell, to come up with a consensus review.
Overall, I feel that we are all generally enthusiastic about this manuscript. From most to least enthusiastic, we have reviewer 1, 3, and finally 2. But all three of us are apparently advocating positively and encouraging revision and clarification because, as we all agree, these results are important to publish.
Consensus Strengths:
I agree with all of Reviewer 1's minor points.
I agree with Reviewer 2's points about:
Overall: we have all provided favorable reviews that require mostly tightening of the text, showing some control datasets, maybe quantifying more points across the AP axis, and presenting the SDD model more comprehensively (comparing with old/translation-agnostic model, reporting characteristic decay lengths at different nuclear cycles, incorporating the reported change in translation rate across nuclear cycles (if this survives the clarification of what 'translation' means per Reviewer 2's comments), and perhaps providing more methodological detail on how parameters were fit).
The importance of this study is at several levels. For the developmental biologist, it addresses important mechanisms of translational control and RNA stability over the functional lifetime of a single, critical biological cue that governs embryonic patterning. Not only do the experiments provide quantification of these features, but also point to likely candidates (P-bodies) for gating bcd's translation in the narrow window between egg activation and cellular blastoderm. For the biophysically-inclined, this adds critical quantitative information of translational state that allows for further refining computational models for how this manifestation of a reaction-diffusion system actually comes together in a complex biological context.
The primary audience for this work will be the two groups above: developmental biologists and scientists interested in the quantitative modeling of biological phenomena.
Note: This preprint has been reviewed by subject experts for Review Commons. Content has not been altered except for formatting.
Learn more at Review Commons
In this manuscript by Athilingam et al., the authors are studying the translation of the morphogen Bicoid (Bcd), which is in anterior-posterior patterning of the blastoderm Drosophila embryo. They have used an array of sunTag elements in the 5' UTR of Bcd to detect the localization of translation. They found that, not only is Bcd not translated until egg activation, but it can only be translated at the anterior pole, even though bcd mRNA has a broader spatial distribution.
In general, the paper uses a cutting-edge methodology to address one of the foundational questions of the best-studied morphogen gradient: namely, what is the spatial distribution of the Bcd source? Together with the dynamics of its spreading (which they addressed in a separate study in 2024) and Bcd degradation, their results point to a modified form of the synthesis/diffusion/degradation (SDD) model of Bcd gradient formation, which they have analyzed in the final subsection of the results. However, there are several major issues that erode the validity and impact of the paper, most of which can be put into the category of vague explanations, missing information, or contradictory statements, making it hard to understand/verify what conclusions can be drawn. This is also coupled with vague figures and captions. We describe these, and a few minor issues, in detail below:
It would also be helpful to show a plot with quantification of Bcd detection (or translation) on the y-axis and a continuous AP coordinate on the x-axis, instead of just two points (anterior and posterior poles, the latter of which is uninteresting because observing no Bcd at the posterior pole is expected).
Another issue with Fig. 1G is that the A and P panels presumably have different brightness and contrast. If not, just from looking at the A and P panels, the conclusion would be that Bcd protein is diffuse (and abundant) in the posterior and concentrated into puncta in the anterior. The authors should either make the brightness and contrast consistent or state that the P panel had a much higher brightness than the A panel.
In addition, the authors again quantify only two points. This is a continuously frustrating part of the manuscript, which applies to nearly all figures where the authors looked only at two points in space. At a typical sample size of N = 3, it seems well within time constraints to image at multiple points along the AP axis.
Furthermore, it sounds like the authors are saying the "translation intensity" is the same in anterior and the posterior, which is counterintuitive. The expectation is that translation would be undetectable at the posterior end, in part because bcd mRNA would not be present. (Note that this expectation is even acknowledged by the authors on Line 185, which I comment on above, and also on Line 197). There should also be very low levels of Bcd protein (possibly undetectable) at the posterior pole. As such, the authors should explain how they think their claim of the same "translation intensities" in the anterior vs posterior fits into the bigger picture of what we know about Bcd and what they have already stated in the manuscript. They should also explain how they observed enough molecules to quantify at the posterior end. The authors should also disclose how many points are in each box in the boxplot. For example, the sample size is N = 3 embryos. In just three embryos, how many bcd/GCN4 colocalizations did the authors observe at the posterior end of the embryo?
Minor issues/typos (still must be addressed for content):
Referees cross-commenting
This is Reviewer 2. Yes, I am enthusiastic about the work: it is a much needed set of experiments and it fits well into the overall goal of quantitatively understanding the processes that establish the Bcd gradient. My main concern(s) about this paper is the loose and vague way they described their experiments and the interpretations. My hope is they will use the revision as an opportunity to more precisely explain their work.
Other than that, I am in agreement with the other reviewers on the need to revise for clarity and publish this important work.
The results, if upheld, are highly significant, as they are foundational measurements addressing a longstanding question of how morphogen gradients are formed, using Bcd (the foundational morphogen gradient) as a model. They also address fundamental questions in genetics and molecular biology: namely, control of mRNA distribution and translation.
B.2
B: 2
Al tercer error y cuando se levante
Tesla kills Autopilot, locks lane-keeping behind $99/month fee
Voilà qui est clair et limpide. Tout y est. Plus que la déconstruction: la construction du sexe biologique. plus que l'objectivité, la dé-objectivité: la subjectivité radicale.
BL-23944
DOI: 10.1038/s41467-022-28693-y
Resource: RRID:BDSC_23944
Curator: @bdscstockkeepers
SciCrunch record: RRID:BDSC_23944
8529
DOI: 10.1038/s41467-022-28693-y
Resource: RRID:BDSC_8529
Curator: @bdscstockkeepers
SciCrunch record: RRID:BDSC_8529
BL1522
DOI: 10.1038/s41467-022-28693-y
Resource: RRID:BDSC_1522
Curator: @scibot
SciCrunch record: RRID:BDSC_1522
Addgene_112289
DOI: 10.1038/s41467-022-28693-y
Resource: None
Curator: @scibot
SciCrunch record: RRID:Addgene_112289
BL3041
DOI: 10.1038/s41467-022-28693-y
Resource: RRID:BDSC_3041
Curator: @scibot
SciCrunch record: RRID:BDSC_3041
BL28815
DOI: 10.1038/s41467-022-28693-y
Resource: RRID:BDSC_28815
Curator: @scibot
SciCrunch record: RRID:BDSC_28815
Addgene_27371
DOI: 10.1038/s41467-022-28693-y
Resource: RRID:Addgene_27371
Curator: @scibot
SciCrunch record: RRID:Addgene_27371
Addgene_112284
DOI: 10.1038/s41467-022-28693-y
Resource: RRID:Addgene_112284
Curator: @scibot
SciCrunch record: RRID:Addgene_112284
Addgene_19045
DOI: 10.1038/s41467-022-28693-y
Resource: RRID:Addgene_19045
Curator: @scibot
SciCrunch record: RRID:Addgene_19045
Addgene_34615
DOI: 10.1038/s41467-022-28693-y
Resource: RRID:Addgene_34615
Curator: @scibot
SciCrunch record: RRID:Addgene_34615
uch fields of illicit action are limited only byculture, precedent , opportunity, and the swiftness and certaint y of sanc-tion. If large profits are easily available with relatively little risk, thepotential for organized criminal entrepreneurship is enhanced. This pointseems obvious enough, yet history and experience show that it ha s rarelybeen acted upon by designers of criminal justice systems
This comment is pointing out the flaws of our justice system for not addressing the cultural and economic causes of crime, how can anything change without a systematic difference?
Capacidades
ver que acumulados necesitamos y como los obtiene sim
Reset
este se sca y es sincronico y va junto con change_plan
Asignar/cambiar service_profile_id/versión y disparar reprovisionamiento async si aplica (sin “crear/editar” profiles).
esto esta relciona con esim y catalog (service-profile)
sincronización administrativa
ver si hay sincronizacion (cambios en el sim) el unico que tiene cambios es esim. con la unica capacidad de cambiar imcsi y imsi