- Sep 2020
-
github.com github.com
-
aaronpeikert. (2020). Aaronpeikert/reproducible-research [TeX]. https://github.com/aaronpeikert/reproducible-research (Original work published 2019)
-
-
github.com github.com
-
Viechtbauer, W. (2020). Wviechtb/forest_emojis [R]. https://github.com/wviechtb/forest_emojis (Original work published 2020)
-
- Aug 2020
-
www.thelancet.com www.thelancet.com
-
Kretzschmar, M. E., Rozhnova, G., Bootsma, M. C. J., Boven, M. van, Wijgert, J. H. H. M. van de, & Bonten, M. J. M. (2020). Impact of delays on effectiveness of contact tracing strategies for COVID-19: A modelling study. The Lancet Public Health, 5(8), e452–e459. https://doi.org/10.1016/S2468-2667(20)30157-2
-
-
www.nature.com www.nature.com
-
Adam, D. (2020). A guide to R — the pandemic’s misunderstood metric. Nature. https://doi.org/10.1038/d41586-020-02009-w
-
-
www.medrxiv.org www.medrxiv.org
-
Starnini, M., Aleta, A., Tizzoni, M., & Moreno, Y. (2020). Impact of the accuracy of case-based surveillance data on the estimation of time-varying reproduction numbers. MedRxiv, 2020.06.26.20140871. https://doi.org/10.1101/2020.06.26.20140871
-
-
www.newscientist.com www.newscientist.com
-
Wilson, C. (n.d.). First coronavirus R numbers for regions within England released. New Scientist. Retrieved June 15, 2020, from https://www.newscientist.com/article/2246029-first-coronavirus-r-numbers-for-regions-within-england-released/
-
-
uxplanet.org uxplanet.org
-
-
Farboodi, M., Jarosch, G., & Shimer, R. (2020). Internal and External Effects of Social Distancing in a Pandemic (Working Paper No. 27059; Working Paper Series). National Bureau of Economic Research. https://doi.org/10.3386/w27059
-
- Jul 2020
-
walker-data.com walker-data.com
-
Working with Census microdata. (n.d.). Retrieved July 31, 2020, from https://walker-data.com/tidycensus/articles/pums-data.html
-
-
osf.io osf.io
-
Holcombe, A. O., Kovacs, M., Aust, F., & Aczel, B. (2020). Tenzing: Documenting contributorship using CRediT [Preprint]. MetaArXiv. https://doi.org/10.31222/osf.io/b6ywe
-
-
www.theguardian.com www.theguardian.com
-
Spiegelhalter, D. (2020, July 5). Risks, R numbers and raw data: How to interpret coronavirus statistics. The Observer. https://www.theguardian.com/world/2020/jul/05/risks-r-numbers-and-raw-data-how-to-interpret-coronavirus-statistics
-
-
www.newscientist.com www.newscientist.com
-
Liverpool, C. W., Jessica Hamzelou, Adam Vaughan, Conrad Quilty-Harper and Layal. (n.d.). Covid-19 news: Almost 20,000 care home deaths in England and Wales. New Scientist. Retrieved July 6, 2020, from https://www.newscientist.com/article/2237475-covid-19-news-almost-20000-care-home-deaths-in-england-and-wales/
-
-
jasp-stats.org jasp-stats.org
-
Introducing JASP 0.13. (2020, July 2). JASP - Free and User-Friendly Statistical Software. https://jasp-stats.org/?p=6483
-
-
-
Du, H., Jiang, G., & Ke, Z. (2020). A Bootstrap Based Between-Study Heterogeneity Test in Meta-Analysis [Preprint]. PsyArXiv. https://doi.org/10.31234/osf.io/de4g9
-
- Jun 2020
-
twitter.com twitter.com
-
Matthias #WashYourHands Egger on Twitter: “The effective reproduction number Re is now above 1 in #Switzerland: 1.28 (95% 1.06-1.53). We urgently need an in-depth understanding of transmission dynamics, the effectiveness of contact tracing etc. And #MaskUp https://t.co/24E5o4jYiS” / Twitter. (n.d.). Twitter. Retrieved June 30, 2020, from https://twitter.com/eggersnsf/status/1276882802173247490
-
-
rss.onlinelibrary.wiley.com rss.onlinelibrary.wiley.com
-
Mathur, M. B., & VanderWeele, T. J. (2020). New statistical metrics for multisite replication projects. Journal of the Royal Statistical Society: Series A (Statistics in Society), 183(3), 1145–1166. https://doi.org/10.1111/rssa.12572
-
-
www.newscientist.com www.newscientist.comR number1
-
Vaughan, A. (n.d.). R number. New Scientist. Retrieved June 29, 2020, from https://www.newscientist.com/term/r-number/
-
-
learn-us-east-1-prod-fleet01-xythos.s3.amazonaws.com learn-us-east-1-prod-fleet01-xythos.s3.amazonaws.com
-
For example, some have de-manded that furries “yiff [derogatory furry term for sexual intercourse] in hell, furfag” (Brookey & Cannon, 2009, p. 159).
See r/yiffinhell on Reddit.
-
-
-
Privacy Preserving Data Analysis of Personal Data (May 27, 2020). (n.d.). Retrieved June 25, 2020, from https://www.youtube.com/watch?time_continue=11&v=wRI84xP0cVw&feature=emb_logo
-
-
psyarxiv.com psyarxiv.com
-
Maier, M., Bartoš, F., & Wagenmakers, E.-J. (2020). Robust Bayesian Meta-Analysis: Addressing Publication Bias with Model-Averaging [Preprint]. PsyArXiv. https://doi.org/10.31234/osf.io/u4cns
-
-
-
Coronavirus: R number jumps to 1.79 in Germany after abattoir outbreak. (n.d.). Sky News. Retrieved June 22, 2020, from https://news.sky.com/story/coronavirus-r-number-jumps-to-1-79-in-germany-after-abattoir-outbreak-12011468
-
-
media-exp1.licdn.com media-exp1.licdn.com
-
How to prevent the environment from being “invalidated”?Docker containers (Rocker)
Rocker
-
SAS, R, Stata, SPSS may return different results even for quantiles, or due to floating number representation! The results should be maximally close to each other, but what about resampling methods (SAS and R gives different random numbers for the same seed)?
Different results between SAS, R, Stata, SPSS
-
99.9% open-source. 0.1% is licensed (free for non-commercial use)
License of libraries in R
-
Status of R on the Clinical Research market
- In general bioscience and academia, S ---> R has built over years its position of one of the industry standards
- In clinical research, however, SAS reigns par excellence
- Pharmaceutical companies, CROs and even FDA do use R “internally”.But they resist (or hesitate) to use it in submissions (to FDA)
- Clinical Programmer or Biostatistician ≝ SAS Programmer. Period
-
Differences in
Differences between R and SAS:
- origin of dates
- default contrasts
- used sum of squares
- calculation of quantiles
- generation of random numbers
- implementation of advanced model
- representation of floating point numbers
-
Tospeeduptheprocesswithoutsacrificingaccuracy,theteamalsousesRevolutionRanalyticproducts
Revolution R
-
-
twitter.com twitter.com
-
Hironori Funabiki on Twitter
-
-
doi.org doi.org
-
Willem, L., Hoang, T. V., Funk, S., Coletti, P., Beutels, P., & Hens, N. (2020). SOCRATES: An online tool leveraging a social contact data sharing initiative to assess mitigation strategies for COVID-19 [Preprint]. Epidemiology. https://doi.org/10.1101/2020.03.03.20030627
-
-
www.r-bloggers.com www.r-bloggers.com
-
Dablander, F. (2020, June 11). Interactive exploration of COVID-19 exit strategies. R-Bloggers. https://www.r-bloggers.com/interactive-exploration-of-covid-19-exit-strategies/
-
-
exts.ggplot2.tidyverse.org exts.ggplot2.tidyverse.org
-
Ggplot2 extensions. (n.d.). Retrieved June 14, 2020, from https://exts.ggplot2.tidyverse.org/
-
-
rviews.rstudio.com rviews.rstudio.com
-
Views, R. (2020, May 20). An R View into Epidemiology. /2020/05/20/some-r-resources-for-epidemiology/
-
-
adv-r.had.co.nz adv-r.had.co.nz
-
In most programming languages, you can only access the values of a function’s arguments. In R, you can also access the code used to compute them. This makes it possible to evaluate code in non-standard ways: to use what is known as non-standard evaluation
Tags
Annotators
URL
-
-
textnets.readthedocs.io textnets.readthedocs.io
-
Bail, C. A. (2016). Combining natural language processing and network analysis to examine how advocacy organizations stimulate conversation on social media. Proceedings of the National Academy of Sciences, 113(42), 11823–11828. https://doi.org/10.1073/pnas.1607151113
-
-
journals.sagepub.com journals.sagepub.com
-
Rosenbusch, H., Hilbert, L. P., Evans, A. M., & Zeelenberg, M. (2020). StatBreak: Identifying “Lucky” Data Points Through Genetic Algorithms. Advances in Methods and Practices in Psychological Science, 2515245920917950. https://doi.org/10.1177/2515245920917950
-
- May 2020
-
psyarxiv.com psyarxiv.com
-
Peikert, A., & Brandmaier, A. M. (2019). A Reproducible Data Analysis Workflow with R Markdown, Git, Make, and Docker. https://doi.org/10.31234/osf.io/8xzqy
-
-
www.preprints.org www.preprints.org
-
Samuel, J.; Ali, G.G.M.N.; Rahman, M.M.; Esawi, E.; Samuel, Y. COVID-19 Public Sentiment Insights and Machine Learning for Tweets Classification. Preprints 2020, 2020050015 (doi: 10.20944/preprints202005.0015.v1)
-
-
www.theguardian.com www.theguardian.com
-
Davis, N. (2020, May 4). Rival Sage group says Covid-19 policy must be clarified. The Guardian. https://www.theguardian.com/world/2020/may/04/rival-sage-group-covid-19-policy-clarified-david-king
-
-
www.accuweather.com www.accuweather.com
-
Puleo, M., & Staff Writer (2020 March 18). New study says “high temperature and high relative humidity significantly reduce” spread of COVID-19. https://www.accuweather.com/en/health-wellness/new-study-says-high-temperature-and-high-relative-humidity-significantly-reduce-spread-of-covid-19/703418
Tags
- weather
- humidity
- spread
- transmission reduction
- R
- lang:en
- temperature
- is:news
- COVID-19
- effective reproduction number
Annotators
URL
-
-
www.thelancet.com www.thelancet.com
-
Liu, Y., Eggo, R. M., & Kucharski, A. J. (2020). Secondary attack rate and superspreading events for SARS-CoV-2. The Lancet, 395(10227), e47. https://doi.org/10.1016/S0140-6736(20)30462-1
-
-
wellcomeopenresearch.org wellcomeopenresearch.org
-
Endo, A., Centre for the Mathematical Modelling of Infectious Diseases COVID-19 Working Group, Abbott, S., Kucharski, A. J., & Funk, S. (2020). Estimating the overdispersion in COVID-19 transmission using outbreak sizes outside China. Wellcome Open Research, 5, 67. https://doi.org/10.12688/wellcomeopenres.15842.1
-
-
twitter.com twitter.com
-
Carl T. Bergstrom on Twitter
-
-
whatisr.uk whatisr.uk
-
R today - UK
Tags
Annotators
URL
-
-
sfi-edu.s3.amazonaws.com sfi-edu.s3.amazonaws.com
-
The Santa Fe Institute - SFI Transmission PDF
-
-
www.ncbi.nlm.nih.gov www.ncbi.nlm.nih.gov
-
Bi, Q., Wu, Y., Mei, S., Ye, C., Zou, X., Zhang, Z., Liu, X., Wei, L., Truelove, S. A., Zhang, T., Gao, W., Cheng, C., Tang, X., Wu, X., Wu, Y., Sun, B., Huang, S., Sun, Y., Zhang, J., … Feng, T. (2020). Epidemiology and transmission of COVID-19 in 391 cases and 1286 of their close contacts in Shenzhen, China: A retrospective cohort study. The Lancet Infectious Diseases, S1473309920302875. https://doi.org/10.1016/S1473-3099(20)30287-5
-
-
www.estimationstats.com www.estimationstats.com
-
You can create estimation plots here at estimationstats.com, or with the DABEST packages which are available in R, Python, and Matlab.
You can create estimation plots with:
Tags
Annotators
URL
-
-
easystats.github.io easystats.github.io
-
github.com github.com
-
McElreath, R. Statistical Rethinking: A Bayesian Course Using R and Stan Github.com. https://github.com/rmcelreath/statrethinking_winter2019
Entire course with materials online.
-
- Apr 2020
-
blog.revolutionanalytics.com blog.revolutionanalytics.com
-
R 4.0.0 now available, and a look back at R’s history. (n.d.). Revolutions. Retrieved April 30, 2020, from https://blog.revolutionanalytics.com/2020/04/r-400-is-released.html
-
-
emljames.github.io emljames.github.io
-
James, E. Tutorial Home. Github.io. https://emljames.github.io/GorillaR/
-
-
www.r-bloggers.com www.r-bloggers.com
-
Multilevel correlations: A new method for common problems. (2020 April 13). R-bloggers. https://www.r-bloggers.com/multilevel-correlations-a-new-method-for-common-problems/
-
-
github.com github.com
-
Petermr/openVirus. (n.d.). GitHub. Retrieved April 8, 2020, from https://github.com/petermr/openVirus
-
-
www.linkedin.com www.linkedin.comLinkedIn2
-
Pharma, which is one of the biggest, richest, most rewarding and promising industries in the world. Especially now, when the pharmaceutical industry, including the FDA, allows R to be used the domain occupied in 110% by SAS.
Pharma industry is one of the most rewarding industries, especially now
-
CR is one of the most controlled industries in this world. It's insanely conservative in both used statistical methods and programming. Once a program is written and validated, it may be used for decades. There are SAS macros written in 1980 working still by today without any change. That's because of brilliant backward compatibility of the SAS macro-language. New features DO NOT cause the old mechanisms to be REMOVED. It's here FOREVER+1 day.
Clinical Research is highly conservative, making SAS macros applicable for decades. Unfortunately, that's not the same case with R
-
- Mar 2020
-
rviews.rstudio.com rviews.rstudio.com
-
Thanks to ggforce, you can enhance almost any ggplot by highlighting data groupings, and focusing attention on interesting features of the plot
Tags
Annotators
URL
-
-
utstat.toronto.edu utstat.toronto.edu
-
2.6 The Normal Distribution
The normal distribution in r
-
-
bookdown.org bookdown.org
-
Generating random data
Generating random data in r
-
-
www.statmethods.net www.statmethods.net
-
Descriptive Statistic
R provides a wide range of functions for obtaining summary statistics. One method of obtaining descriptive statistics is to use the sapply( ) function with a specified summary statistic.
Tags
Annotators
URL
-
-
-
dplyr in R also lets you use a different syntax for querying SQL databases like Postgres, MySQL and SQLite, which is also in a more logical order
-
-
towardsdatascience.com towardsdatascience.com
-
We save all of this code, the ui object, the server function, and the call to the shinyApp function, in an R script called app.R
The same basic structure for all Shiny apps:
uiobject.serverfunction.- call to the
shinyAppfunction.
---> examples <---
-
ui
UI example of a Shiny app (check the code below)
-
server
Server example of a Shiny app (check the code below):
- random distribution is plotted as a histogram with the requested number of bins
- code that generates the plot is wrapped in a call to
renderPlot
-
I want to get the selected number of bins from the slider and pass that number into a python method and do some calculation/manipulation (return: “You have selected 30bins and I came from a Python Function”) inside of it then return some value back to my R Shiny dashboard and view that result in a text field.
Using Python scripts inside R Shiny (in 6 steps):
- In ui.R create textOutput:
textOutput("textOutput")(afterplotoutput()). - In server.R create handler:
output$textOutput <- renderText({
}]
. - Create python_ref.py and insert this code:

- Import reticulate library:
library(reticulate). source_python()function will make Python available in R: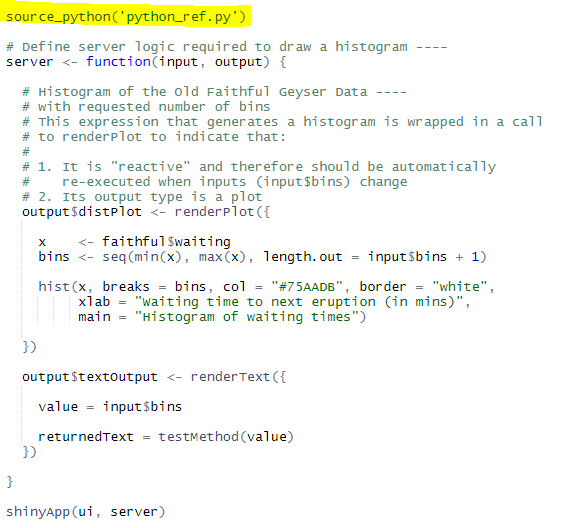
- Make sure you've these files in your directory:
- app.R
- python_ref.py
and that you've imported the
reticulatepackage to R Environment and sourced the script inside your R code.
Hit run.
- In ui.R create textOutput:
-
Currently Shiny is far more mature than Dash. Dash doesn’t have a proper layout tool yet, and also not build in theme, so if you are not familiar with Html and CSS, your application will not look good (You must have some level of web development knowledge). Also, developing new components will need ReactJS knowledge, which has a steep learning curve.
Shiny > Dash:
- Dash isn't yet as stabilised
- Shiny has much more layout options, whereas in Dash you need to utilise HTML and CSS
- developing new components in Dash needs ReactJS knowledge (not so easy)
-
You can host standalone apps on a webpage or embed them in R Markdown documents or build dashboards. You can also extend your Shiny apps with CSS themes, Html widgets, and JavaScript actions.
Typical tools used for working with Shiny
-
You can either create a one R file named app.R and create two seperate components called (ui and server inside that file) or create two R files named ui.R and server.R

-
- Feb 2020
-
declaredesign.org declaredesign.org
-
hec <- within(hec,{
why does he use 'within' rather than mutate?
-
- Dec 2019
-
medium.com medium.comtayloR1
-
“A measure from 0.0 to 1.0 describing the musical positiveness conveyed by a track. Tracks with high valence sound more positive (e.g. happy, cheerful, euphoric), while tracks with low valence sound more negative (e.g. sad, depressed, angry).”
What is valence in music according to Spotify?
Tags
Annotators
URL
-
- Nov 2019
-
dplyr.tidyverse.org dplyr.tidyverse.org
-
enquo() uses some dark magic to look at the argument, see what the user typed, and return that value as a quosure
-
- Oct 2019
-
drive.google.com drive.google.com
-
neka nota nesto ovdje ima da se doda
-
- Jun 2019
-
varsellcm.r-forge.r-project.org varsellcm.r-forge.r-project.org
-
missing values are managed, without any pre-processing, by the model used to cluster with the assumption that values are missing completely at random.
VarSelLCMpackage
-
- May 2019
-
-
Some of the best and cheapest tombstones come from India. In 2013 India produced 35,342 million tons of granite, making it the world’s largest producer
This is interesting to me because I guess I never really thought about where the tombstones came from, I just knew that they came engaved and i never thought about who had to do it
-
- Apr 2019
-
ker-thiossane.org ker-thiossane.org
-
-
www.contemporaryand.com www.contemporaryand.com
Tags
Annotators
URL
-
-
instituteofimpossiblesubjectsblog.wordpress.com instituteofimpossiblesubjectsblog.wordpress.com
Tags
Annotators
URL
-
-
www.centerartsdesign.org www.centerartsdesign.org
-
www.fracturedatlas.org www.fracturedatlas.org
Tags
Annotators
URL
-
- Feb 2019
-
methods-sagepub-com.ezp1.lib.umn.edu methods-sagepub-com.ezp1.lib.umn.edu
-
Network centralization
degree.cent <- centr_degree(g, mode = "all") degree.cent$res degree.cent$centralization degree.cent$theoretical_max
-
- Dec 2018
-
journal.r-project.org journal.r-project.org
-
I came across this via the cran.r-project, referred to be a computer scientist at an NIH lecture. It might be an interesting source to see code-sharing norms and practices.
-
- Sep 2018
-
www.ncbi.nlm.nih.gov www.ncbi.nlm.nih.gov
-
Differential analyses for RNA-seq: transcript-level estimates improve gene-level inferences
-
- May 2018
-
hypothes.is hypothes.is
-
hi there please check on the Recent Updated SAS Training and Tutorial Course which can explain about the SAS and its integration with the R as well so please go through the Link:-
Tags
Annotators
URL
-
- Mar 2018
-
zevross.com zevross.com
-
Beautiful plotting in R: A ggplot2 cheatsheet
-
-
www.r-bloggers.com www.r-bloggers.com
-
Boxplots and Beyond – Part II: Asymmetry
-
-
eurekastatistics.com eurekastatistics.com
-
Using the Median Absolute Deviation to Find Outliers
-
-
stackoverflow.com stackoverflow.com
-
Using foo:::f instead of foo::f allows access to unexported objects.
-
- Feb 2018
-
www.jstor.org www.jstor.org
-
In the six states that prohibit ex-felons from voting, one in four African-American men is permanently disenfranchised.
-
-
support.rstudio.com support.rstudio.com
-
Shiny Server: Running with a Proxy
-
-
shiny.rstudio.com shiny.rstudio.com
-
The host parameter was introduced in Shiny 0.9.0.
-
- Jan 2018
-
literature-proquest-com.proxyau.wrlc.org literature-proquest-com.proxyau.wrlc.org
-
toxic waste, poison air, beach goo, eroded 215 roads draw nations together
Robert Frosts, Mending Wall
-
-
-
高齡
-
- Dec 2017
-
github.com github.com
-
Updated annotation.
Tags
Annotators
URL
-
- Nov 2017
-
rafalab.github.io rafalab.github.ioharvardx1
-
HarvardX Biomedical Data Science Open Online Training
-
- Oct 2017
-
www.ncbi.nlm.nih.gov www.ncbi.nlm.nih.gov
-
argyle: An R Package for Analysis of Illumina Genotyping Arrays
-
- Aug 2017
-
github.com github.com
-
Updated annotation.
Tags
Annotators
URL
-
- Jul 2017
-
www.edx.org www.edx.org
-
Introduction to R for Data Science
Data analysis course using R
-
-
www.datacamp.com www.datacamp.com
-
Learn Data Science Online
Data analysis courses using R and Python
Tags
Annotators
URL
-
- Jun 2017
-
-
Teaching Yourself to Code in DH
Tags
Annotators
URL
-
-
github.com github.com
-
The Automated R Instructor
Tags
Annotators
URL
-
-
www.soultrainonline.de www.soultrainonline.de
-
-
www.soultrainonline.de www.soultrainonline.de
-
-
www.soultrainonline.de www.soultrainonline.de
-
- May 2017
-
nfnh2017.scholar.bucknell.edu nfnh2017.scholar.bucknell.edu
-
National Research Council
The National Research Council (NRC) is an organization within the Government of Canada dedicated to research and development. Today, the NRC works with members of the Canadian industry to provide meaningful research and development for many different types of products. The areas of research and development that the NRC participates in include aerospace, aquatic and crop resource development, automotive and surface transportation, construction, energy, mining, and environment, human health therapeutics, information and communications technologies, measurement science standards, medical devices, astronomy and astrophysics, ocean, coastal, and river engineering, and security and disruptive technologies. The NRC employs scientists, engineers, and business experts. The mission of the NRC is as follows: “Working with clients and partners, we provide innovation support, strategic research, scientific and technical services to develop and deploy solutions to meet Canada's current and future industrial and societal needs.” The main values of the NRC include impact, accountability, leadership, integrity, and collaboration. The most recent success stories of the NRC include research regarding “green buildings,” math games, mechanical insulation, and many more (Government of Canada 2017). Here is a link to their achievement page where these stories and more are posted: http://www.nrc-cnrc.gc.ca/eng/achievements/index.html. Here is a link to the NRC webpage: http://www.nrc-cnrc.gc.ca/eng/index.html.References
Government of Canada. 2017. National Research Council Canada. May 5. Accessed May 8, 2017. http://www.nrc-cnrc.gc.ca/eng/index.html.
-
- Feb 2017
-
methods-sagepub-com.ezp1.lib.umn.edu methods-sagepub-com.ezp1.lib.umn.edu
-
Reciprocity
This one was easy! Getting good a good directed network to play around with it with into R and able to be modified was... way harder than getting this info.
reciprocity(g, ignore.loops = TRUE)
There is an additional mode operator where if you put the mode = ("ratio") it calculates (unordered) vertex pairs are classified into three groups: (1) not-connected, (2) non-reciprocaly connected, (3) reciprocally connected. The result is the size of group (3), divided by the sum of group sizes (2)+(3).
-
Centralization
Centralization interests me for analyzing discussion forums--are there key players, and do these key players show higher degrees of cognitive presence?
Calculating for centralization by number of connections seems quite straightforward in R: centralization.degree
-
Clustering
I am very interested in clustering measures, because I plan to analyze data from a Slack group that I am a part of, where I suspect there are many subgroups who only interact with each other.
After looking around for some different clustering algorithms, I found the "cluster_label_prop" function in the igraph package, which seems to do what I would like to do. To summarize, this function automatically detects groups within a network by initially labeling every node with a unique label and at every step each node adopts the label that most of its neighbors currently have. In this iterative process densely connected groups of nodes form a consensus on a unique label to form communities.
There seem to be many different ways to define clustering though, so I am sure that I will need to do more research on the topic of clustering as I move forward with my research project.
-
-
lti.hypothesislabs.com lti.hypothesislabs.com
-
the last rain
repeats "last rain" telling the reader there is a drought
-
-
bookdown.org bookdown.org
-
See http://kateto.net/network-visualization↩
This is incredible! Thank you for sharing this link.
-
-
lti.hypothesislabs.com lti.hypothesislabs.com
-
THE WESTERN LAND, nervous under the beginning change. The Western States, nervous as horses before a thunder storm
Steinbeck groups the Western states together in one entity that feels and experiences the same nervous energy, like that of horses. The repetition of this idea throughout Ch. 14 serves to underscore the unity of these states as a single group separate and distinct from the rest of the country.
-
-
www.insidehighered.com www.insidehighered.com
-
Despite many editors being unpaid or poorly remunerated for their work, plant scientist Jaime A. Teixeira da Silva believes they “should be held accountable” if authors are made to wait for an “excessive or unreasonable amount of time” before a decision is made on their research.
How would this be enforced exactly?
-
-
blogs.nature.com blogs.nature.com
-
The crawler represented a third option: a way to figure out how humans work.
Good way to look at it.
-
- Jan 2017
-
www.spectator.co.uk www.spectator.co.uk
-
marine species that calcify have survived through millions of years when CO2 was at much higher levels
Some calcifying species were indeed abundant in the Cretaceous, a time at which the atmospheric CO2 concentration was high. However, seawater alkalinity was also high due to intense weathering on land. Hence, the concentration of carbonate ions (CO3, which controls calcification) was elevated. That compensation does not happen today and will not happen in the near future because total alkalinity does not change significantly on time scales of centuries. There is ample evidence in the literature for that.
-
- Jun 2016
-
github.com github.com
-
R made me!
Tags
Annotators
URL
-
- Mar 2016
-
-
Ensures that vital information is provided to educators, families, students, and communities through annual statewide assessments that measure students' progress toward those high standards.
Naturally, not every student is capable of reaching those high standards but, ability based grouping will help those students reach those standards.
-
- Feb 2016
-
uoitonlinetech.wordpress.com uoitonlinetech.wordpress.com
-
When students are grouped by ability, then collaborative work becomes important because this type of learning environment is heavily dependent on team work.
This prevents the one or two "smart" students in the group from doing all the work because all the students are on the same academic level.
-
Students can move at their own pace: When students are grouped together based on skill level, the pressure is lessened of when the topic must be covered.
This is probably the most apparent benefit to ability based grouping.
-
-
www.nea.org www.nea.org
-
Between-class grouping - a school's practice of separating students into different classes, courses, or course sequences (curricular tracks) based on their academic achievement
This is how i envision the education system should look.
-
Within-class grouping - a teacher's practice of putting students of similar ability into small groups usually for reading or math instruction
-
Proponents of ability grouping say that the practice allows teachers to tailor the pace and content of instruction much better to students' needs and, thus, improve student achievement.
-
- Dec 2015
-
www.politico.com www.politico.com
-
Considered by the beef industry to be an impressive innovation, lean finely textured beef is made from the remnant scraps of cattle carcasses that were once deemed too fatty to go into human food.
The textured beef is made of just scraps and waste that was not going to be put into food.
-
- Aug 2015
-
stackoverflow.com stackoverflow.com
-
R Grouping functions: sapply vs. lapply vs. apply. vs. tapply vs. by vs. aggregate var ados = ados || {}; ados.run = ados.run || []; ados.run.push(function () { ados_add_placement(22,8277,"adzerk794974851",4).setZone(43); }); up vote 463 down vote favorite 606 Whenever I want to do something "map"py in R, I usually try to use a function in the apply family. (Side question: I still haven't learned plyr or reshape -- would plyr or reshape replace all of these entirely?) However, I've never quite understood the differences between them [how {sapply, lapply, etc.} apply the function to the input/grouped input, what the output will look like, or even what the input can be], so I often just go through them all until I get what I want. Can someone explain how to use which one when? [My current (probably incorrect/incomplete) understanding is... sapply(vec, f): input is a vector. output is a vector/matrix, where element i is f(vec[i]) [giving you a matrix if f has a multi-element output] lapply(vec, f): same as sapply, but output is a list? apply(matrix, 1/2, f): input is a matrix. output is a vector, where element i is f(row/col i of the matrix) tapply(vector, grouping, f): output is a matrix/array, where an element in the matrix/array is the value of f at a grouping g of the vector, and g gets pushed to the row/col names by(dataframe, grouping, f): let g be a grouping. apply f to each column of the group/dataframe. pretty print the grouping and the value of f at each column. aggregate(matrix, grouping, f): similar to by, but instead of pretty printing the output, aggregate sticks everything into a dataframe.] r sapply tapply r-faq
very useful article on apply functions in r
-
- Jun 2015
-
espin086.wordpress.com espin086.wordpress.com
-
download and install the ACS package in addition to going to requesting a secret key
Troubleshooting csv file - step 1.
-
- Jan 2015
-
www.ats.ucla.edu www.ats.ucla.edu
-
R requires forward slashes (/) not back slashes (\) when specifying a file location even if the file is on your hard drive.
-