136 Matching Annotations
  1. Jul 2025
  2. Feb 2025
  3. Jan 2025
  4. Dec 2024
  5. Aug 2024
    1. SPOC withground truth detection (provided by the simulator) shows15% absolute average success rate gain across all taskson CHORES-S and an even larger 24.5% absolute gain onCHORES-L where the detection problem is harder due tothe larger object vocabulary.

      comparing SPOC with detector and without

    2. Whentrained jointly on four tasks – Object-Goal Navigation(OBJNAV), Room Visitation (ROOMVISIT), PickUp Object(PICKUP), and Fetch Object (FETCH) – SPOC achieves animpressive average success rate of 49.9% in unseen sim-ulation environments at test time.

      succes rate at simulation - 50 %

  6. Jul 2024
    1. If warming reaches or exceeds 2 °C this century, mainly richer humans will be responsible for killing roughly 1 billion mainly poorer humans through anthropogenic global warming, which is comparable with involuntary or negligent manslaughter.

      for - quote - exceeding 2 Deg C may result in a billion deaths - Joshua Pearce

      quote - exceeding 2 Deg C may result in a billion deaths - Joshua Pearce - (see below) - If warming reaches or exceeds 2 °C this century, - mainly richer humans will be responsible for killing roughly 1 billion mainly poorer humans - through anthropogenic global warming, - which is comparable with involuntary or negligent manslaughter.

  7. Sep 2023
  8. Aug 2022
  9. Apr 2022
  10. Mar 2022
  11. Feb 2022
    1. Indeed, the Jose-phinian card index owes its continued use to the failure to achieve a bound

      catalog, until a successor card catalog comes along in 1848. Only the<br /> absence of a bound repertory allows the paper slip aggregate to answer all inquiries about a book ’ s whereabouts after 1781. Thus, a failed undertaking tacitly turns into a success story.

      The Josephinian card index was created, in part on the ideas of Konrad Gessner's slip method, by accumulating slips which could be rearranged and then copied down permanently. While there was the chance that the original cards could be disordered, the fact that the approximately 300,000 cards in 205 small boxes were estimated to fill 50 to 60 folio volumes with time and expense to print it dissuaded the creation of a long desired compiled book of books. These problems along with the fact that new books being added later was sure to only compound problems of having a single reference. This failure to have a bound catalog of books unwittingly resulted in the success of the index card catalog.

  12. Jan 2022
    1. The Business Strategy stems from a detailed strategic planning process. However, the question we want to answer in this article is whether we can execute multiple strategies side by side while they do not interfere with each other. We compare multiple strategies for business, information provision and IT and focus on Strategic planning.

      Business strategy alignment and the secrets of strategic planning https://en.itpedia.nl/2022/01/02/business-strategie-alignment-en-de-geheimen-van-strategische-planning/ The Business Strategy stems from a detailed strategic planning process. However, the question we want to answer in this article is whether we can execute multiple strategies side by side while they do not interfere with each other. We compare multiple strategies for business, information provision and IT and focus on Strategic planning.

  13. Dec 2021
    1. The possibility of arbitrary internal branching.

      Modern digital zettelkasten don't force the same sort of digital internal branching process that is described by Niklas Luhmann. Internal branching in these contexts is wholly reliant on the user to create it.

      Many digital systems will create a concrete identifier to fix the idea within the system, but this runs the risk of ending up with a useless scrap heap.

      Some modern systems provide the ability for one to add taxonomies like subject headings in a commonplace book tradition, which adds some level of linking. But if we take the fact that well interlinked cards are the most valuable in such a system then creating several links upfront may be a bit more work, but it provides more value in the long run.

      Upfront links also don't require quite as much work at the card's initial creation as the creator already has the broader context of the idea. Creating links at a future date requires the reloading into their working memory of the card's idea and broader context.

      Of course there may also be side benefits (including to memory) brought by the spaced repetition of the card's ideas as well as potential new contexts gained in the interim which may help add previously unconsidered links.

      It can certainly be possible that at some level of linking, there is a law of diminishing returns the decreases the value of a card and its idea.

      One of the benefits of physical card systems like Luhmann's is that the user is forced to add the card somewhere, thus making the first link of the idea into the system. Luhmann's system in particular creates a parent/sibling relation to other cards or starts a brand new branch.

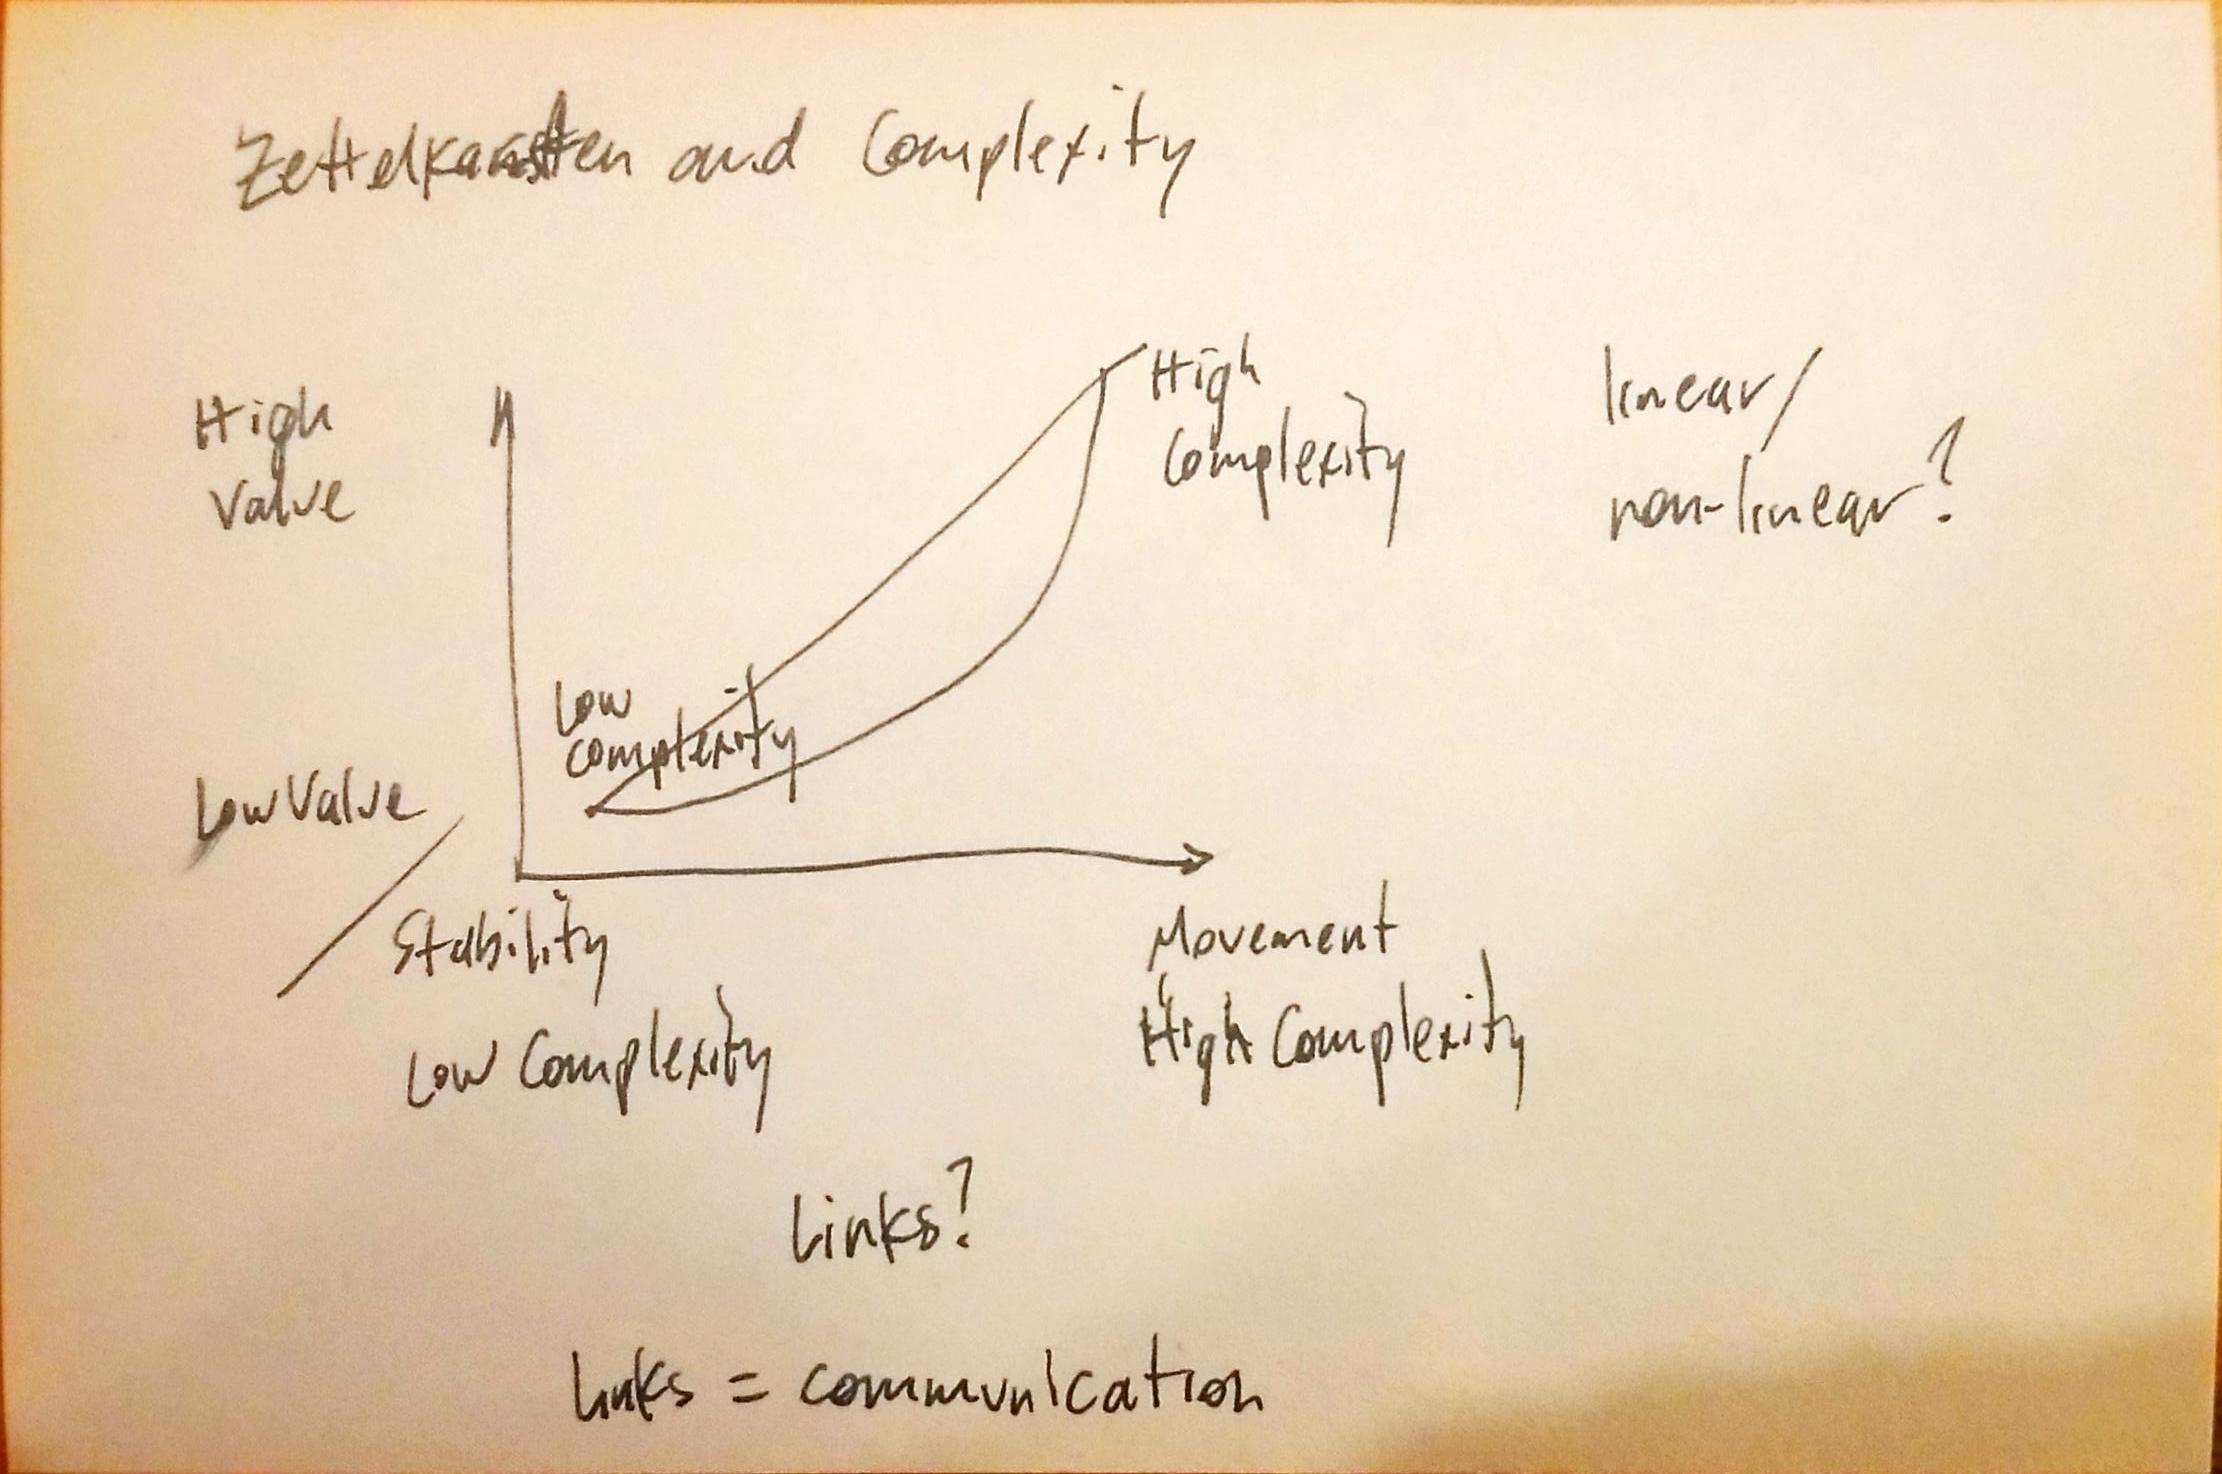
    2. The fixed filing place needs no system. It is sufficient that we give every slip a number which is easily seen (in or case on the left of the first line) and that we never change this number and thus the fixed place of the slip. This decision about structure is that reduction of the complexity of possible arrangements, which makes possible the creation of high complexity in the card file and thus makes possible its ability to communicate in the first place.

      There's an interesting analogy between Niklas Luhmann's zettelkasten numbering system and the early street address system in Vienna. Just as people (often) have a fixed address, they're able to leave it temporarily and mix with other people before going back home every night. The same is true with his index cards. Without the ability to remove cards and remix them in various orders, the system has far less complexity and simultaneously far less value.

      Link to reference of street addressing systems of Vienna quoted by Markus Krajewski in (chapter 3 of) Paper Machines.


      Both the stability and the occasional complexity of the system give it tremendous value.

      How is this linked to the idea that some of the most interesting things within systems happen at the edges of the system which have the most complexity? Cards that sit idly have less value for their stability while cards at the edges that move around the most and interact with other cards and ideas provide the most value.

      Graph this out on a multi-axis drawing. Is the relationship linear, non-linear, exponential? What is the relationship of this movement to the links between cards? Is it essentially the same (particularly in digital settings) as movement?

      Are links (and the active creation thereof) between cards the equivalent of communication?

  14. Jul 2021
  15. Jun 2021
  16. May 2021
    1. David Benkeser. (2020, November 9). Another view on uncertainty associated based on Pfizer’s results. Even if you were highly skeptical about MRNA vaccines (many are [were?]) with 50% prior belief that VE ~ 0, based on an 8:86 vax:placebo case split, the posterior probability that VE > 75% is ~ 1. Https://t.co/xtBONtGHmT [Tweet]. @biosbenk. https://twitter.com/biosbenk/status/1325856366225993729

  17. Mar 2021
  18. Feb 2021
    1. Using a terminus to indicate a certain outcome - in turn - allows for much stronger interfaces across nested activities and less guessing! For example, in the new endpoint gem, the not_found terminus is then wired to a special “404 track” that handles the case of “model not found”. The beautiful thing here is: there is no guessing by inspecting ctx[:model] or the like - the not_found end has only one meaning!
  19. Jan 2021
    1. Sadoff, J., Le Gars, M., Shukarev, G., Heerwegh, D., Truyers, C., de Groot, A. M., Stoop, J., Tete, S., Van Damme, W., Leroux-Roels, I., Berghmans, P.-J., Kimmel, M., Van Damme, P., de Hoon, J., Smith, W., Stephenson, K. E., De Rosa, S. C., Cohen, K. W., McElrath, M. J., … Schuitemaker, H. (2021). Interim Results of a Phase 1–2a Trial of Ad26.COV2.S Covid-19 Vaccine. New England Journal of Medicine, 0(0), null. https://doi.org/10.1056/NEJMoa2034201

  20. Oct 2020
  21. Sep 2020
  22. Jul 2020
  23. Jun 2020
  24. May 2020
  25. Apr 2020
    1. Bacteria will then begin to exhibit phenotypic and genotypic plurality: the former allows bacteria to adapt to different growth conditions such as nutrient availability, pH, and oxidizing potential within the biofilm, while the latter allows for virulence and bacterial resistance to drugs.
  26. Mar 2020
  27. Oct 2018
    1. mpulsive agresive behavior may have a different neurophysiological corelates and therefore from the clinical and forensic point of view represent a totally different category from non-impulsive aggressive behavior.
    2. significantly higher occurrence of specific and non-specific EEG changes in offenders of violent criminal activity evaluated as impulsive, non-deliberate, affectively motivated and affectively aggressive
    3. 70% of subjects show an EEG abnormality and multiple abnormalities were found in 35%. Non-impulsive delinquents still show higher rate of EEG abnormalities incidence - 30% and multiple abnormalities in 5%. Other groups – thefts and control group show no significant EEG changes.
    1. Subjects with both traumatic and neurodegen-erative disorders primarily involving the pre-frontal cortex display increased rates of aggres-sive and antisocial behaviour compared withsubjects who have no, or non-frontal braininjury. Studies employing neuropsychologicaltesting, neurological examination, EEG, andneuroimaging have also tended to find evi-dence for increased rates of prefrontal networkdysfunction among aggressive and antisocialsubjects. Prefrontal network dysfunction seemsto be most specifically associated with a recur-rent, impulsive subtype of aggression that maycontribute to some violent behaviour.

      summary of results

    2. The reportedreductions in prefrontal size or activity may,therefore, represent a predisposition to aVec-tive states relevant to aggressive behaviour,without necessarily signifying an incapacity toavoid actual violent acts.
    3. patients with personality disorders(chiefly antisocial, borderline, and narcissistic)showed decreased anterior medial and leftanterior orbitofrontal metabolism, which cor-related with increased scores on a self reportedaggression scale
    4. patientswith aggressive dementia with the same degreeof cognitive and psychiatric impairments hadsignificant left anterior temporal and bilateralsuperior frontal hypoperfusion, but no signifi-cant diVerences in orbitofrontal regions
    5. antisocial personality disordershowed significant diVerences on three meas-ures: more violent crimes, more psychopathic

      "...traits, and reduced overall prefrontal grey matter volume."

      do the subjects only have antisocial personality disorder, or are there other factors that could contribute to these three? do they control for only ASPD?

    6. Persistently violent patients, however, hadsignificantly more frontal lobe impairmentthan transiently violent patients and theirbehaviour seemed less responsive to environ-mental factors.

      different types of violence can be connected to different levels of frontal lobe damage/impairment?

    7. subjects with lesions limited to thefrontal lobes tended to show more aggressiveand violent behaviours compared with patientswith non-frontal head injury and controlswithout head injury.

      frontal lobe injury can cause impaired judgement, impulse control, and problem-solving

  28. Sep 2017
    1. Our results provide physiological and behavioral evidence that sensitivity to pleasant touch emerges early in development and therefore plays an important role in regulating human social interactions.

      result

  29. Aug 2016
    1. The omnibus test statistic, Pillai’s Trace, indicated the presence of a significant group difference among the log lobe volumes (F = 2.886, df = 4,37; p = 0.040).

      ID: 001
      Value: log lobe vol
      Variable: diagnosis
      ModelID: Pillai's Trace
      F: 2.886
      DF: 4, 37
      P: 0.040

    1. Cerebellar white matter was significantly larger in the ALI group (28.2 cc) than in the SLI group (25.1 cc), F(3,38) = 3.0, p = 0.04, contrast t(38) = 2.96, p < 0.005.

      ID: 002
      Variable: cerebellar WM vol
      Group: ALI
      Cerebellar WM Vol: 28.2
      Units: cc

      ID: 003 Variable: cerebellar WM vol Group: SLI Cerebellar WM Vol: 25.1 Units: cc

      ID: 004 Variable: cerebellar WM vol, diagnosis Group: ALI, SLI F: 3.0 DF: 3, 38 P: 0.04 ContrastDF: 38 ContrastT: 2.96 ContrastP: <0.005

      *Break into test of all groups, then contrast is ALI SLI

    2. Whole cerebellum and cerebellar cortex volumes did not differ among the four subject groups

      ID: 001
      Variable: whole cerebellum volume, cerebellar cortex volume, diagnosis
      Interpretation: Whole cerebellum volume and cerebellar cortex volume did not vary across diagnostic groups NC, ALN, ALI, SLI

  30. Jul 2016
    1. Cortical analyses vertexwise across the surface were performed with general linear models to investigate relations of birth weight to regional cortical area and thickness, controlling for variation in age, sex, household income, and GAF as well as scanner used. When a commonly used approach to correct for multiple comparisons was used [false discovery rate (FDR) < 5%], minute effects of birth weight were observed on cortical thickness. However, significant positive relationships between birth weight and area were observed across large parts of the cortical surface (Fig. 1). On the medial surface of the brain, effects were seen bilaterally in the rostral anterior cingulate, retrosplenial, paracentral, precuneus, superior frontal and medial orbitofrontal cortices, parahippocampal, and fusiform gyri. On the lateral brain surface, bilateral effects extended from parsorbitalis to cover parts of lateral orbitofrontal cortices, and there were also effects in the rostral middle frontal, inferior parietal, and superior and middle temporal cortices as well as in the pre- and postcentral gyri. A few somewhat more scattered unilateral effects were also seen. Medially, effects extended into the caudal anterior cingulate in the left but not right hemisphere, whereas superior and orbitofrontal effects were more pronounced in the right than left hemisphere. Lateral effects were also more pronounced in the left orbitofrontal cortex, but otherwise, lateral effects also seemed slightly more extensive in the right hemisphere, covering somewhat larger temporal and parietal areas. Because the use of FDR for correction for multiple comparisons may influence the detection of specific effect sites, the full range of effects uncorrected at P < 0.05 is also shown in Fig. S1. Uncorrected, effects were somewhat more extensive, but the general pattern described was similar. A scatter plot of the relationship between birth weight and anterior cingulate area (partial β = 0.19, P < 0.0001) is shown in Fig. 2A. It appears from the plot that the low birth weight cases were not disproportionately influencing the relationship and that the relationship between cortical area and birth weight was also monotonous. The relationship between birth weight and anterior cingulate area remained virtually identical when excluding the low birth weight (1,500–2,499 g) cases (partial β = 0.18, P < 0.0001).

      Vague result info- currently beyond scope

    2. alid Flanker data were available for 522 participants, and we used reaction time in the incongruent condition, related to cognitive control, as the measure of interest. With GAF, MR site, sex, socioeconomic status, and age as covariates, better Flanker performance was significantly related to larger total anterior cingulate area [partial β = −0.092, P = 0.011, degrees of freedom (df) = 20, 502]. This effect was specific to cognitive control, because the relationship survived adding congruent reaction time as an additional covariate area (partial β = −0.064, P = 0.006, df = 21, 501);

      ID: 015
      Variable: Flanker performance, total anterior cingulate area
      Model:
      PartialBeta: -0.092
      P: 0.011
      DF: 20, 502

      ID: 016 Variable: Flanker performance, total anterior cingulate area Model: ? (includes congruent RT) PartialBeta: -0.064 P: 0.006 DF: 21, 501

    3. an effect of method of delivery on rostral anterior cingulate area, where larger area was observed with cesarean section (standardized β = 0.09, P = 0.018). This finding did not, however, attenuate the relationship with birth weight, for which the effect size remained virtually identical (standardized β = 0.185 vs. 0.193, both P values < 0.0001) when method of delivery was included or not included in the analysis, respectively.

      ID: 010
      Variable: rostral anterior cingulate area, birth method
      Group: c section
      ModelID: ?
      StandardizedBeta: 0.09
      P: 0.018

      ID: 011 Variable: birth weight, birth method Group: c section ModelID: ? StandardizesBeta: 0.193 P: <0.0001

      ID: 012 Variable: birth weight, birth method Group: vaginal birth ModelID: ? StandardizesBeta: 0.185 P: <0.0001

      *Assumption made about which beta corresponds to which birth method

    4. These relationships also remained largely similar when excluding the low (1,500–2,499 g) birth weight cases (partial β for putamen: 0.09, P = 0.022; pallidum: 0.11, P = 0.004; caudate: 0.19, P < 0.001; TBV: 0.17, P < 0.001)

      ID: 005
      Variable: birth weight, putamen vol
      Group: birth weight >2499g
      PartialBeta: 0.09
      P: 0.022
      Interpretation: birth weight positively associated with putamen volume

      ID: 006 Variable: birth weight, pallidum vol Group: birth weight >2499g PartialBeta: 0.11 P: 0.004 Interpretation: birth weight positively associated with pallidum volume

      ID: 007 Variable: birth weight, caudate vol Group: birth weight >2499g PartialBeta: 0.19 P: <0.001

      ID: 008 Variable: birth weight, TBV vol Group: birth weight >2499g PartialBeta: 0.17 P: <0.001 Interpretation: birth weight positively associated with TBV vol

    5. Birth weight was uniquely and positively associated with each volume (partial β for putamen: 0.11, P = 0.006; pallidum: 0.12, P = 0.002; caudate: 0.20, P < 0.001; TBV: 0.16, P < 0.001)

      ID: 001
      Variable: birth weight, putamen vol
      PartialBeta: 0.11
      P: 0.006
      Interpretation: birth weight positively associated with putamen volume

      ID: 002 Variable: birth weight, pallidum vol PartialBeta: 0.12 P: 0.002 Interpretation: birth weight positively associated with pallidum volume

      ID: 003 Variable: birth weight, caudate vol PartialBeta: 0.20 P: <0.001

      ID: 004 Variable: birth weight, TBV vol PartialBeta: 0.16 P: <0.001 Interpretation: birth weight positively associated with TBV vol

    1. No associations were found between the lobes or individual PUs and the following clinical variables: antipsychotic dose in chlorpromazine equivalents, YMRS score, duration of illness, presence or absence of ADHD, and current mood state (manic, mixed, depressed, or euthymic)

      ID: 015
      Variable: lobe vol, antipsychotic dos in chlorpromazine equivalents, YMRS score, duration of illness, ADHD, current mood state
      Interpretation: No associations were found between lobe volume and these clinical variables

      ID: 016 Variable: PU vol, antipsychotic dos in chlorpromazine equivalents, YMRS score, duration of illness, ADHD, current mood state Interpretation: No associations were found between PU volumes and these clinical variables

    2. When we looked at the gyri in the BPD group, we found only that volumes of the left log POG were significantly and positively associated with scores on the GAF (B = 0.012; t = 2.22, p = 0.035).

      ID: 014
      Variable: left POG vol, GAF score
      Group: BPD
      B: 0.012
      T: 2.22
      P: 0.035
      Interpretation: left POG vol positively associated with GAF score

    3. The left log PL volumes in the BPD children decreased significantly in association with increasing numbers of psychoactive medications (B = −0.04; t = −2.138, p = 0.042) (when we examined the possible relationship between type of medication and change in PL volumes, we did not detect any significant or trend relationship between type of medication and PL volume).

      ID: 012
      Variable: left PL vol, quantity of medications
      B: -0.04
      T: -2.138
      P: 0.042
      Interpretation: left PL vol decreased with increased number of psychoactive medications

      ID: 013 Variable: PL vol, type of medication Interpretation: no relationship observed between PL vol and type of medication

    4. Within the BPD group, those children with psychotic symptoms had smaller left log TL volumes (B = −0.092; t = −2.066, p = 0.048) than those without psychotic symptoms

      ID: 011
      Variable: left TL vol, diagnosis
      Group: BPD_psych
      B: -0.092
      T: -2.066
      P: 0.048

    5. the BPD had significant reductions in the right and left POG (right: B = −0.116; t = −2.027, p = 0.049; left: B = −0.136; t = −2.592, p = 0.013).

      ID: 006
      Variable: right POG vol
      Group: BPD
      B: -0.116
      T: -2.027
      P: 0.049

      ID: 007 Variable: left POG vol Group: BPD B: -0.136 T: -2.592 P: 0.013

    6. Interestingly, both age and Verbal IQ for all children in this study (both BPD and HC combined) showed inverse relationships with PL volume, such that children with higher Verbal IQ scores were more likely to have smaller PL volumes, and older children were more likely to have smaller PL volumes.

      ID: 004
      Interpretation: Observed inverse relationship between age and PL volume

      ID: 005 Interpretation: Observed inverse relationship between verbal IQ score and PL volume

    7. The bipolar youth had significantly smaller log right and left PL volumes relative to the HC (right: B = −0.080, t = −2.154, p = 0.037; left: B = −0.102; t = −3.122, p = 0.003), after controlling for the significant effects of age, Verbal IQ, and log cerebral volume (see Table 4 for summary of regression models).

      ID: 002
      Variable: right PL vol
      Group: BPD
      B: -0.080
      T: -2.154
      P: 0.037
      Interpretation: BPD youth had smaller right PL volumes than HC

      ID: 003 Variable: left PL vol Group: BPD B: -0.102 T: -3.122 P: 0.003 Interpretation: BPD youth had smaller left PL volumes than HC

    1. When FA and ADC in forceps major were entered, FA was still significantly related to incongruent RT (β = −0.11, P < 0.01), whereas ADC ceased to be significant.

      ID: 024
      Variable: Incongruent RT
      Covariate: FA of forceps major, ADC of forceps major
      *how do we annotate that DTI parameters were included pairwise? does it matter that they were entered pairwise? we have a beta for each FA that varies by its DTI pairing

      ID: 025 Variable: Incongruent RT Covariate: FA Beta: -0.11 P: <0.01

      ID: 026 Variable: Incongruent RT Covariate: ADC P: insignificant

    2. In contrast to the cortical results, where a linear reduction in strength of the relationship with age was seen, the relationship between ADC/FA and cognition was strongest around 6–10 and above 16 y, with correlations not significant in the middle part of the age range (Fig. 3)
    3. a positive significant effect on anterior cingulate surface area for boys (partial β = 0.18, P < 0.10−6) was found.

      ID: 021
      Variable: Anterior cingulate SA
      Covariate: Sex
      Group: male
      Model:
      PartialBeta: 0.18
      P: <0.10^-6

    4. Significant positive RT relationships with forceps major were seen for both ADC (β = 0.18, P < 0.014, corrected for the number of comparisons) and FA (β = −0.20, P < 0.0014, corrected).

      ID: 022
      Variable: RT, ADC of forceps major
      ModelID: ?
      Beta: 0.18
      P: <0.014
      Interpretation: Positive RT relatonship

      ID: 023 Variable: RT, FA of forceps major ModelID: ? Beta: -0.20 P: <0.0014 Interpretation: Positive RT relationship

    5. Additional analyses showed relationships of marginally less strength in the left hemisphere (artial β = −0.24 vs. −0.02 in the young and older groups, respectively, with congruent RT as a covariate)

      ID: 016
      Variable: left caudal anterior cingulate SA
      Covariate: congruent RT
      Group: Young
      ModelID: ?
      ArtialBeta: -0.24

      ID: 017 Variable: left caudal anterior cingulate SA Covariate: congruent RT Group: Old ModelID: ? ArtialBeta: -0.02

    6. Partial β was −0.23 (P < 0.05) for the younger sample compared with −0.02 [not significant (n.s.)] for the older sample. With RT from the congruent condition included as an additional covariate, the corresponding partial β values for incongruent RT were −0.32 (P < 0.05) for the younger group and −0.01 (n.s.) for the older participants.

      ID: 011
      Variable: SA
      Group: Young
      ModelID: ?
      PartialBeta: -0.23
      P: <0.05

      ID: 012 Variable: SA Group: Old ModelID: ? PartialBeta: -0.01 P: insignificant

      ID: 013 Variable: SA Group: Incongruent_Young ModelID: ? PartialBeta: -0.32 P: <0.05

      ID: 013 Variable: SA Covariates: Group: Incongruent_Old ModelID: ? PartialBeta: -0.01 P: Insignificant

    7. A cluster of negative effects covering the entire right anterior cingulate was found for the young group (cluster size = 2,077 mm2, clusterwise P = 0.019, corrected)

      ID: 007
      Variable: RT, Cluster size
      Group: Young
      Cluster size: 2077
      Units: mm^2
      P: 0.019
      Interpretation: Cluster of negative effects found in right anterior cingulate of young group

    8. Mean incongruence effect (cognitive conflict) on RT was 14.8% and negatively related to age (Pearson r = −0.33, P < 10−19)

      ID: 006
      Variable: Incongruence effect on RT
      Covariate: Age
      Mean: 14.8%
      ModelID: Pearson
      CorrelationCoefficient: -0.33
      P: <10^-19

    9. both were negatively related to age (Spearman ρ, congruent RT = −0.53, P < 10−53; incongruent RT = −0.61, P < 10−76)

      ID: 004
      Group: Congruent
      CorrelationCoefficient: -0.53
      P: <10^-53
      ModelID: Spearman

      ID: 005 Group: Incongruent CorrelationCoefficient: -0.61 P: <10^-76 ModelID: Spearman

    10. Mean reaction time (RT) in the congruent condition was 789 ms (SD = 217) vs. 906 ms (SD = 293) in the incongruent condition (t = 20.83, P < 10−75)

      ID: 001
      Variable: RT
      Groups: Congruent, Incongruent
      ModelID: TTEST
      T: 20.83
      P: <10^-75

      ID: 002 Variable: RT Group: Congruent MeanValue: 789 SD: 217 Units: ms

      ID: 003 Variable: RT Group: Incongruent MeanValue: 906 SD: 293 Units: ms

  31. Mar 2016
    1. Significant diagnostic differences were seen in the left and right cerebral volumes in interaction with sex (right: F3,93 = 2.9, P = .04; left: F3,93 = 3.1, P = .04).

      ID: LCerebralVolume ModelApplication: RLSubcBrainVolumes Value: Left Cerebral Volume Variable: Diagnosis+Sex F: 2.9 P: 0.04 Interpretation: Significant differences

      ID: RCerebralVolume ModelApplication: RLSubcBrainVolumes Value: Right Cerebral Volume Variable: Diagnosis+Sex F: 3.1 P: 0.04 Interpretation: Significant differences

  32. Jul 2015
    1. n contrast to our initial hypothesis, the genetic deletion of HDAC6 did not reduce the weight loss or the deficits in cognitive abilities and nest-building behavior shown by R6/1 mice, and even worsened their social impairments, hypolocomotion in the Y-maze, and reduced ultrasonic vocalizations.