3. Escena de Apertura
Antes de la escena de apertura nos falta la cronología de Webb y Vance para hacernos una mejor idea de cómo murió el periodista y qué pasó en general.
3. Escena de Apertura
Antes de la escena de apertura nos falta la cronología de Webb y Vance para hacernos una mejor idea de cómo murió el periodista y qué pasó en general.
Tinta Negra es una historia de misterio y horror cósmico para dos personas — un Director que conoce la verdad y un jugador que la descubre. El Director narra el mundo e interpreta a sus personajes; el jugador decide qué hace Phyllis Oakley, una cazalibros de libros raros en el Londres de 1926. No hay tablero ni guion fijo: la historia se construye en la conversación. Este libro es la herramienta del Director. Contiene la verdad detrás del misterio, las escenas de investigación, los personajes y los materiales de juego. Está pensado para leerse como preparación y consultarse por secciones durante la partida.
esto es nuevo
Document de Synthèse : Interprétariat, Migration et Santé Mentale
Ce document synthétise les interventions de la soirée-débat organisée le 12 octobre par Médecins du Monde et le CHU de Toulouse.
Le constat central souligne une dégradation de l'accès aux soins pour les personnes précaires en France, exacerbée par une « crise de l'accueil » plutôt que par une simple crise migratoire.
L'interprétariat professionnel y est identifié comme la « clé de voûte » indispensable pour assurer une prise en charge médicale et psychologique digne.
Les points saillants incluent :
• La précarisation croissante des exilés, avec une corrélation forte entre migration et sans-abrisme.
• L'impact délétère des procédures administratives et des conditions d'accueil sur la santé mentale (traumatismes complexes).
• Le rôle précurseur du CHU de Toulouse et de l'unité Iker dans l'intégration de l'interprétariat au sein du parcours de soins.
• La nécessité de structurer et de financer l'interprétariat au-delà des dispositifs hospitaliers spécialisés pour toucher la médecine de ville.
--------------------------------------------------------------------------------
L'analyse de Nicolas Chambon (Orspere-Samdarra) remplace le terme de « crise migratoire » par celui de « crise de l'accueil ».
Malgré une augmentation constante de la demande d'asile depuis 15 ans, les structures d'hébergement (CADA) restent insuffisantes.
• Statistiques clés de l'hébergement :
◦ 40 % des personnes dans le dispositif national d'accueil ne parlent pas français.
◦ Dans les Centres d'Hébergement et de Réinsertion Sociale (CHRS), on compte 55 % d'étrangers.
◦ Dans l'hébergement d'urgence, ce chiffre monte à 77 %.
◦ L'Aide Médicale d'État (AME) est passée de 75 000 bénéficiaires en 2002 à plus de 400 000 aujourd'hui.
Le public rencontré par les structures de santé est de plus en plus hétérogène, incluant :
• Réfugiés et demandeurs d'asile : Environ 310 000 réfugiés et 140 000 demandeurs d'asile, dont beaucoup sont allophones.
• Mineurs Non Accompagnés (MNA) : Environ 50 000 personnes dans cette situation, en attente de reconnaissance de minorité ou en recours, avec des besoins spécifiques en santé mentale.
• Personnes déboutées : Environ 2/3 des demandeurs d'asile sont déboutés, ce qui entraîne une perte de droits et une précarité extrême.
--------------------------------------------------------------------------------
Sous la direction de Karine Parienté, ce service a développé plusieurs unités spécialisées pour répondre à la barrière linguistique et sociale :
| Unité | Missions Principales | | --- | --- | | Iker | Coordination de l'appui aux professionnels de santé et travailleurs sociaux ; lutte contre l'hospitalo-centrisme ; financement de l'interprétariat en ville. | | PASS (Permanence d'Accès aux Soins de Santé) | Accueil des personnes sans droits (90 % de migrants) ; dispositif mobile pour les personnes à la rue. | | LHSS (Lits Halte Soins de Santé) | Accueil médico-social (séjours d'environ 1 mois) pour les personnes sans domicile nécessitant des soins aigus. | | Santé Sexuelle | Prévention et soins pour les publics à risque, notamment originaires de pays à haute prévalence. |
Yann Laperrière détaille une activité en expansion avec 10 salariés et 100 bénévoles, articulée autour de quatre programmes :
1. CASO (Centre d'Accueil, de Soins et d'Orientation) : Consultations médicales pour les publics sans droits.
2. Actions Mobiles : Médiation en santé dans les bidonvilles, squats et la rue, avec un focus sur les familles.
3. Mission MNA : Programme exploratoire dédié aux mineurs isolés.
4. Santé Mentale et Soutien Psychosocial : Activités collectives (ex: Café du Monde) et évaluations individuelles basées sur les ressources propres des personnes exilées.
--------------------------------------------------------------------------------
La santé mentale est intrinsèquement liée aux conditions sociales. L'exil est décrit comme un parcours de ruptures successives et de violences.
• Trouble de stress post-traumatique (TSPT) : Concerne environ 1/3 de la population réfugiée.
• Troubles dépressifs : Touchent également 1/3 des exilés.
• Traumatismes complexes : Les traumatismes ne sont pas seulement liés au pays d'origine ou au voyage, mais aussi au « non-accueil » en France (vie à la rue, violence en centre d'hébergement).
Nicolas Chambon souligne deux dérives majeures :
• L'utilitarisme administratif : Le soin est souvent réduit à l'obtention d'un certificat médical pour des procédures (titre de séjour « étranger malade », recours CNDA). Cela peut mener à « ouvrir » un traumatisme pour le récit administratif sans assurer de suivi thérapeutique derrière.
• L'inadaptation des dispositifs modernes : Les nouvelles approches de « santé mentale positive » ou de réhabilitation psychosociale sont souvent inaccessibles aux migrants car elles présupposent une stabilité sociale (logement, droits) que ces publics n'ont pas.
--------------------------------------------------------------------------------
L'interprétariat est présenté non pas comme un accessoire, mais comme une condition sine qua non de la pratique clinique en contexte de migration.
• Précision du diagnostic : Sans interprète, des erreurs graves surviennent (ex: une patiente diagnostiquée par erreur comme souffrant de troubles psychiatriques alors qu'elle était simplement allophone).
• Reconnaissance de l'altérité : Parler dans sa langue maternelle permet de sortir du « récit de victime » imposé par l'administration pour redevenir sujet de son histoire.
Une étude de l'ARS en région Auvergne-Rhône-Alpes révèle un décalage entre les besoins et l'utilisation des fonds :
• Une enveloppe de 600 000 € destinée aux libéraux est consommée à 60 % par les PASS.
• Les généralistes ne l'utilisent qu'à 2 % et les psychiatres libéraux à 1,8 %.
Conclusion des intervenants : Il est impératif de structurer l'interprétariat comme un outil professionnel, financé et sensibilisé auprès de l'ensemble du corps médical pour garantir un accueil inconditionnel et un soin de qualité.
--------------------------------------------------------------------------------
« L'interprétariat est vraiment la clé de voûte de toute cette prise en charge importante. » — Yann Laperrière
« On s'est rendu compte qu'en fait elle n'était pas folle, elle était vietnamienne. » — Nicolas Chambon (citant un psychiatre en 2017)
« Soutenir la situation sociale des personnes, c'est soutenir leur santé mentale et inversement. » — Nicolas Chambon
Briefing Doc : Vivre son adolescence dans un monde en crise
Ce document de synthèse analyse les interventions du Professeur Ludovic Gicquel, pédopsychiatre et responsable de la Maison des Adolescents de la Vienne (Pictadom), lors d'une conférence organisée par la Caisse d'Allocations Familiales (CAF). Il explore les mécanismes biologiques, psychologiques et sociétaux qui définissent l'adolescence contemporaine.
--------------------------------------------------------------------------------
L'adolescence est une période de métamorphose radicale, marquée par un décalage structurel entre un corps qui s'adultise et un cerveau dont la maturité complète n'est atteinte qu'à l'âge de 25 ans.
Aujourd'hui, ce processus se déroule dans un « bain sociétal » particulièrement anxiogène, caractérisé par une surstimulation numérique et des crises mondiales permanentes.
Points clés à retenir :
• Santé mentale : Un adolescent sur quatre (11-15 ans) est touché par un trouble anxieux généralisé (sondage Ipsos 2021).
• Neurobiologie : Le cerveau adolescent est régi par les émotions (amygdale) plutôt que par la raison (cortex préfrontal), ce qui explique l'impulsivité.
• Concurrence numérique : Pour la première fois, l'interaction humaine est en concurrence directe avec l'interaction numérique, modifiant le rôle parental de « filtre ».
• Pathologies : 80 à 85 % des adolescents traversent cette période sans encombre majeur, mais les comportements d'auto-régulation dysfonctionnels (scarifications, addictions) sont en forte hausse.
--------------------------------------------------------------------------------
L'adolescence ne doit pas être perçue comme une simple transition, mais comme une étape de développement à part entière avec ses propres spécificités physiologiques.
Le cerveau adolescent subit un remaniement profond. La maturation cérébrale est postéro-antérieure : elle commence par l'arrière et se termine par le cortex préfrontal, siège de la décision et de la gestion des émotions.
• Le cerveau émotionnel : L'amygdale est hyperactive, provoquant une réactivité émotionnelle intense.
• Le haut débit nerveux : La gaine de myéline s'épaissit, faisant passer la vitesse de l'influx nerveux de 1 à 100 mètres par seconde (passage de l'ADSL à la fibre optique).
• L'élagage synaptique (Pruning) : Le cerveau élimine les connexions inutilisées pour se spécialiser, rendant cette période cruciale pour l'apprentissage.
La puberté impose un corps « adulte » à un esprit encore infantile. Ce processus est souvent vécu de manière passive : l'adolescent « subit » ses hormones et sa croissance.
• La violence de la métamorphose : Elle est souvent plus marquée chez les filles, créant une discordance entre l'image perçue et l'identité intérieure.
• La parentalité physiologique : Dès la puberté, le corps est apte à la reproduction, créant un décalage avec les normes sociales actuelles où l'autonomie est tardive.
--------------------------------------------------------------------------------
L'environnement moderne agit comme un incubateur qui influence directement le développement des jeunes.
Le monde numérique n'est plus un outil, mais un environnement concurrentiel.
L'interaction parentale est désormais en concurrence avec l'interaction numérique.
Le smartphone est décrit comme une « arme de séduction massive » conçue par des industries pour capter le temps de cerveau disponible.
• Le mécanisme de la récompense : Les « likes » activent la dopamine, créant une dépendance à la validation externe (société de l'extimité).
• Le "scrolling" : Un mécanisme hypnotique qui altère la perception du temps et l'effort de concentration.
• Image de soi : Les filtres et les photos retouchées créent des standards de beauté inaccessibles, générant un sentiment permanent d'anormalité.
• Pornographie : L'exposition précoce via smartphone (souvent dès le collège) est un « abus de faiblesse ».
Elle propose une vision performative et violente de la sexualité, souvent incompatible avec les capacités de contenance émotionnelle des jeunes.
| Domaine | Impact du numérique | | --- | --- | | Information | Saturation, difficulté à distinguer l'opinion du fait (Fake News). | | Social | Relations, ruptures et deuils vécus à distance avec une intensité réelle. | | Consommation | L'adolescent n'est plus le client, il est le produit (exploitation des vulnérabilités). |
--------------------------------------------------------------------------------
Le Professeur Gicquel distingue le développement normal des trajectoires pathologiques.
Les troubles sont souvent des « aménagements pathologiques d'un développement normal ».
1. Remaniements adaptatifs (80-85 %) : L'adolescence se déroule normalement.
2. Troubles adaptatifs (10 %) : Souffrance transitoire et réactionnelle à l'environnement.
3. Troubles structurels (5 %) : Pathologies lourdes (anorexie mentale, schizophrénie, troubles bipolaires, trouble borderline).
L'inquiétude parentale est considérée comme le meilleur baromètre. Les symptômes de régulation émotionnelle dysfonctionnelle doivent alerter :
• Scarifications : En hausse de 400 % en 20 ans ; elles servent de « fusible » pour décharger une angoisse psychique insupportable sur le corps.
• Troubles alimentaires : Préoccupations excessives pour la diététique ou perte de poids rapide.
• Déscolarisation : Souvent liée au harcèlement (stigmatisation de la différence).
• Phobie sociale : Incapacité à faire groupe.
--------------------------------------------------------------------------------
Dans un monde insécurisant (climat, guerres, économie), le parent doit retrouver son rôle de filtre, tout en acceptant sa propre faillibilité.
• Maintenir le dialogue : Ne pas disqualifier les centres d'intérêt numériques (ex: Minecraft, TikTok), mais s'en servir comme base d'échange.
• Cultiver le libre arbitre : Aider l'adolescent à décrypter les images et les sources d'information.
• Accepter l'ingratitude : La séparation-individuation nécessite que l'adolescent se détache des parents, ce qui peut générer des conflits.
• Ne pas être parfait : Les parents ont le droit d'être anxieux ou tristes, à condition de l'expliquer a posteriori pour éviter que l'enfant ne se sente coupable.
Structures de recours (Exemple de la Vienne)
• Pictadom (Maison des Adolescents) : Accueil gratuit, anonyme et sans rendez-vous pour les jeunes et les parents.
• Mon Psy : Dispositif permettant huit consultations de psychologue remboursées sur orientation médicale.
• Unités d'urgence (AZAP) : Prise en charge intensive de jour pour les crises suicidaires ou les troubles borderline.
--------------------------------------------------------------------------------
« L'adolescent n'est pas un enfant XL ni un adulte miniature. C'est un être à part entière. »
« Le cerveau est adulte à 25 ans, soit 7 ans après le droit de vote. Il y a un décalage non négligeable. »
« Nos enfants sont devenus nos parts de marché. Les adolescents vivent dans une société de consommation qui les consomme. »
« Le parent est un filtre. On ne peut pas filtrer l'environnement si on est soi-même au prise avec des difficultés sans aide. »
8816
DOI: 10.1038/s41431-025-01966-y
Resource: RRID:BDSC_8816
Curator: @maulamb
SciCrunch record: RRID:BDSC_8816
8765
DOI: 10.1038/s41431-025-01966-y
Resource: RRID:BDSC_8765
Curator: @maulamb
SciCrunch record: RRID:BDSC_8765
36304
DOI: 10.1038/s41431-025-01966-y
Resource: RRID:BDSC_36304
Curator: @maulamb
SciCrunch record: RRID:BDSC_36304
BDSC #8751
DOI: 10.1038/s41431-025-01966-y
Resource: RRID:BDSC_8751
Curator: @scibot
SciCrunch record: RRID:BDSC_8751
BDSC #7415
DOI: 10.1038/s41431-025-01966-y
Resource: RRID:BDSC_7415
Curator: @scibot
SciCrunch record: RRID:BDSC_7415
BDSC #55205
DOI: 10.1038/s41431-025-01966-y
Resource: RRID:BDSC_55205
Curator: @scibot
SciCrunch record: RRID:BDSC_55205
RRID:AB_2532166
DOI: 10.1371/journal.pbio.3003630
Resource: (Thermo Fisher Scientific Cat# 31872, RRID:AB_2532166)
Curator: @scibot
SciCrunch record: RRID:AB_2532166
RRID:SCR_016479
DOI: 10.1007/s12035-026-05741-y
Resource: IBM SPSS Statistics (RRID:SCR_016479)
Curator: @scibot
SciCrunch record: RRID:SCR_016479
RRID:SCR_020343
DOI: 10.1007/s12035-026-05741-y
Resource: Olympus BX61 Upright Wide Field Microscope (RRID:SCR_020343)
Curator: @scibot
SciCrunch record: RRID:SCR_020343
RRID:SCR_000441
DOI: 10.1007/s12035-026-05741-y
Resource: EthoVision XT (RRID:SCR_000441)
Curator: @scibot
SciCrunch record: RRID:SCR_000441
RRID:RRRC_00239
DOI: 10.1007/s12035-026-05741-y
Resource: RRID:RRRC_00239
Curator: @scibot
SciCrunch record: RRID:RRRC_00239
RRID:SCR_014551
DOI: 10.1007/s12035-026-05741-y
Resource: Olympus cellSens Software (RRID:SCR_014551)
Curator: @scibot
SciCrunch record: RRID:SCR_014551
«No escribamos nunca cláusula alguna en el papel, sin haberlaconstruido antes en el entendimiento, y desechémosla por demasiado larga, enredada yconfusa siempre que después de construida, no podamos retenerla con facilidad en lamemoria.» (Galí,1896)
Esta frase que dice Galí me parece muy acertada; después de todo, si tú mismo no comprendes lo que estás escribiendo, menos lo hará el lector.
«las cláusulas largas, las cuales con su excesivo número de conjunciones ypronombres relativos, hacen el estilo confuso, lánguido y pesado»
Estoy de acuerdo con el autor porque los textos con oraciones muy largas me cansan y me dificultan la comprensión. A veces tengo que releer varias veces para entender la idea principal, lo que demuestra que la claridad es fundamental en la escritura.
Quien quiera entrenarsepuede tapar con un papel la columna de la derecha e intentar mejorar la frase por sucuenta.
El método que sugiere el autor me parece entretenido y eficiente, puesto que este tipo de ejercicios interactivos ayudan más que solo leer.
I am able to record its considerable wisdom, shown in evading the plots of its enemy the spider. It is always on the look-out for his ambushes, and in the most circumspect way dodges about, that it may not be caught, netted, and entangled in his meshes
Agarra cualquier parecido con el humano, primero a nivel fisioólogico y después expande a elementos y cultura compartida con con alos seres vivos.
En particular la dinámica de depresdadores y presas.
Gestion des élèves perturbateurs : approches psychopédagogiques et cadres éthiques
Le comportement perturbateur d'un élève ne doit pas être perçu comme une simple transgression, mais comme le symptôme d'un mal-être profond, souvent enraciné dans un vécu personnel ou scolaire difficile.
La gestion efficace de ces situations repose sur la reconnaissance des besoins psychologiques fondamentaux de l'élève (sécurité, reconnaissance, justice, estime de soi) et sur la mise en place d'espaces de parole institutionnalisés.
L'analyse souligne que de nombreux élèves perturbateurs, y compris les harceleurs, sont eux-mêmes en situation de souffrance.
Pour répondre à ces défis, les personnels de direction et les équipes éducatives doivent naviguer entre quatre orientations éthiques :
L'équilibre entre ces dimensions permet de maintenir le lien de confiance entre l'élève et l'institution, évitant ainsi le décrochage ou l'exclusion définitive des profils les plus vulnérables.
Le comportement perturbateur est défini comme une manifestation de symptômes liés à une insatisfaction des besoins psychologiques fondamentaux.
Aider un élève nécessite d'être attentif à ces signes, qu'ils soient émotionnels ou plus subtils.
Pour remédier aux comportements problématiques, l'institution doit prendre en considération :
L'intervention repose sur une distinction claire entre les problématiques collectives et individuelles, ainsi que sur la création de structures d'échange formelles.
• Problème collectif : Doit faire l'objet d'une discussion collective.
• Problème individuel : Le comportement d'un élève spécifique doit être traité exclusivement avec lui, afin de préserver sa dignité et de favoriser un dialogue constructif.
La mise en place de "cellules d'écoute" ou d'espaces de parole sécurisés est présentée comme une solution aux résultats rapides et significatifs.
• L'écoute active : Les adultes doivent être formés pour permettre à l'élève d'élaborer lui-même le sens de son vécu.
• Efficacité constatée : Des exemples, notamment dans l'académie de Grenoble, montrent qu'une participation à deux ou trois reprises à ces espaces peut transformer le comportement des jeunes.
• Sécurité affective : L'espace doit permettre à l'élève de dire ce qu'il ressent sans crainte immédiate de jugement ou de répression.
Face à des actes graves (comme des injures envers un enseignant), la sanction demeure nécessaire.
Cependant, la procédure doit respecter des principes éthiques et réglementaires stricts.
• Le principe du contradictoire : Avant et pendant le conseil de discipline, toutes les parties doivent pouvoir s'exprimer et clarifier les faits.
• L'analyse de la souffrance : Il est impératif de considérer que l'élève auteur d'actes délictueux est souvent un élève qui souffre.
Le document note par exemple qu'un grand nombre de harceleurs sont eux-mêmes victimes de harcèlement.
• Dialogue avec la famille : La compréhension du contexte familial est cruciale pour identifier les racines du comportement de l'adolescent.
Le chef d'établissement et son équipe doivent composer avec quatre dimensions éthiques lors de la prise de décision disciplinaire :
| Orientation éthique | Définition et application | | --- | --- | | Déontologique | Respect strict du règlement intérieur et de la loi. C'est l'approche systématique : "à tel acte correspond telle sanction". Essentiel pour la responsabilité professionnelle du chef d'établissement. | | Conséquentialiste | Attention portée aux conséquences de la sanction sur l'avenir de l'élève. Par exemple, éviter d'informer des parents violents d'une faute mineure pour ne pas infliger une "double peine" à l'enfant. | | Exercice des vertus | Mise sur la patience, la prudence et la confiance. On donne du temps à l'élève pour s'améliorer en privilégiant un blâme ou un avertissement plutôt qu'une exclusion. | | Éthique du Care (Soin) | Posture indispensable vis-à-vis des élèves les plus vulnérables traversant des souffrances psychiques graves. Il s'agit de maintenir la "tête hors de l'eau" pour l'élève par un regard attentif et bienveillant. |
Le chef d'établissement a la responsabilité première de garantir le respect de la règle et du droit (réflexe déontologique) pour éviter toute faute professionnelle. Toutefois, la réalité du terrain impose une composition entre ces différentes éthiques.
Une décision efficace est souvent hybride : elle rappelle la règle (déontologie), tout en tempérant la sanction au regard du contexte (conséquentialisme) et en demandant à l'équipe pédagogique une "bienveillance attentive" (care).
Cette approche intégrée est présentée comme le seul moyen de préserver la confiance des élèves les plus fragiles envers l'école et les adultes, prévenant ainsi leur exclusion définitive du système scolaire.
Author response:
The following is the authors’ response to the original reviews.
Public Reviews:
Reviewer #1 (Public review):
Summary:
The authors show that genetic deletion of the orphan tumor necrosis factor receptor DR6 in mice does not protect peripheral axons against degeneration after axotomy. Similarly, Schwann cells in DR6 mutant mice react to axotomy similarly to wild-type controls. These negative results are important because previous work has indicated that loss or inhibition of DR6 is protective in disease models and also against Wallerian degeneration of axons following injury. This carefully executed counterexample is important for the field to consider.
Strengths:
A strength of the paper is the use of two independent mouse strains that knock out DR6 in slightly different ways. The authors confirm that DR6 mRNA is absent in these models (western blots for DR6 protein are less convincingly null, but given the absence of mRNA, this is likely an issue of antibody specificity). One of the DR6 knockout strains used is the same strain used in a previous paper examining the effects of DR6 on Wallerian degeneration.
The authors use a series of established assays to evaluate axon degeneration, including light and electron microscopy on nerve histological samples and cultured dorsal root ganglion neurons in which axons are mechanically severed and degeneration is scored in time-lapse microscopy. These assays consistently show a lack of effect of loss of DR6 on Wallerian degeneration in both mouse strains examined.
Therefore, in the specific context of these experiments, the author's data support their conclusion that loss of DR6 does not protect against Wallerian degeneration.
Weaknesses:
(1) The major weaknesses of this paper include the tone of correcting previously erroneous results and the lack of reporting on important details around animal experiments that would help determine whether the results here really are discordant with previous studies, and if so, why.
The authors do not report the genetic strain background of the mice used, the sex distributions of their experimental cohorts, or the age of the mice at the time the experiments were performed. All of these are important variables.
(Response 1) We thank the reviewer for emphasizing the importance of reporting the sex, age, and genetic background of the experimental animals used in our axon protection analyses. We have incorporated this information into the revised manuscript wherever available. The sole exception concerns the genetic background of the conditional DR6 mice generated by Genentech, which remains unknown. The original publication describing these mice (Tam et al., 2012, Dev Cell, PMID 22340501) did not report this information, and we were unable to obtain it directly from Genentech. Details regarding the genetic background of the Wld<sup>S</sup> and aPhr1 mutant mice are provided in their respective original publications, which are cited in our manuscript. Because the Gamage et al. study from the Deppmann laboratory did not report the sex or age of the animals used, we were unable to assess whether these variables might contribute to the differences observed between the two studies. Moreover, we are not aware of published evidence identifying sex or age as modifiers of structural axon preservation in axotomized peripheral nerve stumps in mouse models of delayed Wallerian degeneration. Furthermore, in the original publications describing the phenotypes of transgenic Nmnat2 and Wld<sup>S</sup> mice, as well as Sarm1 or Phr1 knockout mice, sex and age of the animals used in the Wallerian degeneration assays were not reported (PMIDs 23995269, 12106171, 22678360, 23665224). Although, to our knowledge, no large-scale systematic studies have been conducted, over the last 15 years we have never observed any sex-based differences in Wallerian degeneration phenotypes in these mutants exhibiting prominent axon protection. This topic was discussed informally at conferences, and we are also not aware of other investigators having observed such effects.
In response to the reviewer’s comment regarding “tone”, we made sure that our data and interpretations are presented in a professional, balanced, and objective manner, including a detailed discussion of potential alternative explanations for the discrepant findings.
(2) The DR6 knockout strain reported in Gamage et al. (2017) was on a C57BL/6.129S segregating background. Gamage et al. reported that loss of DR6 protected axons from Wallerian degeneration for up to 4 weeks, but importantly, only in 38.5% (5 out of 13) mice they examined. In the present paper, the authors speculate on possible causes for differences between the lack of effect seen here and the effects reported in Gamage et al., including possible spontaneous background mutations, epigenetic changes, genetic modifiers, neuroinflammation, and environmental differences. A likely explanation of the incomplete penetrance reported by Gamage et al. is the segregating genetic background and the presence of modifier loci between C57BL/6 and 129S. The authors do not report the genetic background of the mice used in this study, other than to note that the knockout strain was provided by the group in Gamage et al. However, if, for example, that mutation has been made congenic on C57BL/6 in the intervening years, this would be important to know. One could also argue that the results presented here are consistent with 8 out of 13 mice presented in Gamage et al.
(Response 2) As noted above, we now provide information on the genetic background of the mice in the revised manuscript, where available. We have not backcrossed the constitutive DR6 knockout mice obtained from the Deppmann laboratory (Gamage et al.) to a C57BL/6 background; our colony was maintained primarily through intercrosses of heterozygous animals. Similarly, the conditional DR6 mutant mice used in this study were also not backcrossed to C57BL/6 mice.
We respectfully hold a different view regarding the reviewer’s final point. We understand it is not appropriate to infer consistency between two datasets by disregarding the subset of results that do not align. By the same logic, it would be flawed to draw conclusions from the Gamage et al. study based solely on the single Wld<sup>S</sup> mouse out of five that did not show axon preservation after nerve injury. Selectively omitting conflicting data does not provide a valid basis for establishing phenotype concordance across studies.
To further strengthen our study, we note that we performed additional analyses on three more nerve samples from constitutive DR6 null mice during the revision process and have incorporated the resulting data in Fig. 1.
(3) Age is also an important variable. The protective effects of the spontaneous WldS mutation decrease with age, for example. It is unclear whether the possible protective effects of DR6 also change with age; perhaps this could explain the variable response seen in Gamage et al. and the lack of response seen here.
(Response 3) As discussed above, we now provide the age information for the mice used for the Wallerian degeneration assessments in the respective figure legends. To our knowledge, there are no prior reports suggesting that age is a significant determinant of structural axon preservation in the indicated mutants. Electrophysiological function and neuromuscular junction preservation decrease with age in axotomized Wld<sup>S</sup> mice (e.g., PMIDs 12231635, 19158292, 15654865), but these parameters are not subject of our study, and we have not studied them. Unfortunately, a direct comparison of ages between our DR6 mutant mice and those used in Gamage et al. (2017) is not possible, as the earlier study from the Deppmann laboratory did not report this information.
(4) It is unclear if sex is a factor, but this is part of why it should be reported.
(Response 4) We now report the requested sex information for our axon preservation analyses during nerve injury-induced Wallerian degeneration in the DR6 mouse models in Figs. 1 and 2.
(5) The authors also state that they do not see differences in the Schwann cell response to injury in the absence of DR6 that were reported in Gamage et al., but this is not an accurate comparison. In Gamage et al., they examined Schwann cells around axons that were protected from degeneration 2 and 4 weeks post-injury. Those axons had much thinner myelin, in contrast to axons protected by WldS or loss of Sarm1, where the myelin thickness remained relatively normal. Thus, Gamage et al. concluded that the protection of axons from degeneration and the preservation of Schwann cell myelin thickness are separate processes. Here, since no axon protection was seen, the same analysis cannot be done, and we can only say that when axons degenerate, the Schwann cells respond the same whether DR6 is expressed or not.
(Response 5) We appreciate the reviewer’s detailed comments. Our intention was not to directly compare our findings with those of Gamage et al. regarding the myelin behavior at these time points (because we never observed axon protection), but rather to note that we did not observe any DR6-dependent alterations in Schwann cell responses under conditions where axons undergo normal Wallerian degeneration. As the reviewer correctly points out, Gamage et al. analyzed Schwann cell myelin surrounding axons that were protected from degeneration for extended periods, a context fundamentally different from the complete lack of axon protection observed in our DR6-deficient models. Therefore, the specific dissociation between axon preservation and myelin maintenance claimed by Gamage et al. cannot be evaluated in our study. A statement to make this point clearer has been incorporated in the revised manuscript.
We fully agree with the reviewer’s concluding point: in our experiments, once axons degenerate, Schwann cell responses proceed similarly regardless of DR6 expression. This agreement reinforces one of the central conclusions of our work.
(6) The authors also take issue with Colombo et al. (2018), where it was reported that there is an increase in axon diameter and a change in the g-ratio (axon diameter to fiber diameter - the axon + myelin) in peripheral nerves in DR6 knockout mice. This change resulted in a small population of abnormally large axons that had thinner myelin than one would expect for their size. The change in g-ratio was specific to these axons and driven by the increased axon diameter, not decreased myelin thickness, although those two factors are normally loosely correlated. Here, the authors report no changes in axon size or g-ratio, but this could also be due to how the distribution of axon sizes was binned for analysis, and looking at individual data points in supplemental figure 3A, there are axons in the DR6 knockout mice that are larger than any axons in wild type. Thus, this discrepancy may be down to specifics and how statistics were performed or how histograms were binned, but it is unclear if the results presented here are dramatically at odds with the results in Colombo et al. (2018).
(Response 6) Several points raised by the reviewer appear to reflect differences in interpretation of the findings reported in Colombo et al. (2018). That study did not report altered myelination in DR6 null mice at stages when myelination is largely complete (P21). Instead, modest changes were observed at P1, which were reduced by P7, and P21 mutants were reported to be indistinguishable from controls. No analyses of peripheral nerves in older animals were presented, and the authors concluded in the discussion that myelination in young adult DR6 null mice appears normal. In contrast, our analysis of constitutive DR6 null mice at P1 does not reproduce the increase in the number of myelinated fibers per unit area reported by Colombo et al. We obtained similar results in the independent conditional DR6 knockout mouse line. Differences in nerve tissue processing, embedding, staining, or in the microscopic imaging and quantification of thinly myelinated axons in P1 sciatic nerve cross-sections may have contributed to the observed discrepancy. However, because the relevant methodological details were not described in Colombo et al., the underlying reasons for these differences cannot be determined and remain speculative.
(7) Finally, it is important to note that previously reported effects of DR6 inhibition, such as protection of cultured cortical neurons from beta-amyloid toxicity, are not necessarily the same as Wallerian degeneration of axons distal to an injury studied here. The negative results presented here, showing that loss of DR6 is not protective against Wallerian degeneration induced by injury, are important given the interest in DR6 as a therapeutic target, but they are specific to these mice and this mechanism of induced axon degeneration. The extent to which these findings contradict previous work is difficult to assess due to the lack of detail in describing the mouse experiments, and care should be taken in attempting to extrapolate these results to other disease contexts, such as ALS or Alzheimer's disease.
(Response 7) We agree with the reviewer’s point and emphasize that our manuscript carefully differentiates our data regarding the function of DR6 in Wallerian degeneration from the potential involvement of DR6 in other forms of axon degeneration. Our findings do not conflict with previous work on DR6 in the context of in vitro beta-amyloid and prion toxicity as well as in vitro models of ALS and multiple sclerosis. We believe these distinctions are explicitly and appropriately articulated throughout the entire manuscript and in more detail in the discussion section.
Reviewer #1 (Recommendations for the authors):
(1) The authors should include additional information about the mice used, including strain background for both the DR6 mice and the Cre transgenes crossed into the DR6 conditional knockout, the age of the mice when the nerve crush experiments were performed, and the sex distributions of the experimental cohorts. This information is critical for reproducibility in animal experiments, and that point is compounded here, where the major focus of this paper is taking issue with the reproducibility of previous work.
(Response 8) This information has been included in the revision. See above responses.
(2) In the abstract, reference 5 is cited as a study on the response to Schwann cells to injury in a DR6 background, but this probably should be reference 10.
(Response 9) This typo has been corrected.
(3) "Site-by-site comparison" in line 201 should be side-by-side?
(Response 10) This typo has been corrected.
(4) The paper contains a lot of self-evaluative wording, "surprising contrast," "compelling evidence," "robust results." Whether those adjectives apply should be for the reader to decide, and a drier, more objective tone in the presentation would improve the paper.
(Response 11) We agree that excessive self-evaluative wording can weaken objectivity. In the manuscript, such phrasing is used sparingly and intentionally to highlight differences from previously published studies, guide the reader, and convey scholarly judgment. We do not consider this limited use to be counterproductive. The adjectives “surprising,” “compelling,” and “robust” each appear only one to three times across the entire manuscript, and the specific phrase “robust results” does not appear at all.
(5) In Figure 2A, DR6-/-, there is no significant difference, but there is also a lot of variability, and one could argue the authors are seeing axon protection comparable to WldS in 40% of their samples (2/5), which is very similar to Gamage et al.
(Response 12) We respectfully disagree with this reasoning as it relies on selectively emphasizing only a subset of the data. Please also see our response #2 for more detailed discussion.
(6) Overall, the data presented here are convincing and support the conclusions drawn, but the paper needs to focus more on the negative results at hand and less on bashing previous studies, particularly when the results presented here do definitively show that the previous studies were incorrect and plausible explanations for differences in outcome exist.
(Response 13) We have carefully revisited the wording of the manuscript and are confident that our emphasis remains on the central negative finding that DR6 does not regulate axon degeneration and Schwann cell injury responses during Wallerian degeneration. We do not believe the manuscript “bashes” previous studies; nonetheless, we thoroughly re-examined all relevant sections to ensure that our language is neutral, accurate, and non-inflammatory. We believe the current phrasing presents our interpretations in an appropriately balanced, objective, and professional manner.
Reviewer #2 (Public review):
Summary:
This manuscript by Beirowski, Huang, and Babetto revisits the proposed role of Death Receptor 6 (DR6/Tnfrsf21) in Wallerian degeneration (WD). A prior study (Gamage et al., 2017) suggested that DR6 deletion delays axon degeneration and alters Schwann cell responses following peripheral nerve injury. Here, the authors comprehensively test this claim using two DR6 knockout mouse models (the line used in the earlier report plus a CMV-Cre derived floxed ko line) and multiple WD assays in vivo and in vitro, aligned with three positive controls, Sarm1 WldS and Phr1/Mycbp2 mutants. Contrary to the prior findings, they find no evidence that DR6 deletion affects axon degeneration kinetics or Schwann cell dynamics (assessed by cJun expression or [intact+degenerating] myelin abundance after injury) during WD. Importantly, in DRG explant assays, neurites from DR6-deficient mice degenerated at rates indistinguishable from controls. The authors conclude that DR6 is dispensable for WD, and that previously reported protective effects may have been due to confounding factors such as genetic background or spontaneous mutations.
Strengths:
The authors employ two independently generated DR6 knockout models, one overlapping with the previously published study, and confirm loss of DR6 expression by qPCR and Western blotting. Multiple complementary readouts of WD are applied (structural, ultrastructural, molecular, and functional), providing a robust test of the hypothesis.
Comparisons are drawn with established positive controls (WldS, SARM1, Phr1/Mycbp2 mutants), reinforcing the validity of the assays.
By directly addressing an influential but inconsistent prior report, the manuscript clarifies the role of DR6 and prevents potential misdirection of therapeutic strategies aimed at modulating WD in the PNS. The discussion thoughtfully considers possible explanations for the earlier results, including colony-specific second-site mutations that could explain the incomplete penetrance of the earlier reported phenotype of only 36%.
Weaknesses:
(1) The study focuses on peripheral nerves. The manuscript frequently refers to CNS studies to argue for consistency with their findings. It would be more accurate to frame PNS/CNS similarities as reminiscences rather than as consistencies (e.g., line 205ff in the Discussion).
(Response 14) Axon protection in all key genetic models of delayed axon degeneration, including Wld<sup>S</sup>, SARM1, Phr1/Mycbp2 mutants, has been demonstrated in both the peripheral and central nervous systems. This observation supports the view that core molecular mechanisms regulating axon degeneration are conserved across neuronal populations throughout the entire nervous system. We have scrutinized the wording in our manuscript and are not aware that we frequently refer to CNS studies in regards to axon degeneration. Nevertheless, we have replaced the term “consistent” to avoid potential ambiguity when we discuss the earlier study showing normal Wallerian degeneration in the optic nerves from DR6 knockout mice.
(2) The DRG explant assays are convincing, though the slight acceleration of degeneration in the DR6 floxed/Cre condition is intriguing (Figure 4E). Could the authors clarify whether this is statistically robust or biologically meaningful?
(Response 15) We thank the reviewer for noting this aspect of our in vitro data in Fig. 4. The difference observed in the DR6 floxed/Cre condition is statistically significant at the 6h time point following disconnection, as indicated by the p value shown in Fig. 4E. However, a similarly statistically significant acceleration of axon degeneration was not observed in DRG axotomy experiments using constitutive DR6 knockout preparations, although a trend toward more rapid axon breakdown is apparent at 6 h post-axotomy (Fig. 4B). These observations may suggest reduced stability of DR6-deficient axons in this specific neuron-only in vitro context. Further investigation would be required to determine the biological significance of this effect. In contrast, our in vitro quantitative analyses of the initiation and early phases of Wallerian degeneration (Fig. 2) revealed no evidence of accelerated axon disintegration in the DR6 mutant mouse models, highlighting potential differences between in vitro and in vitro systems.
(3) In the summary (line 43), the authors refer to Hu et al. (2013) (reference 5) as the study that previously reported AxD delay and SC response alteration after injury. However, this study did not investigate the PNS, and I believe the authors intended to reference Gamage et al. (2017) (reference 10) at this point.
(Response 16) Thanks for pointing this out. We have corrected this typo in the revised manuscript.
(4) In line 74ff of the results section, the authors claim that developmental myelination is not altered in DR6 mutants at postnatal day 1. However, the variability in Figure S2 appears substantial, and the group size seems underpowered to support this claim. Colombo et al. (2018) (reference 11) reported accelerated myelination at P1, but this study likewise appears underpowered. Possible reasons for these discrepancies and the large variability could be that only a defined cross-sectional area was quantified, rather than the entire nerve cross-section.
(Response 17) We confirm that the quantification of thinly myelinated axons was performed on entire sciatic nerves from P1 mouse pups, as described in the methods section in our original manuscript. The data shown in Fig. S2 were obtained from 5-9 pups per experimental group. Sample sizes were determined based on a priori power analyses using pilot data, which indicated that a minimum of five biological replicates was sufficient to detect statistically significant differences with acceptable confidence. Comparable sample sizes have been used in our previous studies and by other groups to assess early postnatal myelination (e.g., PMIDs 21949390, 28484008). Several published studies have reported analyses using 3-4 animals per group (e.g., PMIDs 28484008, 25310982, 29367382). For comparison, the study by Colombo et al. used 3-8 pups for the analysis presented in their Fig. 3. We note that the apparent variability in Fig. S2 may be accentuated by the scaling of the y-axis, which was chosen to ensure that individual data points are clearly resolved and visible.
(5) The authors stress the data of Gamage et al. (2017) on altered SC responses in DR6 mutants after injury. They employed cJun quantification to show that SC reprogramming after injury is not altered in DR6 mutants. This approach is valid and the conclusion trustworthy. Here, the addition of data showing the combined abundance of intact and degenerated myelin does not add much insight. However, Gamage et al. (2017) reported altered myelin thickness in a subset of axons at 14 days after injury, which is considerably later than the time points analyzed in the present study. While, in the Reviewer's view, the thin myelin observed by Gamage et al. in fact resembles remyelination, the authors may wish to highlight the difference in the time points analyzed.
(Response 18) We consider the additional quantification of the area occupied by intact myelin and myelin debris to provide complementary information that supports the c-Jun-based conclusion that Schwann cell injury responses are normal in DR6-deficient nerves following lesion. We agree with this reviewer that the thin myelin observed by Gamage et al. resembles remyelination, raising the possibility that axon regeneration occurred into the distal nerve stump at the studied 14d post-injury time point (see their Fig. 3). This may have been interpreted as axon protection in this study. In our study, it was impossible to examine such myelin effects since axon protection was never observed in any of the DR6 mutant models at any of the time point we investigated. We have incorporated appropriate additional text to highlight this difference. See also response #5 above.
Reviewer #3 (Public review):
Summary:
The authors revisit the role of DR6 in axon degeneration following physical injury (Wallerian degeneration), examining both its effects on axons and its role in regulating the Schwann cell response to injury. Surprisingly, and in contrast to previous studies, they find that DR6 deletion does not delay the rate of axon degeneration after injury, suggesting that DR6 is not a mediator of this process.
Overall, this is a valuable study. As the authors note, the current literature on DR6 is inconsistent, and these results provide useful new data and clarification. This work will help other researchers interpret their own data and re-evaluate studies related to DR6 and axon degeneration.
Strengths:
(1) The use of two independent DR6 knockout mouse models strengthens the conclusions, particularly when reporting the absence of a phenotype.
(2) The focus on early time points after injury addresses a key limitation of previous studies. This approach reduces the risk of missing subtle protective phenotypes and avoids confounding results with regenerating axons at later time points after axotomy.
Weaknesses:
(1) The study would benefit from including an additional experimental paradigm in which DR6 deficiency is expected to have a protective effect, to increase confidence in the experimental models, and to better contextualize the findings within different pathways of axon degeneration. For example, DR6 deletion has been shown in more than one study to be partially axon protective in the NGF deprivation model in DRGs in vitro. Incorporating such an experiment could be straightforward and would strengthen the paper, especially if some of the neuroprotective effects previously reported are confirmed.
(Response 19) We thank the reviewer for these suggestions. We would like to highlight that our study addresses the role of DR6 in Wallerian degeneration, whereas in vitro NGF deprivation has been used to model developmental axon pruning. Previous work indicates fundamental biological differences between these regressive pathways regulating the stereotyped removal of axon segments. We feel that studying this alternative form of axon degeneration is beyond the scope of the current work and could be addressed in a separate manuscript. Although additional tests will be needed, we note that our preliminary data using samples from both DR6 knockout mouse models suggest no axon protection after NGF-deprivation in DRG neuron preparations in our hands (deprivation of the growth factor and administration of anti-NGF antibody).
(2) The quality of some figures could be improved, particularly the EM images in Figure 2. As presented, they make it difficult to discern subtle differences.
(Response 20) We have pseudocolored intact (turquoise) and degenerated (magenta) myelinated fibers on the high-resolution semithin micrographs (not electron micrographs) in the new Fig. 2 to make the distinction between the two fiber categories clearer.
Reviewer #3 (Recommendations for the authors):
(1) Line 121: The authors mention toluidine blue staining, but it does not appear to be shown in Figure S5.
(Response 21) This appears to be a misunderstanding. Fig. S5A shows the ultrastructure of dedifferentiated Schwann cells in transmission electron micrographs, while Figs. S5B and C show quantification of the area occupied by myelin sheaths and myelin debris profiles on osmium tetroxide and toluidine blue stained nerve sections from the two DR6 mutant models, based on semithin light microscopy. These are two different aspects of the analysis. The text has been modified in the revised manuscript to make the distinction clearer.
(2) Line 175: The authors should add NMNAT2 to the list of enzymes implicated in the regulation of Wallerian degeneration in mammals.
(Response 22) Nmnat2 and a literature reference (Milde et al., 2013) has been incorporated in the discussion of the revised manuscript to address this point.
(3) Line 201: Please correct the typo "site-by-site" to "side-by-side."
(Response 23) This typo has been corrected.
Author response:
We appreciate that the reviewers provided an overall positive assessment of our manuscript and offered constructive suggestions for improvement. All three reviewers noted that a key strength of our study is the implementation of a gut microbiome model for the characterization of interbacterial antagonism pathways such as the type VI secretion system (T6SS) that approaches natural complexity. They note our work represents a significant advance in microbiome research, and generates resources that will be of use to many researchers in the field. Two of the reviewers point out that the complexity of our model limits the nature of measurements we can make, and suggest we temper the strength of the some of the conclusions we draw. As noted in more detail below, in our revised manuscript, we will be more precise in the wording we use to characterize our findings, and we will be more explicit about what the measurements we are able to make allow us to conclude about the physiological role of the T6SS in the gut microbiome.
Reviewer #1 (Public review):
Summary:
In this study, the authors investigate the physiological role of the Type VI secretion system (T6SS) in a naturally evolved gut microbiome derived from wild mice (the WildR microbiome). Focusing on Bacteroides acidifaciens, the authors use newly developed genetic tools and strain-replacement strategies to test how T6SS-mediated antagonism influences colonization, persistence, and fitness within a complex gut community. They further show that the T6SS resides on an integrative and conjugative element (ICE), is distributed among select community members, and can be horizontally transferred, with context-dependent effects on colonization and persistence. The authors conclude that the T6SS stabilizes strain presence in the gut microbiome while imposing ecological and physiological constraints that shape its value across contexts.
This study is likely to have a significant impact on the microbiome field by moving experimental tests of T6SS function out of simplified systems and into a naturally co-evolved gut community. The WildR system, together with the strain replacement strategy, ICE-seq approach, and genetic toolkit, represents a powerful and reusable platform for future mechanistic studies of microbial antagonism and mobile genetic elements in vivo.
The datasets, including isolate genomes, metagenomes, and ICE distribution maps, will be a valuable community resource, particularly for researchers interested in strain-resolved dynamics, horizontal gene transfer, and ecological context dependence. Even where mechanistic resolution is incomplete, the work provides a strong experimental foundation upon which such questions can be directly addressed.
Overall, this study occupies a space between system building and mechanistic dissection. The authors demonstrate that the T6SS influences persistence and community structure in vivo, but the physiological basis of these effects remains unresolved. Interpreting the results as evidence of fitness costs or selective advantage, therefore, requires caution, as multiple ecological and host-mediated processes could produce similar abundance trajectories.
Placing the findings within the broader literature on microbial antagonism, particularly work emphasizing measurable costs, benefits, and tradeoffs, would help readers better contextualize what is directly demonstrated here versus what remains an open question. Viewed in this light, the principal contribution of the study is to show that such questions can now be addressed experimentally in a realistic gut ecosystem.
We thank the reviewer for this thoughtful summary of our study. We were glad to read they conclude our work will have a significant impact on the microbiome field and that the resources we have developed will be of value to the community.
Strengths:
A major strength of this study is that it directly interrogates the physiological role of the T6SS in a naturally evolved gut microbiome, rather than relying on simplified pairwise or in vitro systems. By working within the WildR community, the authors advance beyond descriptive surveys of T6SS prevalence and address function in an ecologically relevant context.
The authors provide clear genetic evidence that Bacteroides acidifaciens uses a T6SS to antagonize co-resident Bacteroidales, and that loss of T6SS function specifically compromises long-term persistence without affecting initial colonization. This temporal separation is well designed and supports the conclusion that the T6SS contributes to maintenance rather than establishment within the community.
Another strength is the identification of the T6SS on an integrative and conjugative element (ICE) and the demonstration that this element is distributed among, and exchanged between, community members. The use of ICE-seq to track distribution and transfer provides strong support for horizontal mobility and adds mechanistic depth to the study.
Finally, the transfer of the T6SS-ICE into Phocaeicola vulgatus and the observation of context-dependent colonization benefits followed by decline is a compelling result that moves the study beyond simple "T6SS is beneficial" narratives and highlights ecological contingency.
We appreciate this detailed and nuanced characterization of the strengths of our study.
Weaknesses:
Despite these strengths, there is a mismatch between the precision of the claims and the precision of the measurements, particularly regarding fitness costs, physiological burden, and the mechanistic role of the T6SS.
We acknowledge that in some places, our manuscript could benefit from greater precision in the language we use when linking the outcomes we observe in our study to their potential underlying causes. Specific revisions we propose to address this concern are described below.
First, while the authors conclude that the T6SS "stabilizes strain presence" and that its value is constrained by fitness costs, these costs are not directly measured. Persistence, abundance trajectories, and eventual loss are informative outcomes, but they do not uniquely identify fitness tradeoffs. Decline could arise from multiple non-exclusive mechanisms, including community restructuring, host-mediated effects, incompatibilities of the ICE in new hosts, or ecological retaliation, none of which are disentangled here.
We agree that multiple mechanisms could explain why P. vulgatus carrying a T6SS-encoding ICE declines over time. Our use of the term “fitness cost” to describe this trend was not meant to imply any particular underlying mechanism, but was rather our attempt to characterize the phenotypic outcome we observed in simplified terms. We note that ecological context is an important determinant of the fitness cost or benefit of any given trait, and our study sheds light on the importance of the presence of the WildR community and the mouse intestinal environment to the fitness contribution of the ICE to P. vulgatus. Nonetheless, to avoid implying an overly simplistic interpretation of our results, we propose to modify the language used in the manuscript when describing the contribution of the T6SS to species persistence in WildR-colonized mice.
Second, the manuscript frames the T6SS as having a defined physiological role, yet the data do not resolve which physiological processes are under selection. The experiments demonstrate that T6SS activity affects persistence, but they do not distinguish whether this occurs via direct killing, resource release, niche modification, or higher-order community effects. As a result, "physiological role" remains underspecified and risks being conflated with ecological outcome.
We acknowledge that our study does not fully resolve the physiological processes under selection that mediate role of the T6SS in maintaining B. acidifaciens populations in WildR-colonized mice. Indeed, several of the outcomes of T6SS activity the reviewer lists, such as target cell killing and nutrient release, are inextricably linked and thus inherently difficult to disentangle. We note that we did attempt to measure higher-order community effects of T6SS activity with metagenomic sequencing, but acknowledge that this approach may not have been sufficiently sensitive to detect small community shifts mediated by a relatively low-abundance species. To address the concern that our current framing implies more of a mechanistic understanding that our study achieves, we propose to substitute “ecological” for “physiological” where appropriate when summarizing our key findings.
Third, although the authors emphasize context dependence, the study offers limited quantitative insight into what aspects of context matter. Differences between native and recipient hosts, or between early and late colonization phases, are described but not mechanistically interrogated, making it difficult to generalize beyond the specific cases examined.
We are not entirely clear what the reviewer means by “differences between native and recipient hosts”, but we agree that additional quantitative studies will be needed to address the generalizability of our findings. Future studies are also needed to address the mechanistic basis for the difference in the benefit conferred by the T6SS that we observed between P. vulgatus and B. acidifaciens.
Fourth is the lack of engagement with recent experimental literature demonstrating functional roles of the T6SS beyond simple interference competition. While the authors focus on persistence and competitive outcomes, they do not adequately situate their findings within recent work demonstrating that T6SS-mediated antagonism can serve additional physiological functions, including resource acquisition and DNA uptake, thereby linking killing to measurable benefits and tradeoffs. The absence of this literature makes it difficult to place the authors' conclusions about physiological role and fitness cost within the current conceptual framework of the field. Without this context, the physiological interpretation of the results remains incomplete, and alternative functional explanations for the observed dynamics are underexplored.
We thank the reviewer for specifically highlighting the potential pertinence of this literature to our study. Indeed, we did not cite studies indicating a link between T6SS activity and the uptake of DNA and other resources released by targeted cells. As we note above, the release of intracellular contents from target cells is an inevitable consequence of the delivery of lytic effectors. Thus, distinguishing between fitness benefits conferred from the elimination of competitor species and those arising from scavenging the nutrients released during this process is not straightforward. Measuring the benefits deriving from the uptake of certain released molecules, such as DNA, was not immediately feasible in the system employed in this study and instead we focused on the direct lytic consequences of the effectors delivered via the T6SS. We will revise our Discussion to include reference to how downstream consequences of T6SS activity on target cells could impact the community, and thus the adaptive role of the T6SS in the microbiome.
A further limitation concerns the taxonomic scope of the functional analysis. The authors state that the role of the T6SS in the murine environment is functionally investigated using genetically tractable Bacteroides species, citing the lack of genetic tools for Mucispirillum schaedleri. While this is a reasonable, practical choice, it means that a substantial fraction of T6SS-encoding species in the WildR community are not experimentally interrogated. Consequently, conclusions about the role of the T6SS in the murine gut necessarily reflect the subset of taxa that are genetically accessible and may not fully capture community-level or niche-specific functions of T6SS activity. Given that M. schaedleri is represented as a metagenome-assembled genome, its isolation and genetic manipulation would be technically challenging. Nonetheless, explicitly acknowledging this limitation and slightly tempering claims of generality would strengthen the manuscript.
The reviewer points out that studying the T6SS activity in M. schadleri would potentially expand the generality of our claims. We agree that having an isolate of this species along with genetic tools for its manipulation would allow us to probe the importance of the T6SS in the gut microbiome more broadly. At the suggestion of the reviewer, we will add explicit mention for the need to develop such tools, an endeavor that lies outside of the scope of the current study.
Finally, several interpretations would benefit from more cautious language. In particular, claims invoking fitness costs, selective advantage, or physiological burden should be explicitly framed as inferences from persistence dynamics, rather than as direct measurements, unless supported by additional quantitative fitness or growth assays.
We agree with the reviewer that invoking fitness costs, selective advantages or physiological burdens should be done cautiously, and in our revised manuscript we will carefully re-evalute our usage of those terms. However, we would also argue invoking fitness costs and benefits when describe strain persistence dynamics in mice has substantial precedent in the literature ((Feng et al. 2020, Brown et al. 2021, Park et al. 2022, Segura Munoz et al. 2022), to list a handful of representative examples published by different groups). It is unclear to us what additional in vivo growth measurements could be taken to substantiate our claim that the T6SS provides a fitness benefit to B. acidifaciens during prolonged gut colonization, or that carrying the ICE imposes a fitness cost on P. vulgatus during long-term colonization. Our in vitro experiments evaluating the competitiveness conferred by T6SS activity provide a measure of insight into its fitness benefits, but as our in vivo strain persistence data and the work of many others show, in vitro measurements do not necessarily capture in vivo parameters.
Reviewer #2 (Public review):
Summary:
In this study, the authors set out to determine how a contact-dependent bacterial antagonistic system contributes to the ability of specific bacterial strains to persist within a complex, native gut community derived from wild animals. Rather than focusing on simplified or artificial models, the authors aimed to examine this system in a biologically realistic setting that captures the ecological complexity of the gut environment. To achieve this, they combined controlled laboratory experiments with animal colonization studies and sequencing-based tracking approaches that allow individual strains and mobile genetic elements to be followed over time.
Strengths:
A major strength of the work is the integration of multiple complementary approaches to address the same biological question. The use of defined but complex communities, together with in vivo experiments, provides a strong ecological context for interpreting the results. The data consistently show that the antagonistic system is not required for initial establishment but plays a critical role in long-term strain persistence. This insight that moves beyond traditional invasion-based views of microbial competition. The observation that transferable genetic elements can confer only temporary advantages, and may impose longer-term costs depending on community context, adds important nuance to current understanding of microbial fitness.
We thank the reviewer for the positive feedback and are glad they agree our study provides new insight into the role of interbacterial antagonism in natural communities.
Weaknesses:
Overall, there is not a lack of evidence, but a deliberate trade-off between ecological realism and mechanistic resolution, which leaves some causal pathways open to interpretation.
The reviewer makes a good point that the complexity of the experimental system we employ precludes some lines of experimentation that would yield more mechanistic information. As the reviewer notes, we were aware of the tradeoff between mechanistic resolution and ecological realism when selecting our experimental system. Our deliberate choice to favor biological complexity over mechanistic clarity in this study stemmed from our perception that a major gap in understanding of the T6SS and other antagonism pathways lies in defining their ecological function in complex microbial communities.
Reviewer #3 (Public review):
Summary:
Shen et al. investigate the contribution of the type VI secretion system of Bacteroidales in the gut microbiome assembly and targeting of closely related species. They demonstrate that B. acidifaciens relies on T6SS-mediated antagonism to prevent displacement by co-resident Bacteroidales and other members of the microbiome, allowing B. acidifaciens to persist in the gut.
Strengths:
Using a gnotobiotic model colonized with a wild-mouse microbiome is a significant strength of this study. This approach allows tracking of microbiome changes over time and directly examining targeting by Bacteroidales carrying T6SS in a more natural setting. The development of ICE-seq for mapping the distribution of the T6SS in the microbiome is remarkable, enabling the study of how this bacterial weapon is transferred between microbiome members without requiring long-read metagenomics methods.
We thank the reviewer for their enthusiasm toward our study.
Weaknesses:
Some conclusions are based on only four mice per condition. The author should consider increasing the sample size.
We agree that in some experiments it would be beneficial to increase the sample size from four mice. However, the experiments we performed for this study are time and resource intensive. Additionally, the experiments on which we base our primary conclusions were all independently replicated with similar results. Given these factors, we determined that the extra confidence that might be afforded by increasing our sample size did not merit the delay in publication and investment in resources that would be required.
Overall, the authors successfully achieved their objectives, and their experimental design and results support their findings. As mentioned in the discussion, it would be important to investigate the role of the T6SS in resilience to disturbances in the microbiome, such as antibiotics, diet, or pathogen invasion. This work represents a step forward in understanding how contact-dependent competition influences the gut microbiome in relevant ecological contexts.
We agree that investigating the role of the T6SS during perturbations of the microbiome is a key next step for this work and thank the reviewer for highlighting this important future direction.
References
Brown, E. M., H. Arellano-Santoyo, E. R. Temple, Z. A. Costliow, M. Pichaud, A. B. Hall, K. Liu, M. A. Durney, X. Gu, D. R. Plichta, C. A. Clish, J. A. Porter, H. Vlamakis and R. J. Xavier (2021). "Gut microbiome ADP-ribosyltransferases are widespread phage-encoded fitness factors." Cell Host Microbe 29(9): 1351-1365 e1311.
Feng, L., A. S. Raman, M. C. Hibberd, J. Cheng, N. W. Griffin, Y. Peng, S. A. Leyn, D. A. Rodionov, A. L. Osterman and J. I. Gordon (2020). "Identifying determinants of bacterial fitness in a model of human gut microbial succession." Proc Natl Acad Sci U S A 117(5): 2622-2633.
Park, S. Y., C. Rao, K. Z. Coyte, G. A. Kuziel, Y. Zhang, W. Huang, E. A. Franzosa, J. K. Weng, C. Huttenhower and S. Rakoff-Nahoum (2022). "Strain-level fitness in the gut microbiome is an emergent property of glycans and a single metabolite." Cell 185(3): 513-529 e521.
Segura Munoz, R. R., S. Mantz, I. Martinez, F. Li, R. J. Schmaltz, N. A. Pudlo, K. Urs, E. C. Martens, J. Walter and A. E. Ramer-Tait (2022). "Experimental evaluation of ecological principles to understand and modulate the outcome of bacterial strain competition in gut microbiomes." ISME J 16(6): 1594-1604.
La Bienveillance en Milieu Scolaire : Enjeux, Défis et Pratiques Professionnelles
Ce document synthétise les échanges issus d'une table ronde portant sur le concept de bienveillance à l'école.
Loin d'être synonyme de laxisme ou de complaisance, la bienveillance est définie comme une condition essentielle de l'équité et de l'efficacité du système éducatif, particulièrement pour les élèves les plus vulnérables.
Elle repose sur une tension constructive entre exigence et soutien, visant le développement à long terme de l'élève.
Sa mise en œuvre nécessite une clarification conceptuelle pour lever les résistances professionnelles, l'adoption de gestes professionnels spécifiques (feedback positif, écoute active) et une réinvention des espaces et des modalités d'évaluation.
En somme, la bienveillance est un levier de réussite qui engage tant la posture individuelle de l'enseignant que la stratégie collective de l'établissement.
--------------------------------------------------------------------------------
La bienveillance en éducation souffre souvent de représentations simplistes ou erronées. Il est nécessaire d'en préciser les contours épistémologiques :
• Étymologie et intention : Littéralement, la bienveillance consiste à « vouloir du bien à autrui ».
C'est une disposition favorable qui vise la réussite et la réalisation personnelle de l'autre.
• Temporalité (Court terme vs Long terme) : La bienveillance peut impliquer de sacrifier le confort immédiat pour le bien de l'élève à long terme.
Ainsi, la fermeté, l'exigence ou même une sanction peuvent être des actes bienveillants s'ils sont explicités et pratiqués dans le respect de l'élève.
• Distinction fondamentale : Elle ne doit pas être confondue avec :
• Cadre institutionnel : La notion est devenue une valeur centrale de l'Éducation nationale depuis la circulaire de 2014, bien qu'elle fût déjà présente dans le secteur privé et les services publics.
La DGESCO (2013) l'associe à un ensemble d'attitudes physiques, morales et psycho-affectives positives et constantes (respect, confiance, encouragement).
--------------------------------------------------------------------------------
Malgré un consensus apparent, le terme suscite des tensions sur le terrain :
| Type de résistance | Argumentation observée | | --- | --- | | Sentiment de jugement | Certains enseignants perçoivent l'injonction à la bienveillance comme une critique de leurs pratiques passées, sous-entendant qu'ils ne l'auraient pas été auparavant. | | Opposition à l'exigence | Une crainte que l'attention portée au bien-être des élèves ne se fasse au détriment de l'effort nécessaire à la réussite académique. | | Crise de l'autorité | La bienveillance est parfois vue comme une entrave à l'autorité face à des manquements disciplinaires chroniques. | | Complexité systémique | La multiplication des élèves à besoins éducatifs particuliers (EBEP) met les équipes sous pression, rendant la posture bienveillante difficile à maintenir sans formation adéquate. |
--------------------------------------------------------------------------------
La bienveillance se traduit par des actes concrets et une posture éthique dans la relation pédagogique :
La puissance du Feedback
Le levier le plus efficace pour la réussite des élèves est le feedback positif. Il doit être :
• Centré sur l'activité et la méthodologie de l'élève.
• Formulé chaleureusement.
• Porteur de confiance et d'espoir dans les capacités de l'élève.
Le professionnel bienveillant doit être attentif aux signes de fragilité qui peuvent mener au décrochage :
• Signes de découragement ou discours négatif sur l'école.
• Absentéisme et arythmies.
• Sentiments d'insécurité (peur de prendre la parole, honte).
• Mutisme, isolement ou passages fréquents à l'infirmerie/vie scolaire.
Une communication renouvelée
L'horizontalité et l'authenticité sont cruciales pour les nouvelles générations :
• Passer d'un rôle purement académique à une relation de personne à personne.
• Pratiquer l'écoute active (savoir se taire pour laisser l'élève s'exprimer).
• Faire preuve de transparence et de prévisibilité.
--------------------------------------------------------------------------------
L'évaluation est une source majeure de stress (environ 60 % des élèves se disent angoissés par les évaluations). Une évaluation bienveillante implique :
• La suppression de l'implicite.
• Le droit à l'erreur et à la remédiation (possibilité de recommencer).
• Un cadre rassurant qui ne sacrifie pas l'exigence intellectuelle.
La lutte contre le harcèlement (Programme PHARE)
La bienveillance s'incarne dans la création d'une « communauté protectrice » :
• Utilisation de la méthode de la « préoccupation partagée ».
• Recherche d'alternatives à la sanction punitive immédiate pour l'intimidateur, en visant le développement de compétences psychosociales.
La bienveillance passe par une réflexion sur le cadre de vie :
• Création de « jardins zen » ou de salles de calme.
• Réinvention des salles d'étude (espaces de coworking, possibilité de travailler debout ou dans des fauteuils).
• Mise en place de dispositifs permettant le mouvement (ballons, vélos-bureaux) pour favoriser la concentration, notamment des élèves hyperactifs.
--------------------------------------------------------------------------------
La bienveillance ne doit pas être une initiative isolée mais une stratégie d'établissement.
• Le rôle du diagnostic : Utiliser l'auto-évaluation (domaine du climat scolaire et du bien-être) pour identifier les besoins réels des élèves et des familles, en évitant les solutions préconçues.
• La Qualité de Vie au Travail (QVT) : Il existe un lien direct entre le bien-être des personnels et celui des élèves. Un encadrement bienveillant (feedback positif du chef d'établissement, convivialité, confiance déléguée) favorise l'engagement des équipes.
• L'éthique de la rencontre : S'intéresser à la singularité de ce que vit l'élève, au-delà de ses difficultés scolaires. Comme le souligne la sociologie, l'éducation par la rencontre est un levier de raccrochage puissant.
• Le partage et la convivialité : Des actions simples, comme le partage de nourriture (fruits en libre-service, repas de Noël partagé entre agents, élèves et chefs étoilés), peuvent transformer radicalement la relation sociale au sein d'un établissement.
L'autorité et la bienveillance sont compatibles. L'autorité s'exerce de manière éthique lorsqu'elle respecte l'intégrité morale de l'élève.
La sincérité de l'adulte, y compris dans l'expression de ses propres limites ou l'admission d'une erreur, renforce paradoxalement sa légitimité auprès des jeunes.
RRID:SCR_016501
DOI: 10.1016/j.molcel.2026.01.022
Resource: cryoSPARC (RRID:SCR_016501)
Curator: @scibot
SciCrunch record: RRID:SCR_016501
RRID:SCR_000432
DOI: 10.1016/j.immuni.2026.01.011
Resource: RStudio (RRID:SCR_000432)
Curator: @scibot
SciCrunch record: RRID:SCR_000432
L’Évolution du Rôle Paternel : Fondements Biologiques, Neurobiologiques et Sociaux
Ce document analyse la transformation du rôle des pères à travers le prisme de l'anthropologie évolutionniste et des neurosciences.
Contrairement aux autres grands singes africains où le soin paternel est quasi inexistant, l'être humain a développé une capacité unique de "coopérative breeding" (élevage coopératif).
Cette évolution, dictée par les contraintes climatiques du Pléistocène et l'augmentation massive du volume cérébral des nourrissons, a nécessité l'implication des pères et d'autres membres du groupe pour assurer la survie de l'espèce.
Les recherches récentes démontrent que les hommes disposent de circuits neuronaux et hormonaux ancestraux, partagés avec d'autres vertébrés, qui s'activent lors d'un contact prolongé et intime avec le nouveau-né.
L'éloignement historique des pères du soin direct est identifié non pas comme une barrière biologique, mais comme une construction sociale datant de la révolution néolithique.
La réengagement des pères aujourd'hui présente des bénéfices psychologiques et physiologiques majeurs, tant pour l'enfant que pour le parent.
--------------------------------------------------------------------------------
Dans la lignée des grands singes africains dont l'humain descend, le soin des nourrissons est traditionnellement l'apanage exclusif des mères.
Chez la plupart des 5 500 espèces de mammifères, l'investissement mâle est rare, limité souvent aux espèces monogames où la certitude de paternité est élevée.
L'émergence du soin paternel humain s'enracine dans les conditions extrêmes du Pléistocène en Afrique :
• Contraintes environnementales : Un climat devenant plus frais et sec, marqué par des précipitations instables.
• Le coût du cerveau : Le cerveau humain a triplé de volume, passant de 900 cm³ chez Homo erectus à 1 350 cm³ chez Homo sapiens.
• La dépendance du nourrisson : Les bébés humains sont les plus "coûteux" de la planète en termes de ressources et de temps de maturation.
Une mère seule ne pouvait assurer leur survie sans aide extérieure (soins alloparentaux et paternels).
--------------------------------------------------------------------------------
Les pères ne sont pas biologiquement "désarmés" face aux soins des nourrissons ; ils possèdent un équipement physiologique latent qui s'active sous certaines conditions.
Lorsqu'un père s'occupe activement d'un bébé, son profil hormonal se modifie de manière significative :
• Prolactine : Les niveaux augmentent, favorisant les réponses de soin (une hormone originellement liée à la lactation chez la mère).
• Ocytocine : Des poussées de cette "hormone du lien" sont observées chez les pères impliqués.
• Testostérone : On observe une diminution du taux de testostérone, facilitant une attitude plus douce et attentive.
Une étude de 2014 (Ruth Feldman et son équipe) a révélé des données cruciales sur les pères agissant comme soignants principaux :
• Activation de l'amygdale : Chez les pères en contact prolongé et intime avec leur bébé dès la naissance, l'activation de l'amygdale (zone liée à la vigilance et au soin maternel) est quatre fois supérieure à celle des pères n'apportant qu'une aide secondaire.
• Anciens circuits : Ces circuits neuronaux sont hautement conservés et se trouvent dans des zones primitives du cerveau (hypothalamus), similaires à celles activées chez les mères.
| Hormone / Zone | Effet chez le père impliqué | | --- | --- | | Prolactine | Augmentation des réponses de soin et d'attention. | | Ocytocine | Renforcement du lien affectif et de l'affiliation. | | Testostérone | Diminution des niveaux circulants. | | Amygdale | Vigilance accrue et réaction immédiate aux besoins du bébé. |
--------------------------------------------------------------------------------
L'anthropologie évolutionniste suggère que les capacités de soin mâle sont bien plus anciennes que les mammifères eux-mêmes.
• L'héritage des poissons : Il y a 400 millions d'années, certains poissons mâles pratiquaient déjà le soin des œufs (ex: le cichlidé du Tanganyika ou le poisson-mâchoire qui porte sa progéniture dans sa bouche).
• La plasticité de la Prolactine : À l'origine, cette hormone servait à réguler l'équilibre hydrique chez les organismes aquatiques avant d'être "réutilisée" par l'évolution pour les fonctions de reproduction et de soin.
• Conservation génétique : Les gènes responsables de la production de molécules comme l'isotocine chez les poissons sont les précurseurs directs de l'ocytocine chez les mammifères.
--------------------------------------------------------------------------------
Si la biologie prédispose les hommes au soin, l'histoire récente a créé une rupture.
L'adoption de l'agriculture et de l'élevage a transformé les structures sociales :
• Apparition de la propriété : La nécessité de protéger les terres et les troupeaux a favorisé l'émergence de sociétés patriarcales.
• Redéfinition de la masculinité : L'identité masculine s'est déplacée vers la protection des institutions, du statut et de la propriété, éloignant physiquement les hommes de la sphère domestique et des nourrissons.
• Institutions patrilinéaires : Ces structures ont perduré jusqu'à l'époque moderne, excluant souvent les femmes et confinant les hommes à des rôles de pourvoyeurs distants.
Le nourrisson humain a lui-même évolué pour encourager ce soin. Dès son plus jeune âge, le bébé utilise son cortex préfrontal médial pour :
• Monitorer son entourage.
• Apprendre à s'ingratiatier et attirer l'attention.
• Compétiter pour obtenir des soins alloparentaux par son attrait physique et comportemental.
--------------------------------------------------------------------------------
Le réengagement des pères dans les soins primaires n'est pas seulement un retour à une nécessité biologique ancienne, mais un levier de santé publique.
• Santé mentale et longévité : Les relations de soin augmentent l'espérance de vie et réduisent les risques de dépression.
• Lutte contre les addictions : Les circuits de la récompense (dopamine) activés par l'amour parental sont les mêmes que ceux sollicités par les drogues.
Un engagement profond envers un enfant pourrait agir comme un protecteur contre les "décès par désespoir" et les addictions.
• Sens et finalité : Le soin direct apporte un sentiment immédiat d'utilité et de but, contrecarrant la solitude et l'aliénation sociale.
"Les mâles d'aujourd'hui, lorsqu'ils sont en contact suffisant et en proximité intime prolongée avec les bébés, possèdent l'équipement nécessaire. Ils sont aussi équipés pour s'occuper des bébés que les mères le sont."
FLT3 D835 Mutations Confer Differential Resistance to Type II FLT3 Inhibitors
[Paper-level Aggregated] PMCID: PMC4675689
Evidence Type(s): Oncogenic, Predictive, Functional
Justification: Oncogenic: The D835 mutations are reported to cause FLT3 TKI resistance in patients, indicating their role in tumorigenesis and cancer progression. Predictive: The study suggests that specific D835 mutations can predict the level of resistance to type II FLT3 inhibitors, which can inform treatment decisions. Functional: The text discusses the functional implications of D835 mutations on the stability of the DFG-out conformation and their impact on inhibitor binding, demonstrating the functional consequences of these mutations.
Gene→Variant (gene-first): FLT3(2322):D835 FLT3(2322):D835A/E FLT3(2322):D835H FLT3(2322):D835V/Y FLT3(2322):D835E/N FLT3(2322):D835N/E FLT3(2322):D835Y/V
Genes: FLT3(2322)
Variants: D835 D835A/E D835H D835V/Y D835E/N D835N/E D835Y/V
We profiled all D835 substitutions previously reported to cause FLT3 TKI resistance in patients, as well as D835 mutations occurring in patients as cataloged in the Sanger COSMIC database or the Cancer Genome Atlas. Inhi
[Paragraph-level] PMCID: PMC4675689 Section: RESULTS PassageIndex: 2
Evidence Type(s): Predictive, Oncogenic
Justification: Predictive: The passage discusses how various D835 substitutions correlate with resistance to FLT3 inhibitors, indicating their predictive value regarding treatment response. Oncogenic: The D835 mutations are reported to cause resistance in patients, suggesting that these somatic variants contribute to tumor development or progression.
Gene→Variant (gene-first): 2322:D835 2322:D835A/E 2322:D835H 2322:D835V/Y
Genes: 2322
Variants: D835 D835A/E D835H D835V/Y
CUCA.- (Violenta.) Me voy. Estás jugando sucio. LALO.- Hay que llegar hasta el final. CUCA.- No puedo permitirte... LALO.- Tú también has tratado de aprovecharte. CUCA.- Lo que has hecho es imperdonable. Cada uno a su parte; fue lo convenido. LALO.- ¿No me digas? Y tú, por si las moscas...
Salen de personaje y se reclaman cosas
LALO.- (Prosigue, como hipnotizado.) Un día, jugando con mis hermanas, de repente, descubrí... CUCA.- (Como un fiscal. Con súbito interés por la divagación de LALO.) ¿Qué descubrió? LALO.- (En el tono anterior.) Estábamos en la sala; no, miento... Estábamos en el último cuarto. Jugábamos... Es decir, representábamos... (Sonríe como un idiota.) A usted le parecerá una bobería, sin embargo... Yo era el padre. No, mentira. Creo que en ese momento era la madre. ¡Todo un juego!... (Otro tono.) Pero, allí, en ese instante, llegó hasta mí esa idea... (Vuelve a sonreír como un idiota.)
Representar, actuar como juego - Teatro y metateatro
Document de Synthèse : Le Programme EVARS – Enjeux, Histoire et Mise en Application
L’adoption à l’unanimité du programme EVARS (Éducation à la Vie Affective, Relationnelle et Sexuelle) par le Conseil supérieur de l’éducation le 3 février 2025 marque un tournant historique dans le système éducatif français.
Fruit de plus de 50 ans de luttes et d'évolutions législatives, ce programme vise à institutionnaliser une éducation complète à la sexualité, de la maternelle à la terminale.
L'objectif central est de transformer une obligation légale souvent négligée — la loi Aubri de 2001 prévoyant trois séances annuelles — en une réalité pédagogique concrète.
Les enjeux sont multiples : prévention des violences sexuelles (touchant statistiquement trois enfants par classe), lutte contre les stéréotypes de genre, promotion du consentement et déconstruction des représentations toxiques issues notamment de la pornographie.
Malgré cette victoire institutionnelle, la mise en œuvre se heurte à des défis persistants : une désinformation active de mouvements traditionalistes, un manque de formation des personnels et des contraintes de financement.
La réussite du programme repose désormais sur une synergie entre l'institution scolaire, les associations expertes et l'implication des familles.
--------------------------------------------------------------------------------
L'éducation à la sexualité n'est pas un concept récent, mais son approche a radicalement évolué, passant d'une logique de contrôle à une logique d'émancipation.
• Fin du XIXe siècle : Apparition des premiers textes, oscillant entre la préservation de l'innocence enfantine et des impératifs de santé publique (lutte contre la syphilis et enjeux démographiques).
• 1947-1948 : Le rapport de l'inspecteur général François marque la première prise en compte institutionnelle de la nécessité d'une éducation à la sexualité.
• 1973 : Une circulaire fondamentale distingue l'information sexuelle (reproduction, assurée par les SVT) de l'éducation à la sexualité (dimension affective et sociale).
• 1998 : Sous l'impulsion de Jack Lang, la circulaire "Toutmonde" met l'accent sur la prévention du sida.
• 4 juillet 2001 (Loi Aubri/Péri) : La loi rend obligatoires trois séances d'éducation à la sexualité par an à chaque niveau de classe.
Cependant, dans les faits, seuls 15 à 20 % des élèves en bénéficient réellement.
• Le programme adopté en 2025 remplace des initiatives plus fragiles ou contestées comme les "ABCD de l'égalité" (2013).
• Il s'inscrit dans un cadre européen standardisé, nommant l'enseignement "Éducation à la vie affective et relationnelle" (EVAR) pour le premier degré et y ajoutant le terme "Sexuelle" (EVARS) pour le second degré afin d'apaiser les craintes parentales.
--------------------------------------------------------------------------------
Le programme repose sur trois piliers de compétences : se connaître et vivre avec son corps, construire des relations épanouies, et trouver sa place dans la société en tant que citoyen libre et responsable.
• Constat alarmant : Selon la CIIVISE, 160 000 enfants sont victimes de violences sexuelles chaque année, soit environ trois enfants par classe.
• Rôle de l'école : L'éducation permet de nommer les parties du corps (brisant le tabou de la "zette" ou du sexe), d'identifier l'intimité et d'apprendre à dénoncer les attouchements.
• Protection : L'absence de mots et une pudeur excessive favorisent les agresseurs. Le programme EVARS apprend aux enfants qu'ils ont le droit de dire "non".
• Impact du numérique : 73 % des adolescents garçons sont exposés en ligne à des stéréotypes de domination masculine (données d'octobre 2025).
• Déconstruction : Le programme vise à libérer les garçons de l'injonction à la violence ou à la répression émotionnelle ("apprendre à pleurer avant d'apprendre les armes") et les filles de l'intériorisation de la soumission.
• En l'absence d'éducation formelle, la pornographie devient la source principale d'information, véhiculant des modèles relationnels faussés et violents dès le CM1.
• L'EVARS offre un cadre clinique et serein pour aborder des sujets complexes sans jugement.
--------------------------------------------------------------------------------
Des associations comme En avant Toute(s) déploient des interventions concrètes (du CE2 à la 5e) :
• Méthodologie : Utilisation de l'éducation populaire (débats, théâtre-forum, jeux de cartes) pour partir de la parole de l'élève.
• Non-mixité : Des temps séparés entre filles et garçons sont parfois utilisés pour favoriser la libération de la parole sur les violences vécues avant une mise en commun.
• Outils pratiques : Création de "réseaux de soutien" où l'enfant identifie les adultes ressources en cas de problème.
• Formation : Il existe un besoin impérieux de former les enseignants via les INSPÉ pour leur donner la confiance nécessaire face aux sujets "sensibles".
• Statut des heures : Si les séances sont obligatoires, elles ne sont pas toujours intégrées aux programmes évalués, ce qui complexifie leur financement (nécessité de dotations horaires pour les heures supplémentaires dans le secondaire).
• Restriction des intervenants : Une circulaire limite l'intervention des associations dans les écoles primaires, laissant la charge aux seuls enseignants, ce qui peut freiner la mise en œuvre faute d'expertise externe.
• L'école fait face à une "hystérie collective" ou des rumeurs persistantes (accusations infondées d'apprendre la masturbation aux jeunes enfants).
• Des groupes traditionalistes et des mouvements d'extrême droite s'organisent pour délégitimer le programme, utilisant des plateformes médiatiques pour diffuser de la désinformation.
--------------------------------------------------------------------------------
| Axe d'effort | Actions préconisées | | --- | --- | | Transparence | Rendre les programmes consultables par tous les parents sur Éduscol pour désamorcer les fantasmes. | | Implication parentale | Organiser des "cafés des parents" et les inciter à porter la demande d'EVARS dans les conseils d'école. | | Soutien aux enseignants | Assurer la protection institutionnelle des professeurs face aux menaces de groupes radicaux. | | Synergie associative | Maintenir le rôle des associations agréées qui apportent une expertise complémentaire et une posture d'adulte neutre. | | Élargissement | Étendre ces formations au secteur périscolaire et aux établissements spécialisés (IME, CFA). |
Le programme EVARS n'est pas une menace pour les familles, mais un "cadeau pour les générations futures".
En enseignant le respect, le consentement et l'empathie au même titre que la grammaire ou les mathématiques, l'école remplit sa mission fondamentale : former des citoyens lucides, capables d'aimer sans posséder et de s'affirmer sans écraser.
La réussite de ce projet repose sur le passage définitif de la "pudeur à la pédagogie".
Briefing Doc : "Le parcours de l'élève au périscope" Source : Excerpts from the radio show "Le parcours de l'élève au périscope"
Date de diffusion : 11 mars 2025
Participants :
Raphaël Mata Duvignot : Présentateur de la minute juris
Thème principal : Le parcours de l'élève, ses enjeux, les dispositifs d'accompagnement, les inégalités et les perspectives.
Structure de l'émission (d'après l'extrait) :
Enjeux autour du parcours de l'élève : Définition, étapes clés, accompagnement du système éducatif, objectifs au-delà de l'insertion professionnelle, influence du territoire et position de la recherche.
Minute Juris : Présentation des cadres légaux et administratifs du parcours de l'élève (socle commun, redoublement, orientation, classes et groupes spécifiques).
Témoignages de terrain (Table ronde) : Expériences dans le premier et second degré, forces du système, enjeux territoriaux, discriminations, découverte des métiers, inclusion des élèves en situation de handicap, formation des enseignants et partenaires.
Minute Bibli : Présentation de ressources bibliographiques.
Principaux thèmes et idées clés :
1. Définition et complexité du parcours de l'élève :
Le parcours de l'élève englobe "tout ce qu'un élève va vivre à l'intérieur de l'école à l'extérieur de l'école pour se construire réussir son orientation et arriver à une insertion professionnelle la meilleure possible." (Jean-Marc Moulet)
Il existe une distinction avec les "parcours éducatifs" (réforme de 2008) qui sont plus axés sur les éducations transversales, au sein desquels figure le "parcours avenir", central pour l'orientation au collège.
Le parcours est différencié selon les niveaux (primaire, collège, lycée), avec des dispositifs spécifiques pour accompagner les difficultés (plans personnalisés au primaire, SEGPA au collège, spécialisations au lycée).
Au lycée (surtout professionnel), l'éventail des parcours s'élargit avec des secondes thématiques et des possibilités d'approfondissement ou d'immersion professionnelle en terminale.
Le lycée général et technologique offre une multiplication des choix de disciplines et de couplages.
2. Objectifs multiples du parcours :
L'objectif n'est pas uniquement l'insertion professionnelle, mais aussi la "fabrication de citoyens qui soient heureux" et la "diversification des possibles". (Jean-Marc Moulet)
Il s'agit de lutter contre le déterminisme social et les pressions de genre en élargissant le "panel des possibles" pour que les élèves se révèlent dans ce qui est le meilleur pour eux.
3. Personnalisation et choix :
4. Influence du territoire et mobilité :
L'information sur l'orientation est déléguée aux régions (loi de 2018) pour tenir compte des enjeux économiques locaux et favoriser la mobilité régionale.
La mobilité des élèves est centrale, et informer sur les opportunités régionales peut engager certains élèves à s'y orienter.
Les projets éducatifs de territoire (PEDT) sont des leviers importants pour lutter contre les inégalités culturelles et favoriser la mobilité dès le primaire.
Des initiatives comme les cordées de la réussite et les internats d'excellence visent à pallier les inégalités territoriales et à élever les ambitions des élèves.
5. Le regard de la recherche : Inégalités et déterminismes :
La notion de parcours renvoie aux "périodes charnières" (aménagements précoces, premiers paliers d'orientation en 3ème et seconde). (Noémie Olympio)
Malgré la volonté d'uniformité (tronc commun), le système est marqué par des "éléments d'inégalité" et un fort "déterminisme scolaire et social des trajectoires".
La performance scolaire en fin de primaire est un bon prédicteur des possibilités futures. L'orientation est socialement marquée (à performance égale, un enfant de parents diplômés du supérieur a plus de chances de faire un bac général).
Les données de la DEP (panel d'élèves) montrent l'importance du "capital informationnel des familles", du "niveau d'aspiration des familles" et du "maintien des aspirations" (phénomène de "refroidissement des aspirations" parfois non lié à la performance scolaire).
La "représentation de l'utilité des diplômes" est également inégalement répartie et corrélée à la résilience scolaire.
Le système actuel, avec des aménagements précoces (comme la SEGPA), peut rendre les trajectoires "peu réversibles" et socialement marquées.
Le "capital informationnel" se constitue par la catégorie socio-professionnelle, la représentation du monde, le rapport à la mobilité et les "stratégies éducatives des parents" (plus ou moins "opérantes").
6. Cadre légal et administratif (Minute Juris) :
L'article L 111-1 du code de l'éducation garantit l'organisation des parcours en fonction des élèves.
Le socle commun de connaissances, de compétences et de culture (défini par la loi de 2005 et refondé en 2013) est au cœur du système et évalué à la fin de chaque cycle.
Le redoublement est un dispositif rare et exceptionnel (codifié à l'article L 31-7), privilégiant des stratégies de prévention et d'accompagnement.
Il est interdit en maternelle. La décision fait l'objet d'un dialogue avec les familles et peut être contestée.
L'orientation scolaire (articles L331-7 et D331-31) est encadrée par des voies définies par arrêté ministériel et implique un dialogue entre familles et équipes pédagogiques. En cas de désaccord, une procédure de recours existe.
Des classes et groupes spécifiques (article D 332-5), comme les SEGPA (article D 332-7) et les ULIS (article L12-1), permettent un parcours différencié pour répondre aux besoins des élèves, y compris en situation de handicap.
La différence de traitement basée sur les besoins n'est pas considérée comme une rupture d'égalité.
7. Témoignages de terrain et solutions :
Les parcours diffèrent déjà au primaire en fonction du territoire et des projets menés (y compris le temps périscolaire). La distance au collège et au lycée impacte également les parcours.
Les projets éducatifs de territoire (PEDT) et le regroupement de collectivités sont essentiels pour offrir des opportunités culturelles et de mobilité.
Les cordées de la réussite lient les collèges à des grandes écoles pour susciter l'ambition. Les internats d'excellence lèvent l'obstacle de la distance.
Les campus des métiers d'excellence (CMQ) favorisent la mobilité et le lien avec l'économie des territoires, en produisant des ressources pour les collèges (jeux, plateformes numériques, accueil).
Il est crucial de travailler sur l'ouverture du champ des possibles et le capital informationnel sans paternalisme, en s'appuyant sur des données fiables (taux d'employabilité, mobilité professionnelle).
La découverte des métiers dès la 5ème (voire plus tôt, comme dans les pays anglo-saxons) est essentielle pour contrer les déterminismes.
La rencontre avec des professionnels a un impact déterminant (l'exemple d'une heure d'intervention d'une scientifique sur l'orientation des filles).
Des actions locales (forums des métiers, visites d'entreprises, mini-stages, stages de seconde) permettent aux élèves de découvrir la diversité des professions.
Le soutien au parcours dans les lycées professionnels (ateliers CV, rencontres avec des professionnels et anciens élèves) vise à faciliter l'insertion et la poursuite d'études.
Le parcours différencié en fin d'année permet des stages de professionnalisation ou des ateliers de préparation à la vie étudiante.
8. Inclusion des élèves en situation de handicap :
La mobilité est un enjeu crucial, nécessitant des outils spécifiques (applications d'aide au déplacement).
L'ambition pour ces élèves doit être élevée (faible taux en lycée général et technologique). Il existe un "plafond de verre" à faire sauter.
Les universités et grandes écoles développent une forte dynamique inclusive (référents handicap, aménagements). La convention "A tout pour tous" à Toulouse et les initiatives pour les étudiants avec TSA sont des exemples.
Des plateformes d'accompagnement à l'inclusion professionnelle sont mises en place.
La connaissance des dispositifs par les enseignants est fondamentale. L'action "Enseignement supérieur et handicap, c'est possible" vise à informer.
9. Formation des enseignants et partenaires :
Les psychologues de l'Éducation nationale et les CIO ont un rôle central.
Il est important d'associer les médecins de l'Éducation nationale pour anticiper les contre-indications dans certaines filières professionnelles.
La région (information, orientation mobile), l'ONISEP (compétences à s'orienter, plateforme "Avenir"), les professeurs principaux et les DDFPT (en lycée professionnel) sont des partenaires clés.
Le travail en équipe et en réseau (campus des métiers et des qualifications) est essentiel.
Il faut renforcer les partenariats entre le collège et le lycée, ainsi qu'avec l'enseignement supérieur (continuum Bac-3 / Bac+3).
La gestion algorithmique de l'orientation peut alimenter l'autocensure, nécessitant une meilleure explicitation des stratégies et des accompagnements pour les élèves les moins favorisés.
Le bureau des entreprises dans les lycées professionnels renforce le lien avec le monde du travail. Le réseau associatif peut apporter une expertise complémentaire.
Il est important de lier le stage de seconde aux expériences vécues au collège.
Conclusion et perspectives (Jean-Marc Moulet) :
Le système éducatif évolue pour faciliter et mieux accompagner les parcours, en aidant les familles les plus fragiles.
L'objectif ne doit pas être uniquement l'insertion professionnelle, mais aussi la formation à la mobilité professionnelle et à la plasticité face aux évolutions du marché du travail.
La question du décrochage scolaire, souvent lié à des difficultés d'orientation, pourrait faire l'objet d'une prochaine table ronde.
Ressources bibliographiques (Minute Biblie) :
Rapport de l'Inspection générale sur la découverte des métiers au collège (mai 2024).
Articles de Noémie Olympio sur l'orientation en lycée professionnel, les aspirations et le capital social et culturel.
Site de l'ONISEP et plateforme "Avenir".
Author response:
The following is the authors’ response to the previous reviews
Recommendations for the authors:
Reviewer #1 (Recommendations for the authors):
The authors have adequately addressed all of my concerns. I have no further questions or concerns.
We thank the Reviewer #1.
Reviewer #2 (Recommendations for the authors):
We thank the Reviewer #2 for thoughtful recommendations.
(1) Figure 1A, 1B, 2B, 2C, etc.: The Y-axis label is confusing. I assume the intention was to make big numbers small by dividing by 1000. The comma makes the label confusing. Perhaps, make the label more "mathematical" as in "Avp density ((transcript/µm2) * 10-3)" or rearrange the math to be clearer as in "Avp density (transcript/1000 per µm2)".
Great suggestion and done exactly as suggested in Figures 1, 2 and 4.
(2) Figure 1B and 1C: The figure and legend do not match up. Either switch the figures or the legends. Currently, legend 1B describes image 1C.
Agreed and done as suggested.
(3) Figure 2A is broken up into separate pages/panels. It could be integrated better or separated to make A and B, then shift B and C to C and D.
Great suggestion and we have done exactly as suggested.
(4) Figure 2 legend: I recommend putting the scale bar info with (A) rather than at the end. The stars used in the figure are not explained in the legend.
Good points. We have made all necessary changes as suggested.
(5) Supplementary Figure 1B: The legend states that the data are the number of transcript-containing cells, but the figure states transcript number.
We thank the Reviewer for pointing out this typo. We corrected all graph legends in the Supplementary Figure 1.
Author response:
The following is the authors’ response to the original reviews.
Public Reviews:
Reviewer #1 (Public review):
Summary:
Review of the manuscript titled " Mycobacterial Metallophosphatase MmpE acts as a nucleomodulin to regulate host gene expression and promotes intracellular survival".
The study provides an insightful characterization of the mycobacterial secreted effector protein MmpE, which translocates to the host nucleus and exhibits phosphatase activity. The study characterizes the nuclear localization signal sequences and residues critical for the phosphatase activity, both of which are required for intracellular survival.
Strengths:
(1) The study addresses the role of nucleomodulins, an understudied aspect in mycobacterial infections.
(2) The authors employ a combination of biochemical and computational analyses along with in vitro and in vivo validations to characterize the role of MmpE.
Weaknesses:
(1) While the study establishes that the phosphatase activity of MmpE operates independently of its NLS, there is a clear gap in understanding how this phosphatase activity supports mycobacterial infection. The investigation lacks experimental data on specific substrates of MmpE or pathways influenced by this virulence factor.
We thank the reviewer for this insightful comment and agree that identification of the substrates of MmpE is important to fully understand its role in mycobacterial infection. MmpE is a putative purple acid phosphatase (PAP) and a member of the metallophosphoesterase (MPE) superfamily. Enzymes in this family are known for their catalytic promiscuity and broad substrate specificity, acting on phosphomonoesters, phosphodiesters, and phosphotriesters (Matange et al., Biochem J, 2015). In bacteria, several characterized MPEs have been shown to hydrolyze substrates such as cyclic nucleotides (e.g., cAMP) (Keppetipola et al., J Biol Chem, 2008; Shenoy et al., J Mol Biol, 2007), nucleotide derivatives (e.g., AMP, UDP-glucose) (Innokentev et al., mBio, 2025), and pyrophosphate-containing compounds (e.g., Ap4A, UDP-DAGn) (Matange et al., Biochem J., 2015). Although the binding motif of MmpE has been identified, determining its physiological substrates remains challenging due to the low abundance and instability of potential metabolites, as well as the limited sensitivity and coverage of current metabolomic technologies in mycobacteria.
(2) The study does not explore whether the phosphatase activity of MmpE is dependent on the NLS within macrophages, which would provide critical insights into its biological relevance in host cells. Conducting experiments with double knockout/mutant strains and comparing their intracellular survival with single mutants could elucidate these dependencies and further validate the significance of MmpE's dual functions.
We thank the reviewer for the comment. Deletion of the NLS motifs did not impair MmpE’s phosphatase activity in vitro (Figure 2F), indicating that MmpE's enzymatic function operates independently of its nuclear localization. Indeed, we confirmed that Fe<sup>3+</sup>-binding ability via the residues H348 and N359 is required for enzymatic activity of MmpE. We have expanded on this point in the Discussion section “MmpE is a bifunctional virulence factor in Mtb”.
(3) The study does not provide direct experimental validation of the MmpE deletion on lysosomal trafficking of the bacteria.
We thank the reviewer for the comment. To validate the role of MmpE in lysosome maturation during infection, we conducted fluorescence colocalization assays in THP-1 macrophages infected with BCG strains, including WT, ∆MmpE, Comp-MmpE, Comp-MmpE<sup>ΔNLS1</sup>, Comp-MmpE<sup>ΔNLS2</sup>, Comp-MmpE<sup>ΔNLS1-2</sup>. These strains were stained with the lipophilic membrane dye DiD, while macrophages were treated with the acidotropic probe LysoTracker<sup>TM</sup> Green (Martins et al., Autophagy, 2019). The result indicated that ΔMmpE and MmpE<sup>NLS1-2</sup> mutants exhibited significantly higher co-localization with LysoTracker compared to WT and Comp-MmpE strains (New Figure 5G), suggesting that MmpE deletion leads to enhanced lysosomal maturation during infection.
(4) The role of MmpE as a mycobacterial effector would be more relevant using virulent mycobacterial strains such as H37Rv.
We thank the reviewer for the comment. Previously, the role of Rv2577/MmpE as a virulence factor has been demonstrated in M. tuberculosis CDC 1551, where its deletion significantly reduced bacterial replication in mouse lungs at 30 days post-infection (Forrellad et al., Front Microbiol, 2020). However, that study did not explore the underlying mechanism of MmpE function. In our study, we found that MmpE enhances M. bovis BCG survival in macrophages (THP-1 and RAW264.7 both) and in mice (Figure 3, Figure 7A), consistent with its proposed role in virulence. To investigate the molecular mechanism by which MmpE promotes intracellular survival, we used M. bovis BCG as a biosafe surrogate and this model is widely accepted for studying mycobacterial pathogenesis (Wang et al., Nat Immunol, 2015; Wang et al., Nat Commun, 2017; Péan et al., Nat Commun, 2017).
Reviewer #2 (Public review):
Summary:
In this paper, the authors have characterized Rv2577 as a Fe3+/Zn2+ -dependent metallophosphatase and a nucleomodulin protein. The authors have also identified His348 and Asn359 as critical residues for Fe3+ coordination. The authors show that the proteins encode for two nuclease localization signals. Using C-terminal Flag expression constructs, the authors have shown that the MmpE protein is secretory. The authors have prepared genetic deletion strains and show that MmpE is essential for intracellular survival of M. bovis BCG in THP-1 macrophages, RAW264.7 macrophages, and a mouse model of infection. The authors have also performed RNA-seq analysis to compare the transcriptional profiles of macrophages infected with wild-type and MmpE mutant strains. The relative levels of ~ 175 transcripts were altered in MmpE mutant-infected macrophages and the majority of these were associated with various immune and inflammatory signalling pathways. Using these deletion strains, the authors proposed that MmpE inhibits inflammatory gene expression by binding to the promoter region of a vitamin D receptor. The authors also showed that MmpE arrests phagosome maturation by regulating the expression of several lysosome-associated genes such as TFEB, LAMP1, LAMP2, etc. These findings reveal a sophisticated mechanism by which a bacterial effector protein manipulates gene transcription and promotes intracellular survival.
Strength:
The authors have used a combination of cell biology, microbiology, and transcriptomics to elucidate the mechanisms by which Rv2577 contributes to intracellular survival.
Weakness:
The authors should thoroughly check the mice data and show individual replicate values in bar graphs.
We kindly appreciate the reviewer for the advice. We have now updated the relevant mice data in the revised manuscript.
Reviewer #3 (Public review):
Summary:
In this manuscript titled "Mycobacterial Metallophosphatase MmpE Acts as a Nucleomodulin to Regulate Host Gene Expression and Promote Intracellular Survival", Chen et al describe biochemical characterisation, localisation and potential functions of the gene using a genetic approach in M. bovis BCG and perform macrophage and mice infections to understand the roles of this potentially secreted protein in the host cell nucleus. The findings demonstrate the role of a secreted phosphatase of M. bovis BCG in shaping the transcriptional profile of infected macrophages, potentially through nuclear localisation and direct binding to transcriptional start sites, thereby regulating the inflammatory response to infection.
Strengths:
The authors demonstrate using a transient transfection method that MmpE when expressed as a GFP-tagged protein in HEK293T cells, exhibits nuclear localisation. The authors identify two NLS motifs that together are required for nuclear localisation of the protein. A deletion of the gene in M. bovis BCG results in poorer survival compared to the wild-type parent strain, which is also killed by macrophages. Relative to the WT strain-infected macrophages, macrophages infected with the ∆mmpE strain exhibited differential gene expression. Overexpression of the gene in HEK293T led to occupancy of the transcription start site of several genes, including the Vitamin D Receptor. Expression of VDR in THP1 macrophages was lower in the case of ∆mmpE infection compared to WT infection. This data supports the utility of the overexpression system in identifying potential target loci of MmpE using the HEK293T transfection model. The authors also demonstrate that the protein is a phosphatase, and the phosphatase activity of the protein is partially required for bacterial survival but not for the regulation of the VDR gene expression.
Weaknesses:
(1) While the motifs can most certainly behave as NLSs, the overexpression of a mycobacterial protein in HEK293T cells can also result in artefacts of nuclear localisation. This is not unprecedented. Therefore, to prove that the protein is indeed secreted from BCG, and is able to elicit transcriptional changes during infection, I recommend that the authors (i) establish that the protein is indeed secreted into the host cell nucleus, and (ii) the NLS mutation prevents its localisation to the nucleus without disrupting its secretion.
We kindly appreciate the reviewer for this insightful comment. To confirm the translocation of MmpE into the host nucleus during BCG infection, we first detected the secretion of MmpE by M. bovis BCG, using Ag85B as a positive control and GlpX as a negative control (Zhang et al., Nat commun, 2022). Our results showed that MmpE- Flag was present in the culture supernatant, indicating that MmpE is secreted by BCG indeed (new Figure S1C).
Next, we performed immunoblot analysis of the nuclear fractions from infected THP-1 macrophages expressing FLAG-tagged wild-type MmpE and NLS mutants. The results revealed that only wild-type MmpE was detected in the nucleus, while MmpE<sup>ΔNLS1</sup>, MmpE<sup>ΔNLS2</sup> and MmpE<sup>ΔNLS1-2</sup> were not detectable in the nucleus (New Figure S1D). Taken together, these findings demonstrated that MmpE is a secreted protein and that its nuclear translocation during infection requires both NLS motifs.
Demonstration that the protein is secreted: Supplementary Figure 3 - Immunoblotting should be performed for a cytosolic protein, also to rule out detection of proteins from lysis of dead cells. Also, for detecting proteins in the secreted fraction, it would be better to use Sauton's media without detergent, and grow the cultures without agitation or with gentle agitation. The method used by the authors is not a recommended protocol for obtaining the secreted fraction of mycobacteria.
We kindly appreciate the reviewer for the advice. To avoid the effects of bacterial lysis, we cultured the BCG strains expressing MmpE-Flag in Middlebrook 7H9 broth with 0.5% glycerol, 0.02% Tyloxapol, and 50 µg/mL kanamycin at 37 °C with gentle agitation (80 rpm) until an OD<sub>600</sub> of approximately 0.6 (Zhang et al., Nat Commun, 2022). Subsequently, we assessed the secretion of MmpE-Flag in the culture supernatant, using Ag85B as a positive control and GlpX as a negative control (New Figure S1C). The results showed that GlpX was not detected in the supernatant, while MmpE and Ag85B were detected, indicating that MmpE is indeed a secreted protein in BCG.
Demonstration that the protein localises to the host cell nucleus upon infection: Perform an infection followed by immunofluorescence to demonstrate that the endogenous protein of BCG can translocate to the host cell nucleus. This should be done for an NLS1-2 mutant expressing cell also.
We thank the reviewer for the suggestion. We agree that this experiment would be helpful to further verify the ability of MmpE for nuclear import. However, MmpE specific antibody is not available for us for immunofluorescence experiment. Alternatively, we performed nuclear-cytoplasmic fractionation for the THP-1 cells infected with the M. bovis BCG strains expressing FLAG-tagged wild-type MmpE, as well as NLS deletion mutants (MmpE<sup>ΔNLS1</sup>, MmpE<sup>ΔNLS2</sup>, and MmpE<sup>ΔNLS1-2</sup>). The WT MmpE is detectable in both cytoplasmic and nuclear compartments, while MmpE<sup>ΔNLS1</sup>, MmpE<sup>ΔNLS2</sup> or MmpE<sup>ΔNLS1-2</sup> were almost undetectable in nuclear fractions (New Figure S1D), suggesting that both NLS motifs are necessary for nuclear import.
(2) In the RNA-seq analysis, the directionality of change of each of the reported pathways is not apparent in the way the data have been presented. For example, are genes in the cytokine-cytokine receptor interaction or TNF signalling pathway expressed more, or less in the ∆mmpE strain?
We thank the reviewer for the comment. The KEGG pathway enrichment diagrams in our RNA-seq analysis primarily reflect the statistical significance of pathway enrichment based on differentially expressed genes, but do not indicate the directionality of genes expression changes. To address this concern, we conducted qRT-PCR on genes associated with the cytokine-cytokine receptor interaction pathway, specifically IL23A, CSF2, and IL12B. The results showed that, compared to the WT strain, infection with the ΔMmpE strain resulted in significantly increased expression levels of these genes in THP-1 cells (Figure 4F, Figure S4B), consistent with the RNA-seq data. Furthermore, we have submitted the complete RNA-seq dataset to the NCBI GEO repository [GSE312039], which includes normalized expression values and differential expression results for all detected genes.
(3) Several of these pathways are affected as a result of infection, while others are not induced by BCG infection. For example, BCG infection does not, on its own, produce changes in IL1β levels. As the author s did not compare the uninfected macrophages as a control, it is difficult to interpret whether ∆mmpE induced higher expression than the WT strain, or simply did not induce a gene while the WT strain suppressed expression of a gene. This is particularly important because the strain is attenuated. Does the attenuation have anything to do with the ability of the protein to induce lysosomal pathway genes? Does induction of this pathway lead to attenuation of the strain? Similarly, for pathways that seem to be downregulated in the ∆mmpE strain compared to the WT strain, these might have been induced upon infection with the WT strain but not sufficiently by the ∆mmpE strain due to its attenuation/ lower bacterial burden.
We thank the reviewer for the comment. Previous studies have shown that wild-type BCG induces relatively low levels of IL-1β, while retaining partial capacity to activate the inflammasome (Qu et al., Sci Adv, 2020). Our data (Figures 3G) show that infection with the ΔMmpE strain results in enhanced IL-1β expression, consistent with findings by Master et al. (Cell Host Microbe, 2008), in which deletion of zmp1 in BCG or M. tuberculosis led to increased IL-1β levels due to reduced inhibition of inflammasome activation.
In the revised manuscript, we have provided additional qRT-PCR data using uninfected macrophages as a baseline control. These results demonstrate that the WT strain suppresses lysosome-associated gene expression, whereas the ΔMmpE strain upregulates these genes, indicating that MmpE inhibits lysosome-related genes expression (Figure 4G). Furthermore, bacterial burden analysis revealed that ∆mmpE exhibited ~3-fold lower intracellular survival than the WT strain in THP-1 cells. However, when lysosomal maturation was inhibited, the difference in bacterial load between the two strains was reduced to ~1-fold (New Figures S6B and C). These findings indicate that MmpE promotes intracellular survival primarily by inhibiting lysosomal maturation, which is consistent with a previous study (Chandra et al., Sci Rep, 2015).
(4) CHIP-seq should be performed in THP1 macrophages, and not in HEK293T. Overexpression of a nuclear-localised protein in a non-relevant line is likely to lead to several transcriptional changes that do not inform us of the role of the gene as a transcriptional regulator during infection.
We thank the reviewer for the comment. We performed ChIP-seq in HEK293T cells based on their high transfection efficiency, robust nuclear protein expression, and well-annotated genome (Lampe et al., Nat Biotechnol, 2024; Marasco et al., Cell, 2022). These characteristics make HEK293T an ideal system for the initial identification of genome-wide chromatin binding profiles by MmpE.
Further, we performed comprehensive validation of the ChIP-seq findings in THP-1 macrophages. First, CUT&Tag and RNA-seq analyses in THP-1 cells revealed that MmpE modulates genes involved in the PI3K–AKT signaling and lysosomal maturation pathways (Figure 4C; Figure S5A-B). Correspondingly, we found that infection with the ΔMmpE strain led to reduced phosphorylation of AKT (S473), mTOR (S2448), and p70S6K (T389) (New Figure 5E-F), and upregulation of lysosomal genes such as TFEB, LAMP1, and LAMP2 (Figure 4G), compared to infection with the WT strain, and lysosomal maturation in cells infected with the ΔMmpE strain more obviously (New Figure 5G). Additionally, CUT&Tag profiling identified MmpE binding at the promoter region of the VDR gene, which was further validated by EMSA and ChIP-qPCR. Also, qRT-PCR demonstrated that MmpE suppresses VDR transcription, supporting its role as a transcriptional regulator (Figure 6). Collectively, these data confirm the biological relevance and functional significance of the ChIP-seq findings obtained in HEK293T cells.
(5) I would not expect to see such large inflammatory reactions persisting 56 days post-infection with M. bovis BCG. Is this something peculiar for an intratracheal infection with 1x10⁷ bacilli? For images of animal tissue, the authors should provide images of the entire lung lobe with the zoomed-in image indicated as an inset.
We thank the reviewer for the comment. The lung inflammation peaked at days 21–28 and had clearly subsided by day 56 across all groups (New Figure 7B), consistent with the expected resolution of immune responses to an attenuated strain like M. bovis BCG. This temporal pattern is in line with previous studies using intravenous or intratracheal BCG vaccination in mice and macaques, which also demonstrated robust early immune activation followed by resolution over time (Smith et al., Nat Microbiol, 2025; Darrah et al., Nature, 2020).
In this study, the infectious dose (1×10<sup>7</sup> CFU intratracheal) was selected based on previous studies in which intratracheal delivery of 1×10<sup>7</sup> CFU produced consistent and measurable lung immune responses and pathology without causing overt illness or mortality (Xu et al., Sci Rep, 2017; Niroula et al., Sci Rep, 2025). We have provided whole-lung lobe images with zoomed-in insets in the source dataset.
(6) For the qRT-PCR based validation, infections should be performed with the MmpE-complemented strain in the same experiments as those for the WT and ∆mmpE strain so that they can be on the same graph, in the main manuscript file. Supplementary Figure 4 has three complementary strains. Again, the absence of the uninfected, WT, and ∆mmpE infected condition makes interpretation of these data very difficult.
We thank the reviewer for the comment. As suggested, we have conducted the qRT-PCR experiment including the uninfected, WT, ∆mmpE, Comp-MmpE, and the three complementary strains infecting THP-1 cells (Figure 4F and G; New Figure S4B–D).
(7) The abstract mentions that MmpE represses the PI3K-Akt-mTOR pathway, which arrests phagosome maturation. There is not enough data in this manuscript in support of this claim. Supplementary Figure 5 does provide qRT-PCR validation of genes of this pathway, but the data do not indicate that higher expression of these pathways, whether by VDR repression or otherwise, is driving the growth restriction of the ∆mmpE strain.
We thank the reviewer for the comment. In the updated manuscript, we have provided more evidence. First, the RNA-seq analysis indicated that MmpE affects the PI3K-AKT signaling pathway (Figure 4C). Second, CUT&Tag analysis suggested that MmpE binds to the promoter regions of key pathway components, including PRKCB, PLCG2, and PIK3CB (Figure S5A). Third, confocal microscopy showed that ΔMmpE strain promotes significantly increased lysosomal maturation compared to the WT, a process downstream of the PI3K-AKT-mTOR axis (New Figure 5G).
Further, we measured protein phosphorylation for validating activation of the pathway (Zhang et al., Stem Cell Reports, 2017). Our results showed that cells infected with WT strains exhibited significantly higher phosphorylation of Akt, mTOR, and p70S6K compared to those infected with ΔMmpE strains (New Figures 5E and F). Moreover, the dual PI3K/mTOR inhibitor BEZ235 abolished the survival advantage of WT strains over ΔMmpE mutants in THP-1 macrophages (New Figure S6B and C). Collectively, these results support that MmpE activates the PI3K–Akt–mTOR signaling pathway to enhance bacterial survival within the host.
(8) The relevance of the NLS and the phosphatase activity is not completely clear in the CFU assays and in the gene expression data. Firstly, there needs to be immunoblot data provided for the expression and secretion of the NLS-deficient and phosphatase mutants. Secondly, CFU data in Figure 3A, C, and E must consistently include both the WT and ∆mmpE strain.
We thank the reviewer for the comment. We have now added immunoblot analysis for expression and secretion of MmpE mutants. The result show that NLS-deficient and phosphatase mutants can detected in supernatant (New Figure S1C). Additionally, we have revised Figures 3A, 3C, and 3E to consistently include both the WT and ΔMmpE strains in the CFU assays (Figures 3A, 3C, and 3E).
Recommendations for the authors:
Reviewer #2 (Recommendations for the authors):
The authors should attempt to address the following comments:
(1) Please perform densitometric analysis for the western blot shown in Figure 1E.
We sincerely thank the reviewer for the suggestion. In the updated manuscript, we have performed densitometric analysis of the western blot shown in New Figure 1F and G.
(2) Is it possible to measure the protein levels for MmpE in lysates prepared from infected macrophages.
We thank the reviewer for the comment. In the revised manuscript, we performed immunoblot analysis to measure MmpE levels in lysates from infected macrophages. The results demonstrated that wild-type MmpE was present in both the cytoplasmic and nuclear fractions during infection in THP-1 cells (New Figure S1D).
(3) The authors should perform circular dichroism studies to compare the secondary structure of wild type and mutant proteins (in particular MmpEHis348 and MmpEAsn359.
We thank the reviewer for this valuable suggestion. We agree that circular dichroism spectroscopy could provide useful information in comparison of the differences on the secondary structures. However, due to the technical limitations, we instead compared the structures of wild-type MmpE and the His348 and Asn359 mutant proteins predicted by AlphaFold. These structural models showed almost no differences in secondary structures between the wild-type and mutants (Figure S1B).
(4) The authors should perform more experiments to determine the binding motif for MmpE in the promoter region of VDR.
We thank the reviewer for this suggestion. In the current study, we have identified the MmpE-binding motif within the promoter region of VDR using CUT&Tag sequencing. This prediction was further validated by ChIP-qPCR and EMSA (Figure 6). These complementary approaches collectively support the identification of a specific MmpE-binding motif and demonstrate its functional relevance. Such approach was acceptable in many publications (Wen et al., Commun Biol, 2020; Li et al., Nat Commun, 2022).
(5) Were the transcript levels of VDR also measured in the lung tissues of infected animals?
We thank the reviewer for this suggestion. In the revised manuscript, we have performed qRT-PCR to assess VDR transcript levels in the lung tissues of infected mice (New Figure S8B).
(6) How does MmpE regulate the expression of lysosome-associated genes?
We thank the reviewer for this question. Our experiments suggested that MmpE suppresses lysosomal maturation probably by activating the host PI3K–AKT–mTOR signaling pathway (New Figure 5E–I). This pathway is well established as a negative regulator of lysosome biogenesis and function (Yang et al., Signal Transduct Target Ther, 2020; Cui et al., Nature, 2023; Cui et al., Nature, 2025). During infection, THP-1 cells infected with the WT showed increased phosphorylation of Akt, mTOR, and p70S6K compared to those infected with ΔMmpE (New Figure S5C, New Figure 5E and F), and concurrently downregulated key lysosomal maturation markers, including TFEB, LAMP1, LAMP2, and multiple V-ATPase subunits (Figure 4G). Given that PI3K–AKT–mTOR signaling suppresses TFEB activity and lysosomal gene transcription (Palmieri et al., Nat Commun, 2017), we propose that MmpE modulates lysosome-associated gene expression and lysosomal function probably by PI3K–AKT–mTOR signaling pathway.
(7) Mice experiment:
(a) The methods section states that mice were infected intranasally, but the legend for Figure 6 states intratracheally. Kindly check?
(b) Supplementary Figure 7 - this is not clear. The legend says bacterial loads in spleens (CFU/g) instead of DNA expression, as shown in the figure.
(c) The data in Figure 6 and Figure S7 seem to be derived from the same experiment, but the number of animals is different. In Figure 6, it is n = 6, and in Figure S7, it is n=3.
We thank the reviewer for the comments.
(a) The infection was performed intranasally, and the figure legend for New Figure 7 has now been corrected.
(b) We adopted quantitative PCR method to measure bacterial DNA levels in the spleens of infected mice. We have now revised the legend.
(c) We have conducted new experiments where each experiment now includes six mice. The results are showed in Figure 7B and C, as well as in the new Figure S8.
(8) The authors should show individual values for various replicates in bar graphs (for all figures).
We thank the reviewer for this helpful suggestion. We have now updated all relevant bar graphs to include individual data points for each biological replicate.
(9) The authors should validate the relative levels of a few DEGs shown in Figure 3F, Figure 3G, and Figure S4C, in the lung tissues of mice infected with wild-type, mutant, and complemented strains.
We thank the reviewer for this suggestion. In the revised manuscript, we have performed qRT-PCR to validate the expression levels of selected DEGs, including inflammation-related and lysosome-associated genes, in lung tissues from mice infected with wild-type, mutant, and complemented strains (New Figure S8C-H).
(10) Did the authors perform an animal experiment using a mutant strain complemented with the phosphatase-deficient MmpE (Comp-MmpE-H348AN359H)?
We appreciate the reviewer's comment. We agree that an additional animal experiment would be useful to assess the effects of the phosphatase. However, our study mainly focused on interpreting the function of the nuclear localization of MmpE during BCG infection. Additionally, we have assessed the role of the phosphatase of MmpE during infection with cell model (Figure 3E).
Minor comment:
The mutant strain should be verified by either Southern blot or whole genome sequencing.
We thank the reviewer for this comment. We verified deletion of mmpE gene by PCR method (Figure S3A-D) which was acceptable in many publications (Zhang et al., PLoS Pathog, 2020; Zhang et al., Nat Commun, 2022).
Reviewer #3 (Recommendations for the authors):
(1) Line 195: cytokine.
We thank the reviewer for the comments. We have now corrected it.
(2) Line 225: rewording required.
Corrected.
(3) Figure 4A. "No difference" instead of "No different".
Corrected.
(4) "KommpE" should be replaced with "∆mmpE strain" (∆=delta symbol).
Corrected.
(5) Supplementary Figure 7. The figure legend states CFU assays, but the y-axis and the graph seem to depict IS1081 quantification.
We thank the reviewer for the comment. The figure is based on IS1081 quantification using qRT-PCR, not CFU assays. We have now revised the legend for New Figure S8A.
References
Chandra P, Ghanwat S, Matta SK, Yadav SS, Mehta M, Siddiqui Z, Singh A, Kumar D (2015) Mycobacterium tuberculosis Inhibits RAB7 Recruitment to Selectively Modulate Autophagy Flux in Macrophages Sci Rep 5:16320.
Darrah PA, Zeppa JJ, Maiello P, Hackney JA, Wadsworth MH 2nd, Hughes TK, Pokkali S, Swanson PA 2nd, Grant NL, Rodgers MA, Kamath M, Causgrove CM, Laddy DJ, Bonavia A, Casimiro D, Lin PL, Klein E, White AG, Scanga CA, Shalek AK, Roederer M, Flynn JL, Seder RA (2020) Prevention of tuberculosis in macaques after intravenous BCG immunization Nature 577:95-102.
Forrellad MA, Blanco FC, Marrero Diaz de Villegas R, Vázquez CL, Yaneff A, García EA, Gutierrez MG, Durán R, Villarino A, Bigi F (2020) Rv2577 of Mycobacterium tuberculosis Is a virulence factor with dual phosphatase and phosphodiesterase functions Front Microbiol 11:570794.
Innokentev A, Sanchez AM, Monetti M, Schwer B, Shuman S (2025) Efn1 and Efn2 are extracellular 5'-nucleotidases induced during the fission yeast response to phosphate starvation mBio 16: e0299224.
Keppetipola N, Shuman S (2008) A phosphate-binding histidine of binuclear metallophosphodiesterase enzymes is a determinant of 2',3'-cyclic nucleotide phosphodiesterase activity J Biol Chem 283:30942-9.
Lampe GD, King RT, Halpin-Healy TS, Klompe SE, Hogan MI, Vo PLH, Tang S, Chavez A, Sternberg SH (2024) Targeted DNA integration in human cells without double-strand breaks using CRISPR-associated transposases Nat Biotechnol 42:87-98.
Li Z, Sheerin DJ, von Roepenack-Lahaye E, Stahl M, Hiltbrunner A (2022) The phytochrome interacting proteins ERF55 and ERF58 repress light-induced seed germination in Arabidopsis thaliana Nat Commun 13:1656.
Marasco LE, Dujardin G, Sousa-Luís R, Liu YH, Stigliano JN, Nomakuchi T, Proudfoot NJ, Krainer AR, Kornblihtt AR (2022) Counteracting chromatin effects of a splicing-correcting antisense oligonucleotide improves its therapeutic efficacy in spinal muscular atrophy Cell 185:2057-2070.e15.
Martins WK, Santos NF, Rocha CS, Bacellar IOL, Tsubone TM, Viotto AC, Matsukuma AY, Abrantes ABP, Siani P, Dias LG, Baptista MS (2019) Parallel damage in mitochondria and lysosomes is an efficient way to photoinduce cell death Autophagy 15:259-279.
Master SS, Rampini SK, Davis AS, Keller C, Ehlers S, Springer B, Timmins GS, Sander P, Deretic V (2008) Mycobacterium tuberculosis prevents inflammasome activation Cell Host Microbe 3:224-32.
Matange N, Podobnik M, Visweswariah SS (2015) Metallophosphoesterases: structural fidelity with functional promiscuity Biochem J 467:201-16.
Niroula N, Ghodasara P, Marreros N, Fuller B, Sanderson H, Zriba S, Walker S, Shury TK, Chen JM (2025) Orally administered live BCG and heat-inactivated Mycobacterium bovis protect bison against experimental bovine tuberculosis Sci Rep 15:3764.
Palmieri M, Pal R, Nelvagal HR, Lotfi P, Stinnett GR, Seymour ML, Chaudhury A, Bajaj L, Bondar VV, Bremner L, Saleem U, Tse DY, Sanagasetti D, Wu SM, Neilson JR, Pereira FA, Pautler RG, Rodney GG, Cooper JD, Sardiello M (2017) mTORC1-independent TFEB activation via Akt inhibition promotes cellular clearance in neurodegenerative storage diseases Nat Commun 8:14338.
Péan CB, Schiebler M, Tan SW, Sharrock JA, Kierdorf K, Brown KP, Maserumule MC, Menezes S, Pilátová M, Bronda K, Guermonprez P, Stramer BM, Andres Floto R, Dionne MS (2017) Regulation of phagocyte triglyceride by a STAT-ATG2 pathway controls mycobacterial infection Nat Commun 8:14642.
Qu Z, Zhou J, Zhou Y, Xie Y, Jiang Y, Wu J, Luo Z, Liu G, Yin L, Zhang XL (2020) Mycobacterial EST12 activates a RACK1-NLRP3-gasdermin D pyroptosis-IL-1β immune pathway Sci Adv 6: eaba4733.
Shenoy AR, Capuder M, Draskovic P, Lamba D, Visweswariah SS, Podobnik M (2007) Structural and biochemical analysis of the Rv0805 cyclic nucleotide phosphodiesterase from Mycobacterium tuberculosis J Mol Biol 365:211-25.
Smith AA, Su H, Wallach J, Liu Y, Maiello P, Borish HJ, Winchell C, Simonson AW, Lin PL, Rodgers M, Fillmore D, Sakal J, Lin K, Vinette V, Schnappinger D, Ehrt S, Flynn JL (2025) A BCG kill switch strain protects against Mycobacterium tuberculosis in mice and non-human primates with improved safety and immunogenicity Nat Microbiol 10:468-481.
Wang J, Ge P, Qiang L, Tian F, Zhao D, Chai Q, Zhu M, Zhou R, Meng G, Iwakura Y, Gao GF, Liu CH (2017) The mycobacterial phosphatase PtpA regulates the expression of host genes and promotes cell proliferation Nat Commun 8:244.
Wang J, Li BX, Ge PP, Li J, Wang Q, Gao GF, Qiu XB, Liu CH (2015) Mycobacterium tuberculosis suppresses innate immunity by coopting the host ubiquitin system Nat Immunol 16:237–245
Wen X, Wang J, Zhang D, Ding Y, Ji X, Tan Z, Wang Y (2020) Reverse Chromatin Immunoprecipitation (R-ChIP) enables investigation of the upstream regulators of plant genes Commun Biol 3:770.
Xu X, Lu X, Dong X, Luo Y, Wang Q, Liu X, Fu J, Zhang Y, Zhu B, Ma X (2017) Effects of hMASP-2 on the formation of BCG infection-induced granuloma in the lungs of BALB/c mice Sci Rep 7:2300.
Zhang L, Hendrickson RC, Meikle V, Lefkowitz EJ, Ioerger TR, Niederweis M. (2020) Comprehensive analysis of iron utilization by Mycobacterium tuberculosis PLoS Pathog 16: e1008337.
Zhang L, Kent JE, Whitaker M, Young DC, Herrmann D, Aleshin AE, Ko YH, Cingolani G, Saad JS, Moody DB, Marassi FM, Ehrt S, Niederweis M (2022) A periplasmic cinched protein is required for siderophore secretion and virulence of Mycobacterium tuberculosis Nat Commun 13:2255.
Zhang X, He X, Li Q, Kong X, Ou Z, Zhang L, Gong Z, Long D, Li J, Zhang M, Ji W, Zhang W, Xu L, Xuan A (2017) PI3K/AKT/mTOR Signaling Mediates Valproic Acid-Induced Neuronal Differentiation of Neural Stem Cells through Epigenetic Modifications Stem Cell Reports 8:1256-1269.
Briefing : Prévention des Addictions et Accompagnement des Jeunes (3-25 ans)
Ce document synthétise les enjeux actuels de la lutte contre les addictions chez les jeunes, tels que présentés par la Mission interministérielle de lutte contre les drogues et les conduites addictives (MILDECA).
Le point central de cette analyse est la vulnérabilité biologique du cerveau des jeunes, qui ne finit sa maturation qu'aux alentours de 25 ans.
Toute consommation prématurée altère le système nerveux et impacte directement la réussite scolaire et l'insertion sociale.
La stratégie de prévention préconisée repose sur un changement de paradigme : s'éloigner des interventions ponctuelles pour privilégier le développement des compétences psychosociales (CPS) à travers des programmes probants évalués par la recherche.
--------------------------------------------------------------------------------
L'addiction est définie comme une dépendance psychique et comportementale liée à l'utilisation de substances psychoactives qui perturbent le système nerveux central.
Contrairement aux idées reçues, le profil de l'addict n'est pas marginalisé ; il concerne l'ensemble de la population.
Les chiffres soulignent une problématique majeure de santé publique, souvent banalisée par rapport à d'autres crises sanitaires :
• Tabac : 75 000 décès par an.
• Alcool : 41 000 décès par an (soit un "demi-Covid" annuel récurrent).
• Coût social : L'alcool et le tabac coûtent chacun 120 milliards d'euros par an à la société, contre 10 milliards pour les autres drogues.
• Violences : L'alcool est impliqué dans plus d'un tiers des violences en général, et jusqu'à 80 % des violences faites aux femmes selon certains territoires.
La France présente des taux de consommation excessivement élevés. Un adulte sur quatre dépasse les repères de consommation à moindre risque (plus de 2 verres par jour ou 10 verres par semaine).
Cette culture de l'alcool s'installe dès l'enfance, souvent au sein de la famille (initiation lors de fêtes familiales, usage de boissons type "Champomy" qui préparent au marketing de l'alcool).
--------------------------------------------------------------------------------
L'adolescence est une période à risque marqué par le besoin de découverte de sensations et l'influence du groupe de pairs.
Le cerveau humain n'achève sa formation qu'à 25 ans.
Toute consommation de substances psychoactives avant cet âge provoque des altérations cognitives durables, affectant directement les capacités d'apprentissage.
Les addictions alimentent différentes formes de décrochage :
1. Le décrochage discret : L'élève est présent physiquement mais désengagé, ses facultés étant altérées par les produits (ex: consommation de cannabis avant les cours).
2. Le décrochage par l'échec : Malgré un travail réel, l'élève ne parvient plus à suivre en raison des effets cognitifs des substances.
3. L'influence de l'environnement : Le manque de cadre protecteur familial et l'accessibilité trop aisée aux produits (vente interdite aux mineurs mal respectée) aggravent ces risques.
--------------------------------------------------------------------------------
| Substance / Comportement | État de la situation chez les jeunes | Risques et caractéristiques | | --- | --- | --- | | Alcool | 44 % d'expérimentation en 6ème ; 85 % à 17 ans. | Développement du binge drinking (API) ; consommation banalisée en famille. | | Tabac | En baisse constante (perçu comme cher, "odorant" et sans effet immédiat). | Le risque n'est pas proportionnel à la quantité : l'arrêt total est la seule protection réelle. | | Cannabis | 600 000 jeunes de 17 ans en situation de dépendance. | Teneur en THC beaucoup plus élevée qu'il y a 20 ans ; risques de psychose et mal-être accrus. | | Cocaïne | Diffusion croissante dans tous les milieux professionnels. | Risques cardiovasculaires graves (AVC) avant 50 ans ; absence de traitement médical de substitution. | | Protoxyde d'azote | Usage de plus en plus fréquent via de grandes bonbonnes industrielles. | Risques immédiats : brûlures, chutes, paralysies neurologiques graves. | | Jeux d'argent | Croissance de 30 à 40 % (paris sportifs, poker). | Marketing agressif ciblant les milieux défavorisés ; risque financier et isolement. | | Écrans / Jeux vidéo | Usage intensif (plus de 4h/jour pour les 15-24 ans). | Impact sur le sommeil et l'activité physique ; pas de lien direct systématique avec l'échec scolaire. |
--------------------------------------------------------------------------------
La MILDECA préconise de délaisser les "coups médiatiques" ou les interventions policières ponctuelles au profit du développement des CPS.
Ce sont les capacités d'une personne à répondre aux épreuves de la vie et à maintenir un état de bien-être.
• Cognitives : Prise de décision, auto-contrôle, pensée critique face au marketing.
• Émotionnelles : Régulation du stress, gestion des émotions, confiance en soi.
• Sociales : Empathie, communication, résistance à la pression des pairs.
Programmes probants et évalués
Plusieurs programmes ont démontré leur efficacité par des suivis longitudinaux de chercheurs :
• Tina et Tony (4-6 ans) : Activités ludiques en maternelle.
• Good Behavior Game (Élémentaire) : Travail sur le comportement en groupe.
• Unplug (12-14 ans) : 12 séances interactives en collège pour apprendre à dire non et décrypter les influences.
• Primavera : Programme de transition école-collège.
--------------------------------------------------------------------------------
• Changement de comportement des adultes : Le développement des CPS nécessite que les adultes incarnent eux-mêmes ces compétences (coopération, gestion non violente des conflits).
• Valorisation positive : La "prédiction de l'échec" par un enseignant peut enfermer l'élève dans un cercle vicieux. À l'inverse, une vision positive favorise la résilience.
• Lutte contre les contrevérités : Il est crucial de déconstruire l'idée que le cannabis est une "drogue douce" ou que l'alcool est inoffensif en milieu familial.
• CJC (Consultations Jeunes Consommateurs) : Accueil anonyme et gratuit pour les jeunes et leurs parents.
• Plateformes numériques :
◦ Faminum : Pour réguler l'usage des écrans en famille. ◦ Maad Digital : Média d'information scientifique sur les addictions adapté aux jeunes.
• Programmes de soutien à la parentalité : Travailler la relation jeune-famille pour renforcer l'environnement protecteur.
En conclusion, la prévention efficace ne consiste plus à parler uniquement des produits, mais à armer les jeunes de capacités relationnelles et émotionnelles leur permettant de faire des choix responsables face à un environnement de plus en plus incitatif.
Author response:
The following is the authors’ response to the original reviews.
eLife Assessment
This valuable study examines the role of E2 ubiquitin enzyme, Uev1a in tissue resistance to oncogenic RasV12 in Drosophila melanogaster polyploid germline cells and human cancer cell lines. The incomplete evidence suggests that Uev1a works with the E3 ligase APC/C to degrade Cyclin A, and the strength of evidence could be increased by addressing the expression of CycA in the ovaries and the uev1a loss of function in human cancer cells. This work would be of interest to researchers in germline biology and cancer.
Thank you for your valuable assessment. The requested data on CycA expression (Figure 4E-G) and uev1a loss-of-function in human cancer cells (Figure 8 and Figure 8-figure supplement 2) have been added to the revised manuscript.
Public Reviews:
Reviewer #1 (Public review):
Summary:
This study uncovers a protective role of the ubiquitin-conjugating enzyme variant Uev1A in mitigating cell death caused by over-expressed oncogenic Ras in polyploid Drosophila nurse cells and by RasK12 in diploid human tumor cell lines. The authors previously showed that overexpression of oncogenic Ras induces death in nurse cells, and now they perform a deficiency screen for modifiers. They identified Uev1A as a suppressor of this Ras-induced cell death. Using genetics and biochemistry, the authors found that Uev1A collaborates with the APC/C E3 ubiquitin ligase complex to promote proteasomal degradation of Cyclin A. This function of Uev1A appears to extend to diploid cells, where its human homologs UBE2V1 and UBE2V2 suppress oncogenic Ras-dependent phenotypes in human colorectal cancer cells in vitro and in xenografts in mice.
Strengths:
(1) Most of the data is supported by a sufficient sample size and appropriate statistics.
(2) Good mix of genetics and biochemistry.
(3) Generation of new transgenes and Drosophila alleles that will be beneficial for the community.
We greatly appreciate your comments.
Weaknesses:
(1) Phenotypes are based on artificial overexpression. It is not clear whether these results are relevant to normal physiology.
Downregulation of Uev1A, Ben, and Cdc27 together significantly increased the incidence of dying nurse cells in normal ovaries (Figure 5-figure supplement 2), indicating that the mechanism we uncovered also protects nurse cells from death during normal oogenesis.
(2) The phenotype of "degenerating ovaries" is very broad, and the study is not focused on phenotypes at the cellular level. Furthermore, no information is provided in the Materials and Methods on how degenerating ovaries are scored, despite this being the most important assay in the study.
Thank you for pointing out this issue. We quantified the phenotype of nurse cell death using “degrading/total egg chambers per ovary”, not “degenerating ovaries”. Normal nurse cell nuclei exhibit a large, round morphology in DAPI staining (see the first panel in Figure 1D). During early death, they become disorganized and begin to condense and fragment (see the second panel in Figure 1D). In late-stage death, they are completely fragmented into small, spherical structures (see the third panel in Figure 1D), making cellular-level phenotypic quantification impossible. Since all nurse cells within the same egg chamber are interconnected, their death process is synchronous. Thus, quantifying the phenotype at the egg-chamber level is more practical than at the cellular level. We have added the description of this death phenotype and its quantification to the main text (Lines 104-108).
(3) In Figure 5, the authors want to conclude that uev1a is a tumor-suppressor, and so they over-express ubev1/2 in human cancer cell lines that have RasK12 and find reduced proliferation, colony formation, and xenograft size. However, genes that act as tumor suppressors have loss-of-function phenotypes that allow for increased cell division. The Drosophila uev1a mutant is viable and fertile, suggesting that it is not a tumor suppressor in flies. Additionally, they do not deplete human ubev1/2 from human cancer cell lines and assess whether this increases cell division, colony formation, and xenograph growth.
We apologize for any misleading description. We aimed to demonstrate that UBE2V1/2, like Uev1A in Drosophila “nos>Ras<sup>G12V</sup>+bam-RNAi” germline tumors, suppress oncogenic KRAS-driven overgrowth in diploid human cancer cells. Importantly, this function of Uev1A and UBE2V1/2 is dependent on Ras-driven tumors; there is no evidence that they act as broad tumor suppressors in the absence of oncogenic Ras. Drosophila uev1a mutants were lethal, not viable (see Lines 135-137), and germline-specific knockdown of uev1a (nos>uev1a-RNAi) caused female sterility without inducing tumors. These findings suggest that Uev1A lacks tumor-suppressive activity in the Drosophila female germline in the absence of Ras-driven tumors. We have revised the manuscript to prevent misinterpretation. Furthermore, we have added data demonstrating that the combined knockdown of UBE2V1 and UBE2V2 significantly promotes the growth of KRAS-mutant human cancer cells, as suggested (Figure 8 and Figure 8-figure supplement 2).
(4) A critical part of the model does not make sense. CycA is a key part of their model, but they do not show CycA protein expression in WT egg chambers or in their over-expression models (nos.RasV12 or bam>RasV12). Based on Lilly and Spradling 1996, Cyclin A is not expressed in germ cells in region 2-3 of the germarium; whether CycA is expressed in nurse cells in later egg chambers is not shown but is critical to document comprehensively.
We appreciate your critical comment. CycA is a key cyclin that partners with Cdk1 to promote cell division (Edgar and Lehner, 1996). Notably, nurse cells are post-mitotic endocycling cells (Hammond and Laird, 1985) and typically do not express CycA (Lilly and Spradling, 1996) (see the last sentence, page 2518, paragraph 3 in this 1996 paper). However, their death induced by oncogenic Ras<sup>G12V</sup> is significantly suppressed by monoallelic deletion of either cycA or cdk1 (Zhang et al., 2024). Conversely, ectopic CycA expression in nurse cells triggers their death (Figure 4C, D). These findings suggest that polyploid nurse cells exhibit high sensitivity to aberrant division-promoting stress, which may represent a distinct form of cellular stress unique to polyploid cells. In the revised manuscript, we have provided the CycA-staining data, comparing its expression in normal nurse cells versus cells undergoing oncogenic Ras<sup>G12V</sup>-induced death (Figure 4E-G).
(5) The authors should provide more information about the knowledge base of uev1a and its homologs in the introduction.
Thank you for your suggestion. In the revised introduction, we have provided a more detailed description of Uev1A (Lines 72-79). Additionally, we have introduced its human homologs, UBE2V1 and UBE2V2, in the main text (Lines 143-145).
Reviewer #2 (Public review):
Summary:
The authors performed a genetic screen using deficiency lines and identified Uev1a as a factor that protects nurse cells from RasG12V-induced cell death. According to a previous study from the same lab, this cell death is caused by aberrant mitotic stress due to CycA upregulation (Zhang et al.). This paper further reveals that Uev1a forms a complex with APC/C to promote proteasome-mediated degradation of CycA.
In addition to polyploid nurse cells, the authors also examined the effect of RasG12V-overexpression in diploid germline cells, where RasG12V-overexpression triggers active proliferation, not cell death. Uev1a was found to suppress its overgrowth as well.
Finally, the authors show that the overexpression of the human homologs, UBE2V1 and UBE2V2, suppresses tumor growth in human colorectal cancer xenografts and cell lines. Notably, the expression of these genes correlates with the survival of colorectal cancer patients carrying the Ras mutation.
Strength:
This paper presents a significant finding that UBE2V1/2 may serve as a potential therapy for cancers harboring Ras mutations. The authors propose a fascinating mechanism in which Uev1a forms a complex with APC/C to inhibit aberrant cell cycle progression.
We greatly appreciate your comments.
Weakness:
The quantification of some crucial experiments lacks sufficient clarity.
Thank you for highlighting this issue. We have provided more details regarding the quantification data in the revised manuscript.
References
Edgar, B.A., and Lehner, C.F. (1996). Developmental control of cell cycle regulators: a fly's perspective. Science 274, 1646-1652.
Hammond, M.P., and Laird, C.D. (1985). Chromosome structure and DNA replication in nurse and follicle cells of Drosophila melanogaster. Chromosoma 91, 267-278.
Lilly, M.A., and Spradling, A.C. (1996). The Drosophila endocycle is controlled by Cyclin E and lacks a checkpoint ensuring S-phase completion. Genes Dev 10, 2514-2526.
Zhang, Q., Wang, Y., Bu, Z., Zhang, Y., Zhang, Q., Li, L., Yan, L., Wang, Y., and Zhao, S. (2024). Ras promotes germline stem cell division in Drosophila ovaries. Stem Cell Reports 19, 1205-1216.
Recommendations for the authors:
Reviewer #1 (Recommendations for the authors):
(1) The figure legends insufficiently describe the figures. One example is Figure 3, where there are no details in the figure legend about what conditions apply to each panel and each lane of the gels.
For clarity and brevity, detailed experimental conditions are described in the Materials and Methods section. Figure legends therefore focus on summarizing the key findings. Thank you for your understanding!
(2) The font size on the figure is too small.
Thank you for your constructive suggestion. In response, we have enlarged all font sizes to improve readability.
(3) There are places where the authors overstate their results, and there are issues with the clarity of the text:
(3a) Lines 170: "excessive" is not appropriate. Their prior study showed a mild increase in proliferation.
“Excessive” has been removed in the revised manuscript (Lines 215-216).
(3b) Line 187-8: The authors should restate this sentence. Here's a possibility. Over-expression of Uev1a suppressed the phenotypes caused by CycA over-expression.
This sentence has been restated as “Notably, this cell death was suppressed by co-overexpression of CycA and Uev1A, indicating a genetic interaction between them”. (Lines 229-231).
(3c) Lines 266-7: The properties of Uev1a (ie, lacking a conserved Cys) should be in the introduction.
This information has been added to the revised introduction (Lines 74-76).
(3d) Line 318: "markedly" is an overstatement of the prior results.
Our quantification data revealed that “nos>Ras<sup>G12V</sup>; bam<sup>-/-</sup>” ovaries are three times larger than “nos>GFP; bam<sup>-/-</sup>” control ovaries (see Figure 4A-C in Zhang et al., Stem Cell Reports 19, 1205-1216). Given this substantial difference, we think that using "markedly" is not an overstatement.
(4) Data not shown occurs in a few places in the text. Given the ability to supply supplemental information in eLife preprints, these data should be shown.
Thanks for your suggestion. All “not shown” data have been added to the revised manuscript.
Reviewer #2 (Recommendations for the authors):
Major Comments
(1) Cyclin A (CycA) is a key player in this study, but the authors do not provide evidence showing the upregulation of CycA following Ras overexpression in either polyploid or diploid cells. Data on CycA expression should be included.
Thank you for your constructive suggestion. These data have been added to the revised manuscript (Figure 4E-G).
(2) DNA replication stress, cellular senescence, and cell death should be assessed under Ras overexpression (RasOE) and RasOE + Uev1A RNAi conditions to support the model proposed in Figure 4F.
We apologize for any confusion caused by our initial model. We do not have evidence that DNA replication stress and cellular senescence occur under these conditions. Cell death can be readily detected through the presence of fragmented nuclei and condensed DNA (see Figure 1D). The model has been updated accordingly (Figure 9E).
(3) Appropriate controls should be performed alongside the experimental sets. The same nos>Ras+GFPi data set was repeatedly used in Figures 1I, 2B, 2H, and Figures 2, S2B, which is not ideal.
All these experiments were performed under identical conditions. Therefore, we deem it appropriate to use the same control data across these analyses.
(4) Overall, the microscopic images are too small and hard to see.
Thank you for raising this important point. In the revised manuscript, all images and the font size on figures have been enlarged for improved clarity.
(5) Figure 1H
Why is the frequency of egg chamber degradation quite less in nos>RasG12V+GFP-RNAi (about 40%) than nos > RasG12V (about 80%)? And the authors do not show that there is a significant difference between those two conditions, although it should be there. We will need the explanation from the authors on why there is a difference here.
These overexpression experiments were conducted using the GAL4/UAS system. While both “nos>Ras<sup>G12V</sup>+GFP-RNAi” and “nos>Ras<sup>G12V</sup>” contain a single nos-GAL4 driver, they differ in UAS copy number: the former incorporates two UAS elements compared to only one in the latter (see the detailed genotypes in Source data 2). These results demonstrate that UAS copy number impacts experimental outcomes in our system.
In the previous paper (Zhang et al. (2024), Figure 7H shows that the frequency of egg chambers in nos>RasG12V is 33%, although this paper shows it as about 80%. There seems to be a difference in flies' age (previous paper: 7d, this paper: 3d), but this data raises the question of why nos>RasG12V shows more egg chamber degradation this time.
We greatly appreciate your careful observation. The nurse-cell-death phenotype exhibits a spectrum from mild to severe manifestations [see Figure 1D and our response to weekness (2) in Reviewer #1’s public reviews]. While our 2024 paper exclusively quantified egg chambers with severe phenotypes as degrading, the current study included both mild and severe cases in this classification. We do not think fly age could account for this substantial phenotypic difference. A detailed description of the nurse-cell-death phenotype and its quantification have been added to the revised manuscript (Lines 104-108).
In the following experiments, only nos>RasG12V+GFP-RNAi is used as a control (Figures 2B, H, S2B). I wonder if these results would give us a different conclusion if nos>RasG12V were used as a control.
As explained above, the UAS copy number does matter in our analyses, so it is important to keep them identical for comparison.
(6) In the abstract, the authors mention that uev1a is an intrinsic factor to protect cells from RasG12V-induced cell death. RasG12V does not induce much cell death of cystocytes with bam-gal4, whereas it induces a lot of nurse cells' death. Does it mean the intrinsic expression level of uev1a is low in nurse cells (or polyploid cells) compared to cystocytes (or diploid cells)?
Overexpression of Ras<sup>G12V</sup> driven by bam-GAL4 exhibited only minimal nurse cell death (Figure 1D, E). Additionally, Uev1A exhibited low intrinsic expression levels in both cystocytes and nurse cells (Figure 3E and Figure 5-figure supplement 1).
(7) Is uev1a-RNAi alone sufficient to induce egg chamber degradation? Or does it have any effect on ovarian development? (Related to question #1 in minor comments)
While nos>uev1a-RNAi resulted in female sterility, it alone was insufficient to induce egg chamber degradation. However, simultaneous downregulation of Uev1A, Ben, and Cdc27 triggered significant egg chamber degradation (Figure 5-figure supplement 2).
(8) Which stages of egg chambers get degraded with RasG12V induction?
This is a good question. In our analyses, we noted that degrading egg chambers exhibited considerable size variability (Figure 1D). Because degradation disrupts normal morphological cues, precise staging of these egg chambers is nearly impossible.
(9) I suggest testing the cellular senescence marker as well if the authors mention that CycA-degradation by Uev1a-APC/C complex prevents cellular senescence induced by RasG12V in a schematic image of Figure 4 (e.g., Dap/p21, SA-β-gal).
As addressed in our response to your Major Comment (2), we lacked experimental evidence to support cellular senescence in this context. We have therefore revised the model accordingly (Figure 9E). While this study focuses specifically on cell death, investigating potential roles of cellular senescence remains an important direction for future research. Thank you for your suggestion!
Minor Comments
(1) Figure 1D: Df#7584
It seems that the late-stage egg chamber is missing in this condition. Why does this occur without egg chamber degradation? Is there a possibility that we do not see egg chamber degradation because this deficiency line does not have a properly developed egg chamber that can have a degradation?
While this image represents only a single sample, we have confirmed the presence of late-stage egg chambers in other samples. If “Df#7584/+” females were unable to support late-stage egg chamber development, complete sterility would be expected due to the lack of mature eggs. However, as shown in this image (Figure 1D), the ovary contains mature eggs, and the “Df#7584/+” fly strain remains fertile.
(2) Based on the results that DDR signaling functions as keeping egg chambers from degradation, the authors may be better to check the DNA-damage markers in nos>RasG12V, nos>RasG12V +uev1a. (e.g. γ-H2AX)
Thank you for your constructive recommendation. These data have been added to the revised manuscript (Figure 3C).
Traumas, Criminalité et Judiciarisation : Analyse des Trajectoires de Rétablissement des Jeunes Hommes
Ce document synthétise les recherches menées par l'Institut universitaire Jeunes en difficulté sur les liens profonds entre les expériences traumatiques vécues durant l'enfance (ACE) et les parcours criminels des garçons et jeunes hommes au Québec.
L'analyse révèle que la population judiciaire masculine présente une surreprésentation massive de traumas complexes, souvent négligés par rapport à ceux des femmes.
Ces traumas altèrent le développement neurologique et créent une « mentalité de zone de guerre » où la déviance devient une stratégie de survie logique.
Le processus de « désistement » (l'abandon de la criminalité) ne se limite pas à l'arrêt des délits, mais nécessite une transformation identitaire profonde, souvent entravée par un système carcéral qui génère de nouveaux traumatismes.
L'intervention doit impérativement évoluer vers des approches sensibles aux traumas pour briser le cycle de la violence et de la réincarcération.
--------------------------------------------------------------------------------
Définition et Prévalence
Les expériences potentiellement traumatisantes vécues durant l’enfance (souvent appelées ACE - Adverse Childhood Experiences) sont des événements de sévérité variable, souvent chroniques, survenant dans l'environnement familial ou social. Elles perturbent le développement physique et psychologique.
Les dix catégories principales identifiées sont :
L'exposition à ces expériences multiplie de manière exponentielle les risques à l'âge adulte :
• Santé mentale : Une personne exposée à sept traumas durant l'enfance a 980 % de risques supplémentaires de développer un trouble de santé mentale.
• Suicide : Le risque de tentative de suicide est 30 fois plus élevé chez les personnes ayant vécu plusieurs ACE.
• Dépendances : Risque 5 fois plus élevé pour l'alcoolisme et 10 fois plus élevé pour la toxicomanie (drogues illicites).
• Victimisation : Risque 7 fois plus élevé d'être victime de violence à l'âge adulte.
--------------------------------------------------------------------------------
Les traumas affectent des zones critiques du cerveau, expliquant certains comportements dits « criminels » :
• Hippocampe : Atrophie ou dysfonctionnement impactant la régulation des émotions.
• Lobe préfrontal : Altération de la gestion des émotions, des communications interpersonnelles et du raisonnement moral.
• Fonctions exécutives : Difficulté à contrôler les impulsions, à planifier l'avenir et à réagir aux renforcements (positifs ou négatifs).
Cela rend les approches classiques cognitivo-comportementales moins efficaces si le trauma n'est pas traité.
Le trauma complexe, bien que non encore intégré au DSM-5, est reconnu internationalement. Chez les garçons, il se manifeste souvent par :
• La « Mentalité de zone de guerre » : Le jeune perçoit le monde comme hostile et traite tout étranger comme un ennemi potentiel. La déviance est alors perçue comme une réponse logique et justifiée.
• Insensibilité et retrait : Sous l'influence d'une vision hégémonique de la masculinité (stoïcisme, force), les jeunes hommes peuvent refuser l'aide, se replier sur eux-mêmes ou paraître dénués d'empathie, ce qui est en réalité un symptôme traumatique.
--------------------------------------------------------------------------------
Le système actuel tend à nourrir un cercle vicieux plutôt qu'à le briser :
1. Trauma initial : Exposition aux ACE.
2. Stratégies d'adaptation : Usage de drogues, criminalité pour survie ou appartenance.
3. Incarcération : Souvent vécue comme un nouveau traumatisme. Les mesures de coercition, l'isolement et la violence entre détenus exacerbent les symptômes de stress post-traumatique.
4. Conséquences carcérales : Les personnes ayant vécu au moins quatre ACE ont 15 fois plus de risques de s'automutiler et 8 fois plus de risques de tenter de se suicider en prison.
« Je ne me sens pas en sécurité en ce moment, ni dehors, ni en dedans. Si je rentre en dedans... je n'aurai pas le choix de me crisser la corde autour du cou, sinon il y en a d'autres qui vont le faire. » — Témoignage d'un jeune judiciarisé.
--------------------------------------------------------------------------------
Le désistement n'est pas simplement l'absence de récidive, mais un processus identitaire décliné en trois niveaux :
• Primaire : Une simple pause ou accalmie dans les activités criminelles.
• Secondaire : Changement d'identité (ne plus se percevoir comme un contrevenant).
• Tertiaire : Reconnaissance sociale et intégration pleine dans la communauté.
| Type | Caractéristiques | Besoins | | --- | --- | --- | | Convertis | Faible statut socio-économique, besoin d'appartenance comblé par le crime. | Soutien communautaire massif pour adopter une identité prosociale. | | Repentants | Statut social favorable, délits rationalisés, peu d'ACE. | L'arrestation suffit souvent à provoquer la prise de conscience. | | Rescapés | Grand isolement, troubles de santé mentale sévères, multiples ACE. | Équipes multidisciplinaires spécialisées (santé, logement, pharmacologie). |
--------------------------------------------------------------------------------
Pour les jeunes affiliés aux gangs, le trauma prend la forme de blessures morales :
• Trahison : Le gang, initialement perçu comme une famille de substitution face à la négligence parentale, finit par exploiter la vulnérabilité du jeune.
• Dissonance cognitive : Sentiment de honte et de culpabilité lié aux actes violents commis sous pression.
• Syndrome de Stockholm : Développement d'un lien affectif fondé sur le trauma envers ceux qui les mettent en danger.
--------------------------------------------------------------------------------
L'analyse conclut à l'urgence de transformer les pratiques judiciaires et cliniques :
1. Intervention sensible aux traumas : Tester des modèles (comme le Special Housing Unit aux États-Unis) qui forment le personnel et les détenus.
Résultats observés : diminution de l'anxiété, de la dépression et des agressions physiques.
2. Dépistage systématique des ACE : Comprendre le passé pour ne pas voir le jeune comme un « déchet » (terme cité par les répondants) mais comme un individu en réaction à son milieu.
3. Humanisation des services correctionnels : Réduire l'utilisation de la force et de l'isolement, particulièrement pour ceux ayant des troubles de santé mentale.
4. Rétablir l'espoir : Le désistement est possible pour la majorité si l'on agit sur la santé mentale, les dépendances et la création de nouvelles relations sociales valorisantes.
« On n'est pas des déchets... on est des êtres vivants pareils. » — Appel à la reconnaissance de la dignité humaine par un jeune incarcéré.
Author response:
We thank the reviewers for their thorough and constructive evaluation of our manuscript titled “PSD-95 drives binocular vision maturation critical for predation”. The reviewers raised several important conceptual and technical points. Here, we address and provide additional context on the major themes and outline our planned revisions.
We acknowledge that the current prey capture task cannot directly adjudicate between PSD-95 binocular vision impairments or sensorimotor processing deficits. However, we did not observe any major impairment supporting a sensorimotor processing deficit, in contrast to a major impairment in line with binocular vision impairment. Evidence from Huang et al. (2015) [1], Favaro et al. (2018) [2] and our data with the visual water task (VWT) — thus requiring identical sensorimotor but differential visual processing—clearly demonstrated intact visual acuity but impaired orientation discrimination in PSD-95 KO mice. Therefore, we believe that a binocular integration deficit is the most likely explanation of PSD-95 KO binocular impairments. In line with this, it is unlikely that aberrations in binocular eye movements account for the observations. We appreciate that alternative explanations remain possible and merit explicit discussion. Accordingly, we intend to expand the discussion of these alternatives.
Importantly, we will provide additional experimental data demonstrating that knock-down of PSD-95 in V1 but not in superior colliculus, significantly decreases orientation discrimination analyzed with the VWT, as we had shown for PSD-95 KO mice (while control knock-down does not have this effect). We believe that this new evidence better delineates the potential neuroanatomical locus of the PSD-95-associated deficits.
Furthermore, we will provide additional head movement analyses, as suggested by Reviewer 1. Specifically, we will investigate the head angle in relation to the cricket (azimuth) in time (±1 second) around prey contact under light and dark conditions.
We will also address the potential impact of PSD-95 KO learning deficits. We agree that there are more impairments in the PSD-95 KO brain, as has been published previously. But strikingly, the binocular impairment was dominating the sensory processing. This cannot be convincingly explained by learning deficits. In fact, we have observed improved learning of PSD-95 KO mice with some tasks (e.g. cocaine conditioned place preference) [3], but no significant differences in the VWT [1,2]. Learning differences were described for another PSD-95 mouse line, expressing the N-terminus with two PDZ domains [4]. To avoid potential learning dependent confounds, we have chosen salient stimuli, like water aversion, and prey capture to reduce impacts of potential learning defects.
We agree on the strength of the random dot stereograms to isolate stereoscopic computations. However, it requires special filters in front of either eye, which renders it unsuitable for the VWT. The lengthy training with less silent stimuli of water reward, could potentially add additional confounds of PSD-95 KO deficits. Thus, we think that this would be something for future experiments to allow for integration of different visual inputs. However, the combined improved performance of WT mice with binocular vision for prey capture (depth percept) and orientation discrimination (summation) is already supporting the importance of binocular vision in mice and the dominant defect in PSD-95 KO mice.
Finally, we will address the other points raised by the reviewers through clearer exposition and reorganization of the manuscript.
Once again, we would like to thank the reviewers for their thoughtful and constructive feedback, which we believe will substantially strengthen the manuscript.
(1) Huang, X., Stodieck, S. K., Goetze, B., Cui, L., Wong, M. H., Wenzel, C., Hosang, L., Dong, Y., Löwel, S., and Schlüter, O. M. (2015). Progressive maturation of silent synapses governs the duration of a critical period. Proc. Natl. Acad. Sci. 112, E3131–E3140. https://doi.org/10.1073/pnas.1506488112.
(2) Favaro, P.D., Huang, X., Hosang, L., Stodieck, S., Cui, L., Liu, Y., Engelhardt, K.-A., Schmitz, F., Dong, Y., Löwel, S., et al. (2018). An opposing function of paralogs in balancing developmental synapse maturation. PLOS Biol. 16, e2006838. https://doi.org/10.1371/journal.pbio.2006838.
(3) Shukla, A., Beroun, A., Panopoulou, M., Neumann, P.A., Grant, S.G., Olive, M.F., Dong, Y., and Schlüter, O.M. (2017). Calcium‐permeable AMPA receptors and silent synapses in cocaine‐conditioned place preference. EMBO J. 36, 458–474. https://doi.org/10.15252/embj.201695465.
(4) Migaud, M., Charlesworth, P., Dempster, M., Webster, L.C., Watabe, A.M., Makhinson, M., He, Y., Ramsay, M.F., Morris, R.G.M., Morrison, J.H., et al. (1998). Enhanced long-term potentiation and impaired learning in mice with mutant postsynaptic density-95 protein. Nature 396, 433–439. https://doi.org/10.1038/24790.
RRID:CVCL_0062
DOI: 10.1186/s12943-026-02568-y
Resource: (RRID:CVCL_0062)
Curator: @scibot
SciCrunch record: RRID:CVCL_0062
RRID:MGI:2683685
DOI: 10.1186/s12943-026-02568-y
Resource: RRID:MGI:2683685
Curator: @scibot
SciCrunch record: RRID:MGI:2683685
RRID:CVCL_0063
DOI: 10.1186/s12943-026-02568-y
Resource: (RRID:CVCL_0063)
Curator: @scibot
SciCrunch record: RRID:CVCL_0063
RRID:AB_2810984
DOI: 10.1186/s12943-026-02568-y
Resource: (Proteintech Cat# SA00013-4, RRID:AB_2810984)
Curator: @scibot
SciCrunch record: RRID:AB_2810984
RRID:AB_2264314
DOI: 10.1186/s12943-026-02568-y
Resource: (Proteintech Cat# 11426-1-AP, RRID:AB_2264314)
Curator: @scibot
SciCrunch record: RRID:AB_2264314
RRID:AB_2810983
DOI: 10.1186/s12943-026-02568-y
Resource: (Proteintech Cat# SA00013-1, RRID:AB_2810983)
Curator: @scibot
SciCrunch record: RRID:AB_2810983
RRID:AB_11127855
DOI: 10.1186/s12943-026-02568-y
Resource: (Cell Signaling Technology Cat# 8480, RRID:AB_11127855)
Curator: @scibot
SciCrunch record: RRID:AB_11127855
RRID:AB_2918796
DOI: 10.1186/s12943-026-02568-y
Resource: (Proteintech Cat# 68055-1-Ig, RRID:AB_2918796)
Curator: @scibot
SciCrunch record: RRID:AB_2918796
RRID:CVCL_5423
DOI: 10.1186/s12943-026-02568-y
Resource: (RRID:CVCL_5423)
Curator: @scibot
SciCrunch record: RRID:CVCL_5423
RRID:SCR_002798
DOI: 10.1186/s12943-025-02552-y
Resource: GraphPad Prism (RRID:SCR_002798)
Curator: @scibot
SciCrunch record: RRID:SCR_002798
RRID:SCR_016884
DOI: 10.1186/s12943-025-02552-y
Resource: clusterProfiler (RRID:SCR_016884)
Curator: @scibot
SciCrunch record: RRID:SCR_016884
RRID:SCR_000154
DOI: 10.1186/s12943-025-02552-y
Resource: DESeq (RRID:SCR_000154)
Curator: @scibot
SciCrunch record: RRID:SCR_000154
RRID:SCR_014583
DOI: 10.1186/s12943-025-02552-y
Resource: FastQC (RRID:SCR_014583)
Curator: @scibot
SciCrunch record: RRID:SCR_014583
RRID:SCR_008567
DOI: 10.1158/1055-9965.EPI-25-0828
Resource: Statistical Analysis System (RRID:SCR_008567)
Curator: @scibot
SciCrunch record: RRID:SCR_008567
RRID:SCR_021139
DOI: 10.1038/s41556-026-01879-y
Resource: ggpubr (RRID:SCR_021139)
Curator: @scibot
SciCrunch record: RRID:SCR_021139
RRID:SCR_005044
DOI: 10.1038/s41556-026-01879-y
Resource: Ivy Glioblastoma Atlas Project (RRID:SCR_005044)
Curator: @scibot
SciCrunch record: RRID:SCR_005044
RRID:AB_2561625
DOI: 10.1016/j.immuni.2026.01.028
Resource: (BioLegend Cat# 344112, RRID:AB_2561625)
Curator: @scibot
SciCrunch record: RRID:AB_2561625
RRID:SCR_021234
DOI: 10.1007/s12011-025-04961-y
Resource: None
Curator: @scibot
SciCrunch record: RRID:SCR_021234
RRID:SCR_014582
DOI: 10.1007/s12011-025-04961-y
Resource: TIDA (RRID:SCR_014582)
Curator: @scibot
SciCrunch record: RRID:SCR_014582
RRID:SCR_003070
DOI: 10.1007/s12011-025-04961-y
Resource: ImageJ (RRID:SCR_003070)
Curator: @scibot
SciCrunch record: RRID:SCR_003070
RRID:SCR_01419
DOI: 10.1101/pdb.rec10907
Resource: None
Curator: @areedewitt04
SciCrunch record: RRID:SCR_014199
nformation science methodologies are applied across numerous domains, reflecting the discipline's versatility and relevance. Key application areas include:
Hay muchos campos actualmente donde se aplica la ciencia de la información tal como menciona este apartado que abarca la mayoría sino todos los aspectos de la vida actualmente, tanto a nivel personal como a nivel organizacional o de estado/gobierno, en calidad de usuario y proveedor o comunidad para comunidad. Al tener una presencia tan indiscutible hace que la profundización de sus procesos e investgaciones generen valor dentro de la misma disciplina tanto como para los que se benefician de los resultados.
Impact of social media on people and industry
Este apartado tiene un poder y peso bastante grandes. El impacto de las redes sociales en las personas y en la industria es algo de doble filo, si bien se mencionan cosas tales cómo que "el impacto de la opinión pública puede extenderse de maneras inimaginables" y que las personas están interesadas en las nuevas formas en cómo se recibe la información, hay que tener en cuenta que esta misma información queda expuesta en la red (a veces hasta sin consentimiento ni conocimiento de las personas), Facebook y su creador se han vuelto inmersos en varias polémicas cómo ya sabemos, pero es este el riesgo de manejar datos sensibles, los algoritmos moldean a las personas, las redes sociales vuelven dependientes a estas personas, si bien la forma en cómo nos comunicamos y consumimos información ha crecido a pasos gigantes cabe recalcar que vamos perdiendo humanidad e identidad propia a base del consumismo provisto por la industria
Dissemination has historically been interpreted as unilateral communication of information. With the advent of the internet, and the explosion in popularity of online communities, social media has changed the information landscape in many respects, and creates both new modes of communication and new types of information",[36] changing the interpretation of the definition of dissemination. The nature of social networks allows for faster diffusion of information than through organizational sources.[37] The internet has changed the way we view, use, create, and store information; now it is time to re-evaluate the way we share and spread it.
Si bien, se define la comunicación de la información cómo algo "unilateral" -que está muy bien, dependiendo desde que arista se vea- cambiaría esto (Incluso con la mención "desde antes de la llegada del Internet") al hecho de que esto puede llegar a modificarse cómo algo BILATERAL en algunos o en la gran mayoría de casos.
Un caso puntual sería, donde un individuo difunde información y esta llega a un receptor o un espacio receptivo que está a la espera de este conocimiento para seguir difundiéndolo interactúa con este primer individuo y su conocimiento compartido creando y generando el famoso "intercambio de saberes".
Esto nace de que no es que haya un solo creador de conocimiento que simplemente se encarga de difundirlo y ya, sino que en su lugar, aparecería un agente externo que lo recibe e intercambia conocimiento con este
Careers
Me gusta cómo se hace un pequeño desglose (de la GRAN variedad de carreras vinculadas) sus características y funciones, ya que brinda una perspectiva llamativa sobre en donde y en qué se puede desempeñar un individuo, sin embargo, para hacer un poco más llamativo el apartado sobre las carreras, recomendaría asociar más de estas mismas
Information science[1][2][3] (abbreviated as infosci) is an academic field that is primarily concerned with the analysis, collection, classification, manipulation, storage, retrieval, movement, dissemination, and protection of information.[4]
Si bien es una concepción general muy contundente y clara, desde un punto subjetivo no deja de ser susceptible a cambios y redefiniciones dependiendo de la persona y el campo desde el que se explique, ya que esto es un campo de acción tan amplio que no se puede limitar a una simple (o única) definición
Históricamente, la ciencia de la información ha evolucionado como unacampo transdisciplinario, que se nutren y contribuyen a diversos ámbitos.
Esto es algo completamente cierto que muchos de nosotros podemos llegar a olvidar o no tener en cuenta y es que se vive esa cooperación o integración de varios campos de acción, conocimiento o profesiones que permiten buscar soluciones más integrales en cooperativo
No debe confundirse con teoría de la información , tecnología de la información , ingeniería de la información , ciencia de datos , informática , bibliotecología o sistemas de información (disciplina) .
Si bien podría considerarse algo "básico" no puedo dejar pasar que es un bien necesario el hecho que es bueno eso de aclararle de forma inicial, a la audiencia y/o lectores que no hay que confundir o tergiversar conceptos por más parecidos o afines que sean.
La ciencia de la información [ 1 ] [ 2 ] [ 3 ] (abreviada como infosci ) es un campo académico que se ocupa principalmente del análisis , la recopilación, la clasificación , la manipulación, el almacenamiento, la recuperación , el movimiento, la difusión y la protección de la información
A demás de lo que se menciona sobre la ciencia de la informacion, agregaria que es una necesidad del ser humano para su desarrollo integral.
Information organization: library science, archival science, documentation science, knowledge representation, ontologies, organization studies
La gestión de estas áreas en conjunto, permiten que la información sea accesible, confiable y útil para la sociedad.
and creates both new modes of communication and new types of information",
Las nuevas tecnologías aportan en gran medida a la investigación científica porque permite que los académicos lleven a cabo proyectos de forma remota y, así, culminarlos en un periodo de tiempo más corto que antes.
Many universities have entire colleges, departments or schools devoted to the study of information science, while numerous information-science scholars work in disciplines such as communication, healthcare, computer science, law, and sociology. Several institutions have formed an I-School Caucus (see List of I-Schools), but numerous others besides these also have comprehensive information specializations.
Podríamos considerar que se está hablando de comunicación científica, en específico, R&D collaboration (investigación y desarrollo). Ya que, se habla de varias instituciones trabajando juntas para lograr el avance de la ciencia.
Information science focuses on understanding problems from the perspective of the stakeholders involved and then applying information and other technologies as needed. In other words, it tackles systemic problems first rather than individual pieces of technology within that system.
Sea en el contexto social u organizacional existe un factor relevante que abordar en esta ciencia: la ética. Es la capacidad de lograr la integridad personal y laboral en nuestro oficio.
Cultural and social contexts:
Esta ciencia es trasversal, los científicos de la información se adaptan a los entornos de estudio para integrarse y promover el conocimiento.
Information science[1][2][3] (abbreviated as infosci) is an academic field that is primarily concerned with the analysis, collection, classification, manipulation, storage, retrieval, movement, dissemination, and protection of information.
Agregaría a esta afirmación que la información deber ser también legitimizada, llegar hasta su fuente y complementarla con su contexto para así acercarnos desde un perspectiva óptima.
Science or discipline
Este debate me trae recuerdos de mi primer semestre, ya que fue uno de los primeros temas que vi en la asignatura de ciencia de la información, en ese entonces una de las conclusiones que fue nuestro objeto de estudio es la información y todo lo relacionado a esta.
Human dimensions: human-computer interaction, cognitive psychology, information behavior, social epistemology,[6] philosophy of information, information ethics and science and technology studies
Aquí se encapsula lo que había mencionado sobre la importancia de la interacción con los usuarios y como somos una disciplina del servicio, sin embargo debo admitir que me sorprende algunas de las áreas incluidas, como es el caso de la psicología cognitiva, que a primera instancia me la imaginaria más en otros campos.
Technical and computationa
Efectivamente, el componente técnico y computacional es muy importante, y no solo es nuestro campo, el avance tecnológico nos obliga adaptarnos a esas nuevas tendencias o correr el riesgo de ser obsoletos, sin embargo no se la da la importancia que se le debe en la carrera.
The objective of this study is to create, replace, improve, or understand the information systems.
Considero esta definición como correcta, sin embargo en considero que también es necesario agregar que somos una disciplina del servicio a los usuarios y por lo tanto nuestras interacciones con el publico fuera de la unidades de información es de igual forma importante.
Convergence appeared on the horizon some 3 month ago
the Groan Zone
Reviewer #1 (Public review):
Summary:
Abdelmageed et al. investigate age-related changes in the subcellular localization of DNA polymerase kappa (POLK) in the brains of mice. POLK has been actively investigated for its role in translesion DNA synthesis and involvement in other DNA repair pathways in proliferating cells, very little is known about POLK in a tissue-specific context or let alone in post-mitotic cells. The authors investigated POLK subcellular distribution in the brains of young, middle-aged, and old mice via immunoblotting of fractioned tissue extracts and immunofluorescence (IF). Immunoblotting revealed a progressive decrease in the abundance of nuclear POLK, while cytoplasmic POLK levels concomitantly increased. Similar findings were present when IF was performed on brain sections. Further IF studies of cingulate cortex (Cg1), motor cortex (M1, M2), and somatosensory (S1) cortical regions all showed an age-related decline in nuclear POLK. Nuclear speckles of POLK decrease in each region, meanwhile the number of cytoplasmic POLK granules decreases in all four regions, but granule size is increasing. The authors report similar findings for REV1, another Y-family DNA polymerase.
The authors then investigate the colocalization of POLK with other DNA damage response (DDR) proteins in either pyramidal neurons or inhibitory interneurons. At 18 months of age, DNA damage marker gH2AX demonstrated colocalization with nuclear POLK, while strong colocalization of POLK and 8-oxo-dG was present in geriatric mice. The authors find that cytoplasmic POLK granules colocalize with stress granule marker G3BP1, suggesting that the accumulated POLK ends up in the lysosome.
Brain regions were further stained to identify POLK patterns in NeuN+ neurons, GABAergic neurons, and other non-neuronal cell types present in the cortex. Microglia associated with pyramidal neurons or inhibitory interneurons were found to have higher abundance of cytoplasmic POLK. The authors also report that POLK localization can be regulated by neuronal activity induced by Kainic acid treatment. Lastly, the authors suggest that POLK could serve as an aging clock for brain tissue, but POLK deserves further characterization and correlation to functional changes before being considered for a biomarker.
Strengths:
Investigation of TLS polymerases in specific tissues and in post-mitotic cells is largely understudied. The potential changes in sub cellular localization of POLK and potentially other TLS polymerases opens up many questions about DNA repair and damage tolerance in the brain and how it can change with age.
Weaknesses:
The work is quite novel and interesting, and the authors do suggest some potentially interesting roles for POLK in the brain, but these are in of themselves a bit speculative. The majority of the findings of this paper draw upon findings from POLK antibody and its presumed specificity for POLK. However, this antibody has not been fully validated and would benefit from further validation of the different band sizes. More mechanistic investigation is needed before POLK could be considered as a brain aging clock but does not preclude the potential for using POLK as a biological "dating" system for the brain.
Comments on revisions:
The revised manuscript is suitably improved and addresses reviewer comments.
Author response:
The following is the authors’ response to the original reviews.
Public Reviews:
Reviewer #1 (Public review):
Summary:
Abdelmageed et al. investigate age-related changes in the subcellular localization of DNA polymerase kappa (POLK) in the brains of mice. POLK has been actively investigated for its role in translesion DNA synthesis and involvement in other DNA repair pathways in proliferating cells, very little is known about POLK in a tissue-specific context, let alone in post-mitotic cells. The authors investigated POLK subcellular distribution in the brains of young, middle-aged, and old mice via immunoblotting of fractioned tissue extracts and immunofluorescence (IF). Immunoblotting revealed a progressive decrease in the abundance of nuclear POLK, while cytoplasmic POLK levels concomitantly increased. Similar findings were present when IF was performed on brain sections. Further, IF studies of the cingulate cortex (Cg1), the motor cortex (M1, M2), and the somatosensory (S1) cortical regions all showed an age-related decline in nuclear POLK. Nuclear speckles of POLK decrease in each region, meanwhile, the number of cytoplasmic POLK granules decreases in all four regions, but granule size is increasing. The authors report similar findings for REV1, another Y-family DNA polymerase.
The authors then investigate the colocalization of POLK with other DNA damage response (DDR) proteins in either pyramidal neurons or inhibitory interneurons. At 18 months of age, DNA damage marker gH2AX demonstrated colocalization with nuclear POLK, while strong colocalization of POLK and 8-oxo-dG was present in geriatric mice. The authors find that cytoplasmic POLK granules colocalize with stress granule marker G3BP1, suggesting that the accumulated POLK ends up in the lysosome.
Brain regions were further stained to identify POLK patterns in NeuN+ neurons, GABAergic neurons, and other non-neuronal cell types present in the cortex. Microglia associated with pyramidal neurons or inhibitory interneurons were found to have a higher abundance of cytoplasmic POLK. The authors also report that POLK localization can be regulated by neuronal activity induced by Kainic acid treatment. Lastly, the authors suggest that POLK could serve as an aging clock for brain tissue, but POLK deserves further characterization and correlation to functional changes before being considered as a biomarker.
Strengths:
Investigation of TLS polymerases in specific tissues and in post-mitotic cells is largely understudied. The potential changes in sub-cellular localization of POLK and potentially other TLS polymerases open up many questions about DNA repair and damage tolerance in the brain and how it can change with age.
Weaknesses:
The work is quite novel and interesting, and the authors do suggest some potentially interesting roles for POLK in the brain, but these are in and of themselves a bit speculative. The majority of the findings of this paper draw upon findings from POLK antibody and its presumed specificity for POLK. However, this antibody has not been fully validated and needs further work. Further validation experiments using Polk-deficient or knocked-down cells to investigate antibody specificity for both immunoblotting and immunofluorescence should be performed. More mechanistic investigation is needed before POLK could be considered as a brain aging clock.
We are thankful for the overall enthusiasm and positive comments.
(a) Concern over POLK antibody characterization in mouse:
We performed siRNA and shRNA knock downs in mouse primary cortical neurons as well as efficiently transfectable murine lines like 4T1 and Neuro-2A showing knock down of 99kDa and 120kDa bands recognized by sc-166667 anti-POLK antibody (exact figure number Figure 1 and S1). We show that in IF sc-166667 and A12052 (Figure S1G) shows similar immunostaining patterns and we used sc-166667 in all reported figures and western blots.
(b) More mechanistic investigation is needed before POLK could be considered as a brain aging clock:
We sincerely appreciate the valuable suggestion. We agree as a terminal assay POLK nucleo-cytoplasmic status is not practical for longitudinal studies. However, we believe it may serve an investigative/correlative endogenous signal for determining tissue age, that may be useful to "date" brain sections, since not many such cell biological markers exist. We have added clarification texts to address this.
Reviewer #2 (Public review):
Summary:
Abdelmageed et al., demonstrate POLK expression in nervous tissue and focus mainly on neurons. Here they describe an exciting age-dependent change in POLK subcellular localization, from the nucleus in young tissue to the cytoplasm in old tissue. They argue that the cytosolic POLK is associated with stress granules. They also investigate the cell-type specific expression of POLK, and quantitate expression changes induced by cell-autonomous (activity) and cell nonautonomous (microglia) factors.
I think it is an interesting report but requires a few more experiments to support their findings in the latter half of the paper. Additionally, a more mechanistic understanding of the pathways regulating POLK dynamics between the nucleus and cytosol, what is POLK doing in the cytosol, and what is it interacting with; would greatly increase the impact of this report. However, additional mechanistic experiments are mostly not needed to support much of the currently presented results, again, it would simply increase the impact.
(a) Concern on more mechanistic understanding of the pathways regulating POLK dynamics between the nucleus and cytosol:
We sincerely appreciate the reviewer’s enthusiasm and valuable guidance in helping us better understand the mechanism of nuclear-cytoplasmic POLK dynamics. Previously, we developed a modified aniPOND (accelerated native isolation of proteins on nascent DNA) protocol, which we termed iPoKD-MS (isolation of proteins on Pol kappa synthesized DNA followed by mass spectrometry), to capture proteins bound to nascent DNA synthesized by POLK in human cell lines (bioRxiv https://www.biorxiv.org/content/10.1101/2022.10.27.513845v3). In this dataset, we identified potential candidates that may regulate nuclear/cytoplasmic POLK dynamics. These candidates are currently undergoing validation in human cell lines, and we are preparing a manuscript on these findings. Among these, some candidates, including previously identified proteins such as exportin and importin (Temprine et al., 2020, PMID: 32345725), are being explored further as potential POLK nuclear/cytoplasmic shuttles. We are also conducting tests on these candidates in mouse cortical primary neurons to assess their role in POLK dynamics. In the revised version of the manuscript, we have included a discussion of our current understanding.
(b) Question on “… what is POLK doing in the cytosol, and what is it interacting with …”: Our data so far indicate that POLK accumulates in stress granules and lysosomes. We are very grateful for the reviewer’s insightful suggestions and will make every effort to incorporate them in the revised manuscript. We characterized POLK accumulation in the cytoplasm using six additional endo-lysosomal markers, as recommended by the reviewer. This data is now part of entirely new Figure 3.
Reviewer #3 (Public review):
Summary:
In this study, the authors show that DNA polymerase kappa POLK relocalizes in the cytoplasm as granules with age in mice. The reduction of nuclear POLK in old brains is congruent with an increase in DNA damage markers. The cytoplasmic granules colocalize with stress granules and endo-lysosome. The study proposes that protein localization of POLK could be used to determine the biological age of brain tissue sections.
Strengths:
Very few studies focus on the POLK protein in the peripheral nervous system (PNS). The microscopy approach used here is also very relevant: it allows the authors to highlight a radical change in POLK localization (nuclear versus cytoplasmic) depending on the age of the neurons.
The conclusions of the study are strong. Several types of neurons are compared, the colocalization with several proteins from the NHEJ and BER repair pathways is tested, and microscopy images are systematically quantified.
Weaknesses:
The authors do not discuss the physical nature of POLK granules. There is a large field of research dedicated to the nature and function of condensates: in particular numerous studies have shown that some condensates but not all exhibit liquid-like properties (https://www.nature.com/articles/nrm.2017.7, https://pubmed.ncbi.nlm.nih.gov/33510441/ https://www.mdpi.com/2073-4425/13/10/1846). The change of physical properties of condensates is particularly important in cells undergoing stress and during aging. The authors should discuss this literature.
We highly appreciate the reviewer bringing up the context of biomolecular condensates. Our iPoKD-MS data referenced above suggests candidates from various biomolecular condensates that we are currently investigating. We appreciate the reviewer providing important literature cited these articles in text and potential biomolecular condensates are discussed in the revised version.
Recommendations for the authors:
Reviewer #1 (Recommendations for the authors):
The work is quite novel and interesting, and the authors do suggest some potentially interesting roles for POLK in the brain, but these are in of themselves a bit speculative. The majority of the findings of this paper rely upon the POLK antibody and its specificity for POLK, which is not fully characterized and needs further work (validation of antibodies using immunoblots of Polk KO cells or siRNA KD of POLK in murine cells) to provide confidence in the authors' findings.
Points
siRNA knockdown of Polk in primary neurons showed a dramatic reduction in signal by IF even though qPCR analysis showed a reduction of only ~35% at the transcript level. Typically many DNA repair genes need to be knocked down by 80% or more to see discernable differences at the protein level. siRNA knockdown in a murine cell line (MEFs, neurons, or some other easily transfectable cell type) needs to be performed with immunoblotting with whole cell and fractionated (nuclear/cytoplasmic) lysates in order to better validate the anti-POLK antibodies and which bands that are visualized during immunoblotting are specific to POLK.
We performed siRNA and shRNA knock downs in mouse primary cortical neurons as well as efficiently transfectable murine lines like 4T1 and Neuro-2A showing knock down of 99kDa and 120kDa bands recognized by sc-166667 anti-POLK antibody (exact figure number Figure 1 and S1). We show that in IF sc-166667 and A12052 (Figure S1G) shows similar immunostaining patterns and we used sc-166667 in all reported figures and western blots.
Figure 1B and C, it is not clear which antibody(ies) are used for the immunoblotting of nuclear and cytoplasmic fractions and for a blot with whole tissue lysates. Please place the antibody vendor or clone next to the corresponding blot or describe it in the figure legend. Bands of varying sizes are present in 1B (and Figure S1) but only a band at 99 kDa was shown in 1C. Because there are no bands of equivalent size present in the nuclear and cytoplasmic fractions in Figure 1B, please describe or denote which bands were used for quantification purposes for nuclear and cytoplasmic POLK.
This has been clarified by using only one antibody throughout the manuscript sc-166667. We observed in whole cell lysate an intense ~99kDa and a faint ~120kDa band, which gets intense in nuclear fraction and is absent in cytoplasmic fraction. We have noted this in multiple human cell lines and hiPSC-derived neurons, which is our ongoing work. We do not know yet if the ~120kDa is a modification or isoform of POLK. We have hints from our proteomics data that it may be SUMOylated or ubiquitinylated or other post translational modifications. We added this in the discussion section.
Figure 1I, is there a quantification beyond just the representative image? There is no green staining pattern outside the cytoplasm in the 1-month-old M1 images that is present in all the other images in the panel.
Fig 1I is now Fig S1G in the revised manuscript. Since REV1 and POLH were not central to the study that focused on POLK, they were meant to be exploratory data panels and as such we did not quantify beyond the qualitative evaluation, which broadly resembled POLK’s disposition with age. We have noted there are some sample to sample variability in the background signal. In general, outside the cytoplasm as subcellularly segmented by fluorescent nissl expression, tends to be variable by brain areas but also higher in older brains
"Association with PRKDC further suggests POLK's role in the "gap-filling" step in the NHEJ repair pathway in neurons." There is no strong evidence in the literature for mammalian POLK playing a role in NHEJ. Some description of a role in HR has been described, however. The reference regarding the iPoKD-MS data set that provides evidence of POLK associating with BER and NHEJ factors is listed as Paul, 2022 but is in the reference list as Shilpi Paul 2022.
We removed this speculative statement and citation fixed.
Figure 4A, what is the age of the mouse for the representative images?
19 months and now mentioned in the figure legend
Figure 4C, Could the data from the different ages be plotted side by side to better evaluate the differences for each cell type/region?
Data is plotted side by side
Why was the one-month time point chosen as this could still represent the developing and not mature murine brain?
Reviewer correctly noted that a 1 month brain is still developing, but mostly from the behavioral and circuit maturation standpoint. However, from cell division and neurogenesis perspective, that is considered to be complete by first postnatal month, with neuron production thereafter largely restricted to specialized adult niches in the dentate gyrus and subventricular zone–olfactory bulb pathway; these adult neurogenic stem cells are embryonically derived and are regulated in ways that are distinct from the early, expansionary developmental waves of neurogenesis. In our study we performed our measurements in the cortical areas only. (Caviness et al., 1995, PMID: 7482802; Ansorg et al., 2012, PMID: 22564330; Ming & Song, 2011, PMID: 21609825; Bond et al., 2015, PMID: 26431181; Bond et al., 2021, PMID: 33706926; Bartkowska et al., 2022, PMID: 36078144). Also, in Figure 6A it was incorrectly mentioned to be just 1month, we rechecked our metadata and noted that young brains were comprised of 1 and 2 month old brains and now it has been corrected.
Furthermore, can the authors describe which sex of mice was used in these experiments and the justification if a single sex was used? If both sexes were used, were there any dimorphic differences in POLK localization patterns?
This is an important aspect, but in the beginning to keep mice numbers within manageable limits, we were focusing more on the age component. While both males and female brains were assayed but due to uneven sample distribution between sexes, we could not estimate if there were any statistically significant sexual dimorphic differences in IN, PN and NNs. Future studies will investigate the sex component as a function of age.
The suggestion of POLK as a brain aging clock may be a bit premature as the functional and behavioral consequences of cytoplasmic POLK sequestration are not fully known. Furthermore, investigation of POLK levels in other genetic models of neurodegeneration or with gerotherapeutics would be needed to establish if the POLK brain clock is responsive to changes that shift brain aging. Lastly, this clock may be impractical and not useful for longitudinal studies due to the terminal nature of assessing POLK levels.
We agree as a terminal assay POLK nucleo-cytoplasmic status is not practical for longitudinal studies. However, we believe it may serve an investigative/correlative endogenous signal for determining tissue age, that may be useful to "date" brain sections, since not many such cell biological markers exist. We have added clarification text.
Some discussion of the Polk-null mice is warranted, as they only have a slightly shortened lifespan, and any disease phenotypes were not reported. This stands in contrast to other DNA repair-deficient mice that mimic premature aging and show behavioral and motor deficits. This calls into question the role of POLK in brain aging.
Discussion statements on Polk-null mice has been added.
Please correct the catalog number for the SCBT anti-POLK antibody to sc-166667
Typographical error has been corrected
Reviewer #2 (Recommendations for the authors):
Results:
Figure by figure
(1) A progressive age-associated shift in subcellular localization of POLK The authors state that POLK has not been studied in nervous tissue before and they want to see if it is expressed, and if it changes subcellular location as a function of age. The authors argue age = stress like that seen in previous models using genotoxic agents and cancer cells. Indeed, POLK seems to convincingly change subcellular location from the nucleus to larger cytosolic puncta.
(2) Nuclear POLK co-localizes with DNA damage response and repair proteins This was a difficult dataset for me to decipher. To me, it appears as though POLK colocalizes with these examined proteins in the CYTOSOL, not the nucleus. Especially, in the oldest mice.
We added in the discussion that DNA repair proteins were observed to be present in the cytoplasm and biomolecular condensates citing relevant reviews and primary references.
(3) POLK in the cytoplasm is associated with stress granules and lysosomes in old brains LAMP1 has some issues as a lysosome marker. The authors even state it can be on endosomes. It would be nice to use a marker for mature lysosomes, some fluorescent reporter that is activated only by lysosomal proteases or pH. It is also of interest if POLK is localized to the membrane or the inside of these structures. The authors have access to an airyscan which is sufficient to examine luminal vs membrane localization on larger organelles like lysosomes.
We thank the reviewer for pushing us to investigate the nature of cytoplasmic POLK in endo-lysosomal compartments. We have now added a full-page figure on the cell biological results from six different markers, subset (Cathepsin B and D) are known to present in the lumens of endo-lysosomes, in Figure 3. Further high-resolution membrane vs lumen was not pursued, which is perhaps better suited in cultured neurons rather than thick fixed tissues.
(4) Differentially altered POLK subcellular expression amongst excitatory, inhibitory, and nonneuronal cells in the cortex.
This seems fine. I don't see anything wrong with the author's statement that there is more POLK in neurons vs non-neuronal cells.
(5) Microglia associated with IN and PN have significantly higher levels of cytoplasmic POLK I don't see really any convincing evidence of the author's claim here. They find a difference at early-old age, but not at old-old, or other ages. This is explained by "However, this effect is lost in late-old age (Figure 5D), likely due to the MG-mediated removal of the INs.". But no trend being observed, no experiment to show sufficiency, and no experiment to uncover a directional relationship; this is a tough claim to stand by.
Changes made in text to reflect speculative nature of this observation
(6) Subcellular localization of POLK is regulated by neuronal activity
Interesting and fairly difficult experiment. Can the authors talk more about what these values mean? I am confused as to why there is a decline in nuclear puncta at 80 min. Also, why are POLK counts in 6c similar at baseline between young and early-old? In Figures 5 and 6 I also worry about statistical analysis. Are all assumptions checked to use t-tests? Why not always use a test that has fewer assumptions?
We have explained in the text the artificial nature of few hour long acute slice preparations is very different and inherently a stressful environment, especially for the old brains, compared to the vascular perfused PFA fixed brain tissues tested between young and old ages.
We don’t have a proper explanation for the initial dip in nuclear puncta in both young and old brains at 80min of very similar magnitude. It could be a separate biological phenomenon that occurs at much shorter time scales that would not otherwise be captured in a fixed tissue assay and needs careful investigation using live tissue fluorescence imaging that is beyond the scope of this manuscript.
We apologize for the typographical error in the figure legend. We rechecked our R code and the tests were all Wilcoxon rank-sum (Mann–Whitney U) two-sided nonparametric.
Figure 6B & E had absurdly small p values due to large sample numbers. So, we implemented random sampling of 100 cells repeating for 200 times and presented the distribution of p values and Cohen’s d in the supplement and reported the median p value and Cohen’s in the main plot.
(7) POLK as an endogenous "aging clock" for brain tissue
Trainable model. What are the criteria for the model, and how does it work? The cutoffs it uses to classify each age group might be interesting in that the model may have identified a trait the researchers were unaware of. Otherwise, it is not especially useful. Maybe as an independent 'blind' analysis of the data?
We have added a better description of the models, assumptions and how two different unsupervised approaches converge on the same set of features with high AUROCs.
Minor questions:
The cartoons (1a, 2a-b, 5a, 6a) help a lot. However, I still had to work a bit to understand some of the graphs (e.g., 5d, 6b-e, fig 7). Is there a simpler way to present them? Maybe simply additional labelling? I'm not sure.
A more thorough discussion of statistical tests is warranted I think. I am not very clear why some were chosen (t-test vs nonparametric with fewer assumptions). Infinitesimally small p values also make me think maybe incorrect tests were done or no power analysis was performed beforehand. A fix for this is just discussing what went into the testing methods and why they were chosen.
Statistical analysis for Fig2 (using Generalized Estimating Equations), and Fig6 (with random repeated subsampling; method explained in text, figure legend updated and supplementary data on the distribution of p values and cohen’s d are added) to address the very small p values. Descriptions rewritten in relevant text.
In the absence of further mechanistic experiments, it would still be interesting to hear what the authors think is going on and what the significance of this altered subcellular location means. How do the authors think this is occurring? I think they are arguing that cytosolic localization of POLK is 100% detrimental to the neuron. ("The reduction of nuclear POLK in old brains is congruent with an increase in DNA damage markers") Do they have any idea what the 'bug' is in the POLK system then?
Statements in the discussion has been added.
Reviewer #3 (Recommendations for the authors):
POLK is detected as small " as small "speckles" inside the nucleus at a young age (1-2 months) and larger "granules" can be seen in the cytoplasm at progressively older time points (>9 months). In the nucleus, is POLK bound to DNA? In the cytoplasm, how are the POLK molecules organized: are they bound to a substrate or are they just organized as a proteins condensate without DNA?
In human U2OS cell line Dnase1 treatment leads to loss of POLK from the nucleus as well as its activity as reported in Fig5 of Paul, S. et. al. 2023 bioRxiv. While we haven’t reproduced these results in mouse primary neurons, we anticipate a similar situation which will be tested in the future. We have addressed limited aspects of the POLK in the cytoplasm in all new Fig3 with six endo-lysosomal markers, and added text.
When POLK proteins accumulate in the cytoplasm in aging cells, do they also repair condensates in the cytoplasm? What is the function of cytoplasmic POLK granules? More generally, is it known if other granules or foci, such as repair foci are found in the cytoplasms in aging cells, or in cells under stress?
Six markers for endo-lysosomes were tested to characterize the cytoplasmic granules now shown in Fig3.
While the authors quantify the number and sizes of the POLK signal, they don't discuss their physical nature. Some membrane-less condensates exhibit liquid-like properties, such as stress granules, P-bodies, or in the nucleus some repair condensates. In some diseased tissues, some condensates lose their liquid properties and become solid-like. Is it known if POLK condensates behave like liquid condensates or they are simply formed by bound molecules on DNA? Since they are larger and fewer in the cytoplasm, is it because several small puncta fused together to form a larger one? It would be worthwhile to discuss these points.
Discussion statements on the nature of condensates in context of the POLK cytoplasmic signal has been added.
Author response:
Public Reviews:
Reviewer #1 (Public review):
Summary:
The manuscript titled, "Sleep-Wake Transitions Are Impaired in the AppNL-G-F Mouse Model of Early Onset Alzheimer's Disease", is about a study of sleep/wake phenomena in a knockin mouse strain carrying "three mutations in the human App gene associated with elevated risk for early onset AD". Traditional, in-depth characterization of sleep/wake states, EEG parameters, and response to sleep loss are employed to provide evidence, "supporting the use of this strain as a model to investigate interventions that mitigate AD burden during early disease stages". The sleep/wake findings of earlier studies (especially Maezono et al., 2020, as noted by the authors) were extended by several important, genotype-related observations, including age-related hyperactivity onset that is typically associated with increased arousal, a normal response to loss of sleep and to multiple sleep latency testing, and a stronger AD-like phenotype in females. The authors conclude that the AppNL-G-F mice demonstrate many of the human AD prodromal symptoms and suggest that this strain may serve as a model for prodromal AD in humans, confirming the earlier results and conclusions of Maezono et al. Finally, based on state bout frequency and duration analyses, it is suggested that the AppNL-G-F mice may develop disruptions in mechanism(s) involved in state transition.
Strengths:
The study appears to have been, technically, rigorously conducted with high quality, in-depth traditional assessment of both state and EEG characteristics, with the concordant addition of activity and temperature. The major strengths of this study derive from observations that the AppNL-G-F mice: (1) are more hyperactive in association with decreased transitions between states; (2) maintain a normal response to sleep deprivation and have normal MSLT results; and (3) display a sex specific, "stronger" insomnia-like effect of the knockin in females.
Weaknesses:
The weaknesses stem from the study's impact being limited due to its being largely confirmatory of the Maezono et al. study, with advances of importance to a potentially more focused field. Further, the authors conclude that AppNL-G-F mice have disrupted mechanism(s) responsible for state transition; however, these were not directly examined. The rationale for this conclusion is stated by the authors as based on the observations that bouts of both W and NREM tend to be longer in duration and decreased in frequency in AppNL-G-F mice. Although altered mechanism(s) of state transition (it is not clear what mechanisms are referenced here) cannot be ruled out, other explanations might be considered. For example, increased arousal in association with hyperactivity would be expected to result in increased duration of W bouts during the active phase. This would also predictably result in greater sleep pressure that is typically associated with more consolidated NREM bouts, consistent with the observations of bout duration and frequency.
Reviewer 1 succinctly summarizes the advances of this study beyond the ground-breaking Maezono et al (2020) study of this “humanized” mouse model exhibiting amyloid deposition. Whereas Maezono et al. conducted sleep/wake studies on male App<sup>NL-G-F</sup> mice at 6 and 12 months of age, we had the unusual opportunity to study both sexes of homozygous App<sup>NL-G-F</sup> mice and WT littermates at 14-18 months of age and to conduct a longitudinal assessment of many of the same individuals at 18-22 months. In addition to baseline sleep/wake and EEG spectral analyses, we (1) measured subcutaneous body temperature and activity to obtain a broader picture of the physiology and behavior of this strain at advanced ages; (2) assessed baseline sleepiness in this strain using the murine version of the clinically-relevant Multiple Sleep Latency Test (MSLT); (3) evaluated the response of App<sup>NL-G-F</sup> mice and WT littermates to a perturbation of the sleep homeostat; (4) compared the sleep/wake characteristics of male vs. female App<sup>NL-G-F</sup> mice at 18-22 months and, (5) to assess the stability of the phenotypes, analyzed these data over a continuous 14-d recording rather than the conventional 24h recordings typical of most sleep/wake studies including Maezono et al. We found that a long wake/short sleep phenotype was characteristic of homozygous App<sup>NL-G-F</sup> mice at these advanced ages which is also evident in the Maezono et al. (2020) study at 12 months of age (but not at 6 months), although the authors do not comment on this phenotype and instead focus on the reduced REM sleep which is particularly evident in female App<sup>NL-G-F</sup> mice in our study. Remarkably, despite being awake ~20% longer per day, we find that App<sup>NL-G-F</sup> mice are no sleepier than WT mice as determined by the MSLT and that their sleep homeostat is intact when challenged by 6-h sleep deprivation. At both advanced ages, the long wake/short sleep phenotype is due primarily to longer Wake bouts and shorter bouts of both NREM and REM sleep during the dark phase. Moreover, hyperactivity develops in older in App<sup>NL-G-F</sup> mice, particularly females, which contributes to this phenotype. We agree with Reviewer 1 that “hyperactivity would be expected to result in increased duration of W bouts during the active phase” and that this could result in more consolidated NREM bouts and we will modify the manuscript to discuss this alternative. However, the suggestion of greater sleep pressure is not borne out by the MSLT studies as we did not observe the shorter sleep latencies and increased sleep during the nap opportunities on the MSLT that we have observed in other mouse strains. Moreover, due to their short sleep phenotype, App<sup>NL-G-F</sup> mice would be entering the sleep deprivation study with a greater sleep debt than WT mice, yet we did not observe greater EEG Slow Wave Activity in this strain during recovery from sleep deprivation. Thus, we have suggested that App<sup>NL-G-F</sup> mice are unable to transition from Wake to sleep as readily as their WT littermates. Our observations summarized above set the stage for subsequent mechanistic studies in aged App<sup>NL-G-F</sup> mice, although realistically, mice of this age and genotype are a rare commodity.
Reviewer #2 (Public review):
Summary:
The authors have used a knock-in mouse model to explore late-in-life amyloid effects on sleep. This is an excellent model as the mutated genes are regulated by the endogenous promoter system. The sleep study techniques and statistical analyses are also first-rate.
The group finds an age-dependent increase in motor activity in advanced age in the NLGF homozygous knock-in mice (NLGF), with a parallel age-dependent increase in body temperature, both effects predominate in the dark period. Interestingly, the sleep patterns do not quite follow the sleep changes. Wake time is increased in NLGF mice, and there is no progression in increased wake over time. NREMS and REM sleep are both reduced, and there is no progression. Sleep-wake effects, however, show a robust light:dark effect with larger effects in the dark period. These findings support distinct effects of this mutation on activity and temperature and on sleep. This is the first description of the temporal pattern of these effects. NLGF mice show wake stability (longer bout durations in the dark period (their active period) and fewer brief arousals from sleep. Sleep homeostasis across the lights-on period is normal. Wake power spectral density is unaffected in NLGF mice at either age. Only REM power spectra are affected, with NLGF mice showing less theta and more delta. There are interesting sex differences, with females showing no gene difference in wake bout number, while males show a gene effect. Similarly, gene effects on NREM bout number seem larger in males than in females. Although there was no difference in homeostatic response, there was normalization of sleep-wake activity after sleep deprivation.
Strengths:
Approach (model extent of sleep phenotyping), analysis.
Weaknesses:
The weaknesses are summarized below and are viewed as "addressable".
(1) The term insomnia. Insomnia is defined as a subjective dissatisfaction with sleep, which cannot be ascertained in a mouse model. The findings across baseline sleep in NLGF mice support increased wake consolidation in the active period. The predominant sleep period (lights on) is largely unaffected, and the active period (lights off) shows increased activity and increased wake with longer bouts. There is a fantastic clue where NLGF effects are consistent with increased hypocretinergic (orexinergic) neuron activity in the dark period, and/or increased drive to hypocretin neurons from PVH.
(2) Sleep-wake transitions are impaired: This should not be termed an impairment. It could actually be beneficial to have greater state stability, especially wake stability in the dark or active period. There is reduced sleep in the model that can be normalized by short-term sleep loss. It is fascinating that recovery sleep normalized sleep in the NLGF in the immediate lights-on and light-off period. This is a key finding.
Reviewer 2 suggests a provocative hypothesis to test. Curiously, although a recent Science paper suggests that hyperexcitable hypocretin/orexin neurons in aging mice results in greater sleep/wake fragmentation, hyperexcitability of this system could result in hyperactivity and longer wake bouts in aged App<sup>NL-G-F</sup> mice.
Reviewer #3 (Public review):
Summary:
In this study, Tisdale et al. studied the sleep/wake patterns in the biological mouse model of Alzheimer's disease. The results in this study, together with the established literature on the relationship of sleep and Alzheimer's disease progression, guided the authors to propose this mouse model for the mechanistic understanding of sleep states that translates to Alzheimer's disease patients. However, the manuscript currently suffers from a disconnect between the physiological data and the mechanistic interpretations. Specifically, the claim of "impaired transitions" is logically at odds with the observed increase in wake-state stability or possible hyperactivity. Additionally, the description of the methods, the quantification, and the figure presentation could be substantially improved. I detail some of my concerns below.
Strengths:
The selection of the knock-in model is a notable strength as it avoids the artifacts associated with APP overexpression and more closely mimics human pathology. The study utilizes continuous 14-day EEG recordings, providing a unique dataset for assessing chronic changes in arousal states. The assessment of sex as a biological variable identifies a more severe "insomniac-like" phenotype in females, which aligns with the higher prevalence and severity of Alzheimer's disease in women.
Weaknesses:
The study seems to lack a clear hypothesis-driven approach and relies mostly on explorative investigations. Moreover, lack of quantitative analytical methods as well as shaky logical conclusions, possibly not supported by data in its current form, leaves room for major improvement.
Since this paper studied sleep states, the "Methods" section is quite unclear on what specific criteria were used to classify sleep states. There is no quantitative description of classifying sleep based on clear, reproducible procedures. There are many reasonably well-characterized sleep scoring systems used in rat electrophysiological literature, which could be useful here. The authors are generally expected to describe movement speed and/or EMG and/or EEG (theta/delta/gamma) criteria used to classify these epochs. The subjective (manual) nature of this procedure provides no verifiable validation of the accuracy and interpretability of the results.
One of the bigger claims is that "state transition mechanism(s)" are impaired. However, Figure 7 shows that model mice exhibit significantly more long wake bouts (>260s) and fewer short wake bouts (<60s). Logically, an "impaired switch" (the flip-flop model, Saper et al., 2010) results in state fragmentation. The data here show the opposite: the wake state has become too stable. This suggests the primary defect is not in the transition mechanism itself, but possibly in a pathological increase in arousal drive (hyper-arousal), likely linked to the dark-phase hyperactivity shown in Figures 4 and 5. Also, a point to note is that this finding is not new.
Figure 3 heatmaps lack color bars and units. Spectral power must be quantitatively defined and methods well-explained in the Methods section. Without these, the reader cannot discern if the "reduced power" in females is a global suppression of signal or a frequency-specific shift. Additionally, the representative example used to claim shorter sleep bouts lacks the statistical weight required for a major physiological conclusion. How does a cooler color (not clear what range and what the interpretation is) mean shorter sleep bout in female mice? The authors should clearly mark the frequency ranges that support their claims. In this figure, there is a question mark following the theta/delta range. The authors should avoid speculation and state their claims based on facts. They should also add the theta and delta ranges in the plot, such that readers can draw their own conclusions.
Figure 8 and the MSLT results show that model mice are "no sleepier than WT mice" and have a functional homeostatic rebound. This presents a logical flaw in the "insomnia" narrative. True insomnia in AD patients typically involves a failure of the homeostatic process or a debilitating accumulation of sleep debt. If these mice do not show increased sleepiness (shorter latency) despite ~19% less sleep, the authors might be describing a "reduced need" for sleep or a "hyper-aroused" state, possibly not a clinical insomnia phenotype.
In Figure 9, LFP power shown and compared in percentages is problematic, as LFP power distribution is known to be skewed (follows power law). This is particularly problematic here because all the frequencies above ~20 Hz seem to be totally flattened or nonexistent, which makes this comparison of power severely limited and biased towards the relative frequency in the highly skewed portion of the LFP power spectrum, i.e., very low frequency ranges like delta, theta, and possibly beta. This ignores low, mid, and high gamma as well as ripple band frequencies. NREM sleep is known to have relatively greater ripple band (100-250 Hz) power bursts in hippocampal regions, and REM sleep is known to have synchronous theta-gamma relationships.
We agree with the reviewer that the “Classification of arousal states” section was missing the key description of how we scored the recordings into arousal states based on EEG, EMG and locomotor activity; this was an oversight as the corresponding text exists in all our previous sleep/wake studies published over several decades. Reviewer 1 also points out the alternative interpretation that “the wake state has become too stable.” However, I think we are using different words to say the same thing: that the transition from wake to sleep is impaired whether it is due to hyperarousal or to a defect in the flip/flop switch that results in greater Wake stability. We will revise Fig 3 (Reviewer 2 suggests combining with Fig 14) but note that the X-axis is labelled 0-25 Hz and that this figure was intended to be descriptive -- illustrating how unusual the female App<sup>NL-G-F</sup> mice are relative to WT -- rather than a quantitative analysis of spectral power as in Fig. 14. Both Reviewer 2 and 3 suggest that we are using “insomnia” incorrectly, which we have simply used to describe less sleep per 24h period. Reviewer 2 states that “Insomnia is defined as a subjective dissatisfaction with sleep” and Reviewer 3 suggests a narrow definition of insomnia as due only to “a failure of the homeostatic process or a debilitating accumulation of sleep debt.” In a revised manuscript, we will define “insomnia” as an operational term to succinctly mean “less sleep”. Regarding the problem of presenting spectral power in percentages, we completely agree with the reviewer. However, we intentionally presented spectral power density, a measure of relative power, as in Figure 3A and 3B of Maezono et al. (2020). At the risk of making Fig. 9 even more busy, we will revise Fig. 9 to add labels for all Y-axes.
In addition to a revised Fig. 9, in the revised manuscript, we will reformat Tables 1-3, Figs. S1 and S2 for legibility and correct an error in Fig. 7.
Author response:
The following is the authors’ response to the original reviews.
Public Reviews:
Reviewer #1 (Public review):
Summary:
This study addresses an important clinical challenge by proposing muscle network analysis as a tool to evaluate rehabilitation outcomes. The research direction is relevant, and the findings suggest further research. The strength of evidence supporting the claims is, however, limited: the improvements in function are not directly demonstrated, the robustness of the method is not benchmarked against already published approaches, and key terminology is not clearly defined, which reduces the clarity and impact of the work.
Comments:
There are several aspects of the current work that require clarification and improvement, both from a methodological and a conceptual standpoint.
First, the actual improvements associated with the rehabilitation protocol remain unclear. While the authors report certain quantitative metrics, the study lacks more direct evidence of functional gains. Typically, rehabilitation interventions are strengthened by complementary material (e.g., videos or case examples) that clearly demonstrate improvements in activities of daily living. Including such evidence would make the findings more compelling.
We thank the reviewer for their careful consideration of our work. We agree that direct evidence for the functional gains achieved by patients is important for establishing the efficacy of a clinical intervention and that this evidence should provide comprehensive insights for clinicians, from videos to case examples as suggested. Our aim here was apply a novel computational framework to a cohort of patients undergoing rehabilitation, and in doing so, provide empirical support for its utility in standardised motor assessments. We have shown that our novel approach can identify distinct physiological responses to VR vs PT conditions across the post-stroke cohort (see Fig.2B and associated text). Hence, although the data contains virtual reality vs. conventional physical therapy experimental conditions which likely holds important insights into the clinical use case of virtual reality interventions, we did not focus on such complementary evidence in this study. In future work, research groups (including our own) investigating the important question of clinical intervention efficacy will likely gain unique and useful mechanistic insights using our approach.
Moreover, a threshold of 5 points at the FMA-UE was considered as MCID, to distinguish between responder and non-responder patients, which represents an acknowledged and applicable measure in the clinical field. The use of single cases represents low evidence of change from the perspective of expert clinicians, raising concerns on the clinical meaningful of reported results. All this given, we chose to provide stronger evidence of clinical effect (i.e. comparison between responders and non-responders) interpreted from the perspective of muscle synergies, than to support our results in single selected cases, representing a bias in terms of translation to population of people survived to a stroke.
Second, the claim that the proposed muscle network analysis is robust is not sufficiently substantiated. The method is introduced without adequate reference to, or comparison with, the extensive literature that has proposed alternative metrics. It is also not evident whether a simpler analysis (e.g., EMG amplitude) might produce similar results. To highlight the added value of the proposed method, it would be important to benchmark it against established approaches. This would help clarify its specific advantages and potential applications. Moreover, several studies have shown very good outcomes when using AI and latent manifold analyses in patients with neural lesions. Interpreting the latent space appears even easier than interpreting muscle networks, as the manifolds provide a simple encoding-decoding representation of what the patient can still perform and what they can no longer do.
To address the reviewers concerns regarding adequate evidence for the claims made about the presented framework, we have now included an application of the conventional muscle synergy analysis approach based on non-negative matrix factorisation to the post-stroke cohort (see Supplementary materials Fig.5 and associated text). We made efforts to make this comparison as fair as possible by applying the conventional approach at the population level also and clustering the activation coefficients using a similar yet more conventional approach, agglomerative clustering. Accompanying the output of this application, we have included several points of where our framework improves significantly upon conventional muscle synergy analysis:
“Comparison with conventional approaches
To more directly illustrate the advantages of the proposed framework, we carried out a standardised pre-processing of the EMG data in line with conventional muscle synergy analysis. This included rectification, low-pass filtration (cut-off: 20Hz) and smooth resampling of EMG waveforms to 50 timepoints. All data for each participant at each session was separately normalised by channel-wise variance, concatenated together and input into non-negative matrix factorisation (NMF) ('nnmf' Matlab function, 10 replications) to extract 11 muscle synergies (W1-11 of Supplementary Materials Fig.5(Left)) and their time-varying activations. The number of components to extract was determined in a conventional way as the number of components required to explain >75% of the data variance. The extracted muscle synergies included distinct shoulder- (e.g. W2), elbow (e.g. W8) and forearm-level (e.g. W1) muscle covariation patterns along with more isolated muscle contributions (e.g. UT in W3, TL in W10).
Regarding the clustering results of our framework and how they compare to conventional approaches, to facilitate this comparison we applied agglomerative clustering to the time-varying activation coefficients of all participants, trials, tasks separately for pre- and post-sessions and employed the 'evalclusters' Matlab function (Ward linkage clustering, Calinski Harabasz criterion, Klist search = 2:21) for each session. We identified two clusters both at pre-session (Criterion = 1.69) and post-session (Criterion = 1.81) as optimal fits to the population data (see Supplementary Materials Fig.5(Right)). We found no associations between pre- or post-session cluster partitions and participants FMA-UE scores. Nevertheless, we did identify significant associations between the pre-session clustering’s and S_Pre (X<sup>2</sup> = 7.08, p = 0.008) and between post-session clustering’s and conventionally-defined treatment responders (X<sup>2</sup> = 4.2, p = 0.04). These findings, along with the similar two-way clustering structure found using the NIF, highlights important commonalities between these approaches.
To summarise the main advantages of our framework over this conventional approach:
- Lower dimensionality and enhanced interpretability of extracted components.
Our framework yields a lower number of population-level components that correspond more consistently to meaningful biomechanical and physiological functions.
- Integration of pairwise muscle relationships.
By incorporating muscle-pair level analysis, our framework captures coordinated interactions between primary and stabilising muscles—relationships that conventional NMF approaches overlook.
- Separation of task-relevant and task-irrelevant activity.
The NIF isolates task-relevant coordination patterns, distinguishing them from task-irrelevant interactions driven by biomechanical or task constraints. On the other hand, task-relevant and -irrelevant muscle contributions are intermixed in conventional muscle synergy analysis.
- Ability to identify complementary functional roles.
The NIF characterises whether muscle pairs act in similar or complementary ways, providing richer insight into motor control strategies.
- Reduced dependence on variance-based optimisation.
Unlike conventional methods that rely on maximising variance explained, our framework allows detection of subtle but functionally significant interactions that contribute less to total variance.
- Improved detection of clinically relevant population structure.
The clustering component of our framework revealed distinct post-stroke subgroups with important clinical relevance, distinguishing moderately and severely impaired cohorts and treatment responders and non-responders from pre-treatment data.”
This supplementary analysis is referred to in the Methods section of the main text with reference to previous similar comparisons between our framework and conventional approaches:
“Towards finding an effective approach to clustering participants in this data based on differences in impairment severity and therapeutic (non-)responsiveness, we found that conventional clustering algorithms (e.g. agglomerative, k-means etc.) could not provide substantive outputs (see Supplementary Materials Fig.5 and associated text for a direct comparison with conventional approaches), perhaps resulting from the complex interdependencies between the modular activations.”
“To facilitate comparisons with existing approaches, we performed a conventional muscle synergy analysis on the post-stroke cohort (see Supplementary Materials Fig.5 and associated text). Further comparisons with conventional approaches can be found in our previous work (O’Reilly & Delis, 2022).”
Further, we have also referred to a previous analysis of this post-stroke dataset using the conventional approach in the discussion section, where we point out how our approach can identify salient features of post-stroke physiological responses that conventional approaches cannot:
“Further, the NIF demonstrated here an enhanced capability over traditional approaches to identify these crucial patterns, as earlier work on related versions of this dataset could not identify any differentiable fractionation events across the cohort (Pregnolato et al., 2025).”
Overall, the utility of conventional muscle synergy analysis is well recognised across the field (Hong et al 2021). Our proposed approach builds on this conventional method by addressing key limitations to further enhance this clinical utility. We also agree that manifold learning approaches are an exciting area of research that we aim to incorporate into our framework in future research. Specifically, manifold learning methods like Laplacian eigenmaps can readily be applied to the co-membership matrix produced by our clustering algorithm, exploiting the geometry of this matrix to provide a continuous rather than discrete representation of population structure. We have highlighted this possibility in the discussion section:
“Indeed, in future work, we aim to apply manifold learning approaches to the co-membership matrix derived from this clustering algorithm, providing a continuous representation of the population structure.”
Third, the terminology used throughout the manuscript is sometimes ambiguous. A key example is the distinction made between "functional" and "redundant" synergies. The abstract states: "Notably, we identified a shift from redundancy to synergy in muscle coordination as a hallmark of effective rehabilitation-a transformation supported by a more precise quantification of treatment outcomes."
However, in motor control research, redundancy is not typically seen as maladaptive. Rather, it is a fundamental property of the CNS, allowing the same motor task to be achieved through different patterns of muscle activity (e.g., alternative motor unit recruitment strategies). This redundancy provides flexibility and robustness, particularly under fatiguing conditions, where new synergies often emerge. Several studies have emphasized this adaptive role of redundancy. Thus, if the authors intend to use "redundancy" differently, it is essential to define the term explicitly and justify its use to avoid misinterpretation.
We appreciate the reviewers concerns regarding the terminology employed in this study. Indeed, we agree that redundancy is seen in the motor control literature as a positive feature of biological systems, appearing to contradict the interpretations of the redundancy-to-synergy information conversion result we have presented. We also wish to highlight that across the motor control literature and beyond, the idea of redundancy is often conflated with the related but distinct notion of degeneracy. Traditional motor control research has also recognised this difference, for example, Latash has outlined this difference in the seminal work on motor abundance (https://doi.org/10.1007/s00221-012-3000-4). A key reference discussing this conflation and these two concepts in an information-theoretic way is found here: https://doi.org/10.1093/cercor/bhaa148. To summarise what their arguments mean for our work:
- System degeneracy relates to the ability of different system components to contribute towards the same task in a context-specific way.
- System redundancy corresponds to the degree of functional overlap among system components.
Hence, conceptually speaking, informational redundancy as employed in our study (i.e. functionally-similar muscle interactions) links with system redundancy in that it quantifies the functional overlap of system components. This definition of system redundancy implies that it is an unavoidable by-product of degenerate systems (inefficient use of degrees of freedom) which should be minimised where possible. As a result of stroke, in our study and related previous work patients displayed increased informational redundancy, linking with the abnormal co-activations they typically experience for example and with previous results from traditional muscle synergy analysis showing fewer components extracted as a function of motor impairment post-stroke (i.e. higher informational redundancy) (Clark et al. 2010). Our novel contribution here is to convey how effective rehabilitation is underpinned by a redundancy-to-synergy information conversion across the muscle networks, relating in a loose sense conceptually to a reduction in system redundancy and enhancement of system degeneracy (i.e. functionally differentiated system components contributing towards task performance).
Together, and alongside the mathematical descriptions of redundant (functionally-similar) and synergistic (functionally-complementary) information in what types of functional relationships they capture, we believe the intuition behind this finding has clear links with previous research showing a) the merging of muscle synergies in response to post-stroke impairment (i.e. functional de-differentiation), b) reduction in abnormal couplings with effective rehabilitation (i.e. functional re-differentiation). To communicate this more clearly to readers, we have included the following in the corresponding discussion section:
“Previous research has shown that functional redundancy increases post-stroke (Cheung et al., 2012; Clark et al., 2010), reflecting the characteristic loss of functional specificity (i.e. functional de-differentiation) of muscle interactions post-stroke. Enhanced synergy with treatment here thus reflects the functional re-differentiation of predominantly flexor-driven muscle networks towards different, complementary task-objectives across the seven upper-limb motor tasks performed (Kim et al., 2024b), leading to improved motor function among responders.”
Finally, we have screened the updated manuscript for consistent use of terminology including functional/redundant/synergistic.
References
Clark DJ, Ting LH, Zajac FE, Neptune RR, Kautz SA. Merging of healthy motor modules predicts reduced locomotor performance and muscle coordination complexity post-stroke. Journal of neurophysiology. 2010 Feb;103(2):844-57.
Hong YN, Ballekere AN, Fregly BJ, Roh J. Are muscle synergies useful for stroke rehabilitation?. Current Opinion in Biomedical Engineering. 2021 Sep 1;19:100315.
Latash ML. The bliss (not the problem) of motor abundance (not redundancy). Experimental brain research. 2012 Mar;217(1):1-5.
O'Reilly D, Delis I. Dissecting muscle synergies in the task space. Elife. 2024 Feb 26;12:RP87651.
Sajid N, Parr T, Hope TM, Price CJ, Friston KJ. Degeneracy and redundancy in active inference. Cerebral Cortex. 2020 Nov;30(11):5750-66.
Reviewer #2 (Public review):
Summary:
This study analyzes muscle interactions in post-stroke patients undergoing rehabilitation, using information-theoretic and network analysis tools applied to sEMG signals with task performance measurements. The authors identified patterns of muscle interaction that correlate well with therapeutic measures and could potentially be used to stratify patients and better evaluate the effectiveness of rehabilitation.
However, I found that the Methods and Materials section, as it stands, lacks sufficient detail and clarity for me to fully understand and evaluate the quality of the method. Below, I outline my main points of concern, which I hope the authors will address in a revision to improve the quality of the Methods section. I would also like to note that the methods appear to be largely based on a previous paper by the authors (O'Reilly & Delis, 2024), but I was unable to resolve my questions after consulting that work.
I understand the general procedure of the method to be: (1) defining a connectivity matrix, (2) refining that matrix using network analysis methods, and (3) applying a lower-dimensional decomposition to the refined matrix, which defines the sub-component of muscle interaction. However, there are a few steps not fully explained in the text.
(1) The muscle network is defined as the connectivity matrix A. Is each entry in A defined by the co-information? Is this quantity estimated for each time point of the sEMG signal and task variable? Given that there are only 10 repetitions of the measurement for each task, I do not fully understand how this is sufficient for estimating a quantity involving mutual information.
We acknowledge the confusion caused here in how many datapoints were incorporated into the estimation of II. The number of datapoints included in each variable involved was in fact no. of timepoints x 10 repetitions. Hence for the EMGs employed in this analysis with a sampling rate of 2000Hz, the length of variables involved in this analysis could easily extend beyond 20,000 datapoints each. We have clarified this more specifically in the corresponding section of the methods:
“We carried out this application in the spatial domain (i.e. interactions between muscles across time (Ó’Reilly & Delis, 2022)) by concatenating the 10 repetitions of each task executed on a particular side (i.e. variables of length no. of timepoints x 10 trials) and quantifying II with respect to this discrete task parameter codified to describe the motor task performed at each timepoint for each trial included.”
In the previous paper (O'Reilly & Delis, 2024), the authors initially defined the co-information (Equation 1.3) but then referred to mutual information (MI) in the subsequent text, which I found confusing. In addition, while the matrix A is symmetrical, it should not be orthogonal (the authors wrote A<sup>T</sup>A = I) unless some additional constraint was imposed?
We thank the reviewer for spotting this typo in the previous paper describing a symmetric matrix as A<sup>T</sup>A = I which is in fact related to orthogonality instead. To clarify this error, in the current study we have correctly described the symmetric matrix as A = A<sup>T</sup> here:
“We carried out this application in the spatial domain (i.e. interactions between muscles across time (Ó’Reilly & Delis, 2022)) by concatenating the 10 repetitions of each task executed on a particular side (i.e. variables of length no. of timepoints x 10 trials) and quantifying II with respect to this discrete task parameter codified to describe the motor task performed at each timepoint for each trial included. This computation was performed on all unique m<sub>x</sub> and m<sub>y</sub> pairings, generating symmetric matrices (A) (i.e. A = A<sup>T</sup>) composed separately of non-negative redundant and synergistic values (Fig.5).”
Regarding the reviewers point about the reference to MI after equation 1.3 of the previous paper where co-Information is defined, we were referring both to the task-relevant and task-irrelevant estimates analysed there collectively in a general sense as ‘MI estimates’ as they both are derived from mutual information, task-irrelevant being the MI between two muscles conditioned on a task variable (conditional mutual information) and task-relevant being the difference between two MI values (co-I is a higher-order MI estimate). This removed the need to continuously refer to each separately throughout the paper which may in its own way cause some confusion. For clarity, in the results of that paper we also provided context for each MI estimate on how they were estimated (see beginning of “Task-irrelevant muscle couplings” and “Task-redundant muscle couplings” and “Task-synergistic muscle couplings” results sections), referring throughout the Venn diagrams depicting them (see Fig.1 of previous paper). In the present study however, for brevity and focus we did not perform an analysis on task-irrelevant muscle interactions and so decided to focus our terminology on co-I (II), a higher-order MI estimate. We acknowledge that this may have caused some confusion but highlight the efforts made to communicate each measure throughout the previous and present study. We have explicitly pointed out this specific focus on task-dependent muscle couplings in this paper at the end of the introduction of the updated manuscript:
“To do so, here we focussed our analysis on quantifying task-dependent muscle couplings (collectively referred to as II), extracting functionally-similar (i.e. redundant) and -complementary (i.e. synergistic) modules…”
(2) The authors should clarify what the following statement means: "Where a muscle interaction was determined to be net redundant/synergistic, their corresponding network edge in the other muscle network was set to zero."
We acknowledge this sentence was unclear/misleading and have now clarified this statement in the following way:
“This computation was performed on all unique m<sub>x</sub> and m<sub>y</sub> pairings, generating sparse symmetric matrices (A) (i.e. A = A<sup>T</sup>) composed separately of non-negative redundant and synergistic values (Fig.5).” Additionally, we have now included an additional figure (fig.5) describing this text graphically.
(3) It should be clarified what the 'm' values are in Equation 1.1. Are these the co-information values after the sparsification and applying the Louvain algorithm to the matrix 'A'? Furthermore, since each task will yield a different co-information value, how is the information from different tasks (r) being combined here?
We thank the reviewer for their attention to detail. For clarity, at the related section of Equation 1.1, we have clarified that the input matrix is composed of co-I estimates:
“The input matrix for PNMF consisted of the sparsified A on both affected and unaffected sides from all participants at both pre- and post-sessions concatenated in their vectorised forms. More specifically, the input matrix composed of redundant or synergistic values was configured such that the set of unique muscle pairings (1 … K) on affected and unaffected sides (m<sub>aff</sub> and m<sub>unaff</sub> respectively)…”.
The co-I estimates in this input matrix are indeed those that survived sparsification in previous steps, however, for determining the number of modules to extract using the Louvain algorithm, this step has no direct impact or transformation on the co-I estimates and is simply employed to derive an empirical input parameter for dimensionality reduction. We refer the reviewer to the following part of this paragraph where this is described:
“The number of muscle network modules identified in this final consensus partition was used as the input parameter for dimensionality reduction, namely projective non-negative matrix factorisation (PNMF) (Fig.1(D)) (Yang & Oja, 2010). The input matrix for PNMF consisted of the sparsified A on both affected and unaffected sides from all participants at both pre- and post-sessions concatenated together in their vectorised form.”
Finally, as the reviewer has mentioned, the co-I estimates from the same muscles pairings but for different tasks, experimental sessions and participants are indeed different, reflecting their task-specific tuning, changes with rehabilitation and individual differences. To combine these representations into low-dimensional components, we employed projective non-negative matrix factorisation (PNMF). As outlined in the previous paper and earlier work on this framework (O’ Reilly & Delis, 2022), application of dimensionality reduction here can generate highly generalisable motor components, highlighting their ability to effectively represent large populations of participants, tasks and sessions, while allowing interesting individual differences mentioned by the reviewer to be buffered into the corresponding activation coefficients. These activation coefficients are for this reason the focus of the cluster analyses in the present study to characterise the post-stroke cohort. We have explicitly provided this reason in the methods section of the updated manuscript:
“We focussed on $a$ here as the extraction of population-level functional modules enabled the buffering of individual differences into the space of modular activations, making them an ideal target for identifying population structure.”
(4) In general, I recommend improving the clarity of the Methods section, particularly by being more precise in defining the quantities that are being calculated. For example, the adjacency matrix should be defined clearly using co-information at the beginning, and explain how it is changed/used throughout the rest of the section.
We thank the reviewer for their constructive advice and have gone to lengths to improve the clarity of the methods section. Firstly, we have addressed all the reviewers comments on various specific sections of the methods, including more clearly the ‘why’ and ‘how’ of what was performed. Secondly, we have now included an additional figure illustrating how co-information was quantified at the network level and separated into redundant and synergistic values (see Fig.5 of updated manuscript). Finally, we have re-structured several paragraphs of the methods section to enhance flow with additional subheadings for clarity.
(5) In the previous paper (O'Reilly & Delis, 2024), the authors applied a tensor decomposition to the interaction matrix and extracted both the spatial and temporal factors. In the current work, the authors simply concatenated the temporal signals and only chose to extract the spatial mode instead. The authors should clarify this choice.
The reviewer is correct in that a different dimensionality reduction approach was employed in the previous paper. In the present study, we instead chose to employ projective non-negative matrix factorisation, as was employed in a preliminary paper on this framework (O’Reilly & Delis, 2022). This decision was made simply based on aiming to maintain brevity and simplicity in the analysis and presentation of results as we introduce other tools to the framework (i.e. the clustering algorithm). Indeed, we could have just as easily employed the tensor decomposition to extract both spatial and temporal components, however we believed the main take away points for this paper could be more easily communicated using spatial networks only. To clarify this difference for readers we have included the following in the methods section:
“The choice of PNMF here, in contrast to the space-time tensor decomposition employed in the parent study (O’Reilly & Delis, 2024), was chosen simply to maintain brevity by focussing subsequent analyses on the spatial domain.”
References
Ó’Reilly D, Delis I. A network information theoretic framework to characterise muscle synergies in space and time. Journal of Neural Engineering. 2022 Feb 18;19(1):016031.
O'Reilly D, Delis I. Dissecting muscle synergies in the task space. Elife. 2024 Feb 26;12:RP87651.
Recommendations for the authors:
Reviewing Editor Comments:
Both reviewers are concerned with the manuscript in its current form. They questioned the relevance of the current approach in providing functional or mechanistic explanations about the rehabilitation process of post-stroke patients. Our eLife Assessment would change if you include comparisons between your current method and classical ones, in addition to improving the description of your method to strengthen the evidence of its robustness.
Reviewer #1 (Recommendations for the authors):
There is a minor typographical error in Figure 2 ("compononents" should be corrected).
This error has been rectified.
Reviewer #2 (Recommendations for the authors):
The authors should be able to address most of my concerns by providing a substantially improved version of the Methods section.
See above responses to the reviewers comments regarding the methods section.
However, I would like the authors to explain in full detail (potentially including a simulation or power analysis) the procedure for estimating the co-information quantity, and to clarify whether it is robust given the sample size used in this paper.
We refer the reviewer to our previous responses outlining with greater clarity the number of samples included in the estimation of co-I. We would also like to mention here that our framework does not make inferences on the statistical significance of individual muscle couplings (i.e. co-I estimates). Instead, these estimates are employed collectively for the sole purpose of pattern recognition. Nevertheless, to generate reliable estimates of the muscle couplings, we have employed a substantial number of samples for each co-I estimate (>20k samples in each variable) addressing the reviewers main concern her.
Author response:
The following is the authors’ response to the original reviews.
Public Reviews:
Reviewer #1 (Public review):
Summary:
The study by Wu et al. uses endogenous bruchpilot expression in a cell-type-specific manner to assess synaptic heterogeneity in adult Drosophila melanogaster mushroom body output neurons. The authors performed genomic on locus tagging of the presynaptic scaffold protein bruchpilot (BRP) with one part of splitGFP (GFP11) using the CRISPR/Cas9 methodology and co-expressed the other part of splitGFP (GFP1-10) using the GAL4/UAS system. Upon expression of both parts of splitGFP, fluorescent GFP is assembled at the N-terminus of BRP, exactly where BRP is endogenously expressed in active zones. For manageable analysis, a high-throughput pipeline was developed. This analysis evaluated parameters like location of BRP clusters, volume of clusters, and cluster intensity as a direct measure of the relative amount of BRP expression levels on site, using publicly available 3D analysis tools that are integrated in Fiji. Analysis was conducted for different mushroom body cell types in different mushroom body lobes using various specific GAL4 drivers. To test this new method of synapse assessment, Wu et al. performed an associative learning experiment in which an odor was paired with an aversive stimulus and found that, in a specific time frame after conditioning, the new analysis solidly revealed changes in BRP levels at specific synapses that are associated with aversive learning.
Strengths:
Expression of splitGFP bound to BRP enables intensity analysis of BRP expression levels as exactly one GFP molecule is expressed per BRP. This is a great tool for synapse assessment. This tool can be widely used for any synapse as long as driver lines are available to co-express the other part of splitGFP in a cell-type-specific manner. As neuropils and thus the BRP label can be extremely dense, the analysis pipeline developed here is very useful and important. The authors have chosen an exceptionally dense neuropil - the mushroom bodies - for their analysis and convincingly show that BRP assessment can be achieved with such densely packed active zones. The result that BRP levels change upon associative learning in an experiment with odor presentation paired with punishment is likewise convincing, and strongly suggests that the tool and pipeline developed here can be used in an in vivo context.
Weaknesses:
Although BRP is an important scaffold protein and its expression levels were associated with function and plasticity, I am still somewhat reluctant to accept that synapse structure profiling can be inferred from only assessing BRP expression levels and BRP cluster volume. Also, is it guaranteed that synaptic plasticity is not impaired by the large GFP fluorophore? Could the GFP10 construct that is tagged to BRP in all BRP-expressing cells, independent of GAL4, possibly hamper neuronal function? Is it certain that only active zones are labeled? I do see that plastic changes are made visible in this study after an associative learning experiment with BRP intensity and cluster volume as read-out, but I would be reassured by direct measurement of synaptic plasticity with splitGFP directly connected to BRP, maybe at a different synapse that is more accessible.
We appreciate the reviewer’s comments. In the revised manuscript, we have clarified that Brp is an important, but not the only player in the active zone. We have included new data to demonstrate that split-GFP tagging does not severely affect the localization and plasticity of Brp and the function of synapses by showing: (1) nanoscopic localization of Brp::rGFP using STED imaging; (2) colocalization between Brp::rGFP and anti-Brp signals/VGCCs; (3) activity-dependent Brp remodeling in R8 photoreceptors; (4) no defect in memory performance when labeling Brp::rGFP in KCs; These four lines of additional evidence further corroborate our approach to characterize endogenous Brp as a proxy of active zone structure.
Reviewer #2 (Public review):
Summary:
The authors developed a cell-type specific fluorescence-tagging approach using a CRISPR/Cas9 induced spilt-GFP reconstitution system to visualize endogenous Bruchpilot (BRP) clusters as presynaptic active zones (AZ) in specific cell types of the mushroom body (MB) in the adult Drosophila brain. This AZ profiling approach was implemented in a high-throughput quantification process, allowing for the comparison of synapse profiles within single cells, cell types, MB compartments, and between different individuals. The aim is to analyse in more detail neuronal connectivity and circuits in this centre of associative learning. These are notoriously difficult to investigate due to the density of cells and structures within a cell. The authors detect and characterize cell-type-specific differences in BRP-dependent profiling of presynapses in different compartments of the MB, while intracellular AZ distribution was found to be stereotyped. Next to the descriptive part characterizing various AZ profiles in the MB, the authors apply an associative learning assay and detect consequent AZ re-organisation.
Strengths:
The strength of this study lies in the outstanding resolution of synapse profiling in the extremely dense compartments of the MB. This detailed analysis will be the entry point for many future analyses of synapse diversity in connection with functional specificity to uncover the molecular mechanisms underlying learning and memory formation and neuronal network logics. Therefore, this approach is of high importance for the scientific community and a valuable tool to investigate and correlate AZ architecture and synapse function in the CNS.
Weaknesses:
The results and conclusions presented in this study are, in many aspects, well-supported by the data presented. To further support the key findings of the manuscript, additional controls, comments, and possibly broader functional analysis would be helpful. In particular:
(1) All experiments in the study are based on spilt-GFP lines (BRP:GFP11 and UAS-GFP1-10).The Materials and Methods section does not contain any cloning strategy (gRNA, primer, PCR/sequencing validation, exact position of tag insertion, etc.) and only refers to a bioRxiv publication. It might be helpful to add a Materials and Methods section (at least for the BRP:GFP11 line). Additionally, as this is an on locus insertion the in BRP-ORF, it needs a general validation of this line, including controls (Western Blot and correlative antibody staining against BRP) showing that overall BRP expression is not compromised due to the GFP insertion and localizes as BRP in wild type flies, that flies are viable, have no defects in locomotion and learning and memory formation and MB morphology is not affected compared to wild type animals.
We thank the reviewer for suggesting these important validations. We included details of the design of the construct and insertion site to the Methods section, performed several new experiments to validate the split-GFP tagging of Brp, and present the data in the revision.
First, to examine whether the transcription of the brp gene is unaffected by the insertion of GFP<sub>11</sub>, we conducted qRT-PCR to compare the brp mRNA levels between brp::GFP<sub>11</sub>, UAS-GFP1-10 and UAS-GFP1-10 and found no difference (Figure 1 - figure supplement 1A).
To further verify the effect of GFP<sub>11</sub> tagging at the protein level, we performed anti-Brp (nc82) immunohistochemistry of brains where GFP is reconstituted pan-neuronally. We found unaltered neuropile localization of nc82 signals (Figure 1 - figure supplement 1C). In presynaptic terminals of the mushroom body calyx, we found integration of Brp::rGFP to nc82 accumulation (Figure 1D). We performed super-resolution microscopy to verify the configuration of Brp::rGFP and confirmed the donut-shape arrangement of Brp::rGFP in the terminals of motor neurons (see Wu, Eno et al., 2025 PLOS Biology), corroborating the nanoscopic assembly of Brp::rGFP at active zones (Kittel et al., 2006 Science).
Furthermore, co-expression of RFP-tagged voltage-gated calcium channel alpha subunit Cacophony (Cac) and Brp::rGFP in PAM-γ5 dopaminergic neurons revealed strong presynaptic colocalization of their punctate clusters (Figure 1E), suggesting that rGFP tagging of Brp did not damage key protein assembly at active zones (Kawasaki et al., 2004 J Neuroscience; Kittel et al., Science).
These lines of evidence suggest that the localization of endogenous Brp is barely affected by the C-terminal GFP<sub>11</sub> insertion or GFP reconstitution therewith. This is in line with a large body of studies confirming that the N-terminal region and coiled-coil domains, but not the C-terminal, region of Brp are necessary and sufficient for active zone localization (Fouquet et al., 2009 J Cell Biol; Oswald et al., 2010 J Cell Biol; Mosca and Luo, 2014 eLife; Kiragasi et al., 2017 Cell Rep; Akbergenova et al., 2018 eLife; Nieratschker et al., 2009 PLoS Genet; Johnson et al., 2009 PLoS Biol; Hallermann et al., 2010 J Neurosci). We nevertheless report homozygous lethality and found the decreased immunoreactive signals in flies carrying the GFP<sub>11</sub> insertion (Figure 1 - figure supplement 1B).
For these reasons, we always use heterozygotes for all the experiments therefore there is no conspicuous defect in locomotion as reported in the original study (Wagh et al., 2005 Neuron). To functionally validate the heterozygotes, we measured the aversive olfactory memory performance of flies where GFP reconstitution was induced in Kenyon cells using R13F02-GAL4. We found that all these transgenes did not alter mushroom body morphology (Figure 7 - figure supplement 1) or memory performance as compared to wild-type flies (Figure 7 - figure supplement 2), suggesting the synapse function required for short-term memory formation is not affected by split-GFP tagging of Brp.
(2) Several aspects of image acquisition and high-throughput quantification data analysis would benefit from a more detailed clarification.
(a) For BRP cluster segmentation it is stated in the Materials and Methods state, that intensity threshold and noise tolerance were "set" - this setting has a large effect on the quantification, and it should be specified and setting criteria named and justified (if set manually (how and why) or automatically (to what)). Additionally, if Pyhton was used for "Nearest Neigbor" analysis, the code should be made available within this manuscript; otherwise, it is difficult to judge the quality of this quantification step.
(b) To better evaluate the quality of both the imaging analysis and image presentation, it would be important to state, if presented and analysed images are deconvolved and if so, at least one proof of principle example of a comparison of original and deconvoluted file should be shown and quantified to show the impact of deconvolution on the output quality as this is central to this study.
We thank the reviewer for suggesting these clarifications. We have included more description to the revised manuscript to clarify the setting of segmentation, which was manually adjusted to optimize the F-score (previous Figure 1D, now moved to Figure 1 -figure supplement 5). We have included the code used for analyzing nearest neighbor distance, AZ density and local Brp density in the revised manuscript (Supplementary file 1), together with a pre-processed sample data sheet (Supplementary file 2).
Regarding image deconvolution, we have clarified the differential use of deconvolved and not-deconvolved images in the revised manuscript. We have also included a quantitative evaluation of Richardson-Lucy iterative deconvolution (Figure 1 - figure supplement 4). We used 20 iterations due to only marginal FWHM improvement beyond this point (Figure 1 - figure supplement 4).
(3) The major part of this study focuses on the description and comparison of the divergent synapse parameters across cell-types in MB compartments, which is highly relevant and interesting. Yet it would be very interesting to connect this new method with functional aspects of the heterogeneous synapses. This is done in Figure 7 with an associative learning approach, which is, in part, not trivial to follow for the reader and would profit from a more comprehensive analysis.
(a) It would be important for the understanding and validation of the learning induced changes, if not (only) a ratio (of AZ density/local intensity) would be presented, but both values on their own, especially to allow a comparison to the quoted, previous AZ remodelling analysis quantifying BRP intensities (ref. 17, 18). It should be elucidated in more detail why only the ratio was presented here.
We thank the reviewer for the suggestion on the presentation of learning-induced Brp remodeling. The reported values in Figure 7C are the correlation coefficient of AZ density and local intensity in each compartment, but not the ratio. These results suggest that subcompartment-sized clusters of AZs with high Brp accumulation (Figure 6) undergo local structural remodeling upon associative learning (Figure 7). For clarity, we have included a schematic of this correlation and an example scatter plot to Figure 6. Unlike the previous studies (refs 17 and 18), we did not observe robust learning-dependent changes in the Brp intensity, possibly due to some confounding factors such as overall expression levels and conditioning protocols as described in the previous and following points, respectively.
(b) The reason why a single instead of a dual odour conditioning was performed could be clarified and discussed (would that have the same effects?).
(c) Additionally, "controls" for the unpaired values - that is, in flies receiving neither shock nor odour - it would help to evaluate the unpaired control values in the different MB compartments.
We use single odor conditioning because it is the simplest way to examine the effect of odor-shock association by comparing the paired and unpaired group. Standard differential conditioning with two odors contains unpaired odor presentation (CS-) even in the ‘paired’ group. We now show that single-odor conditioning induces memory that lasts one day as in differential conditioning (Figure 7B; Tully and Quinn, J Comp Phys A 1985).
(d) The temporal resolution of the effect is very interesting (Figure 7D), and at more time points, especially between 90 and 270 min, this might raise interesting results.
The sampling time points after training was chosen based on approximately logarithmic intervals, as the memory decay is roughly exponential (Figure 7B). This transient remodeling is consistent with the previous studies reporting that the Brp plasticity was short-lived (Zhang et al., 2018 Neuron; Turrel et al., 2022 Current Biol).
(e) Additionally, it would be very interesting and rewarding to have at least one additional assay, relating structure and function, e.g. on a molecular level by a correlative analysis of BRP and synaptic vesicles (by staining or co-expression of SV-protein markers) or calcium activity imaging or on a functional level by additional learning assays.
We thank the reviewer for raising this important point. We have performed calcium imaging of KC presynaptic terminals to correlate the structure and function in another study (see Figure 2 in Wu, Eno et al., 2025 PLOS Biology for more detail). The basal presynaptic calcium pattern along the γ compartments is strikingly similar to the compartmental heterogeneity of Brp accumulation (see also Figure 2 in this study). Considering colocalization of other active-zone components, such as Cac (Figure 1E), we propose that the learning-induced remodeling of local Brp clusters should transiently modulate synaptic properties.
As a response to other reviewers’ interest, we used Brp::rGFP to measure different forms of Brp-based structural plasticity upon constant light exposure in the photoreceptors and upon silencing rab3 in KCs. Since these experiments nicely reproduced the results of previous studies (Sugie et al., Neuron 2013; Graf et al., Neuron 2009), we believe the learning-induced plasticity of Brp clustering in KCs has a transient nature.
Reviewer #3 (Public review):
Summary:
The authors develop a tool for marking presynaptic active zones in Drosophila brains, dependent on the GAL4 construct used to express a fragment of GFP, which will incorporate with a genome-engineered partial GFP attached to the active zone protein bruchpilot - signal will be specific to the GAL4-expressing neuronal compartment. They then use various GAL4s to examine innervation onto the mushroom bodies to dissect compartment-specific differences in the size and intensity of active zones. After a description of these differences, they induce learning in flies with classic odour/electric shock pairing and observe changes after conditioning that are specific to the paired conditioning/learning paradigm.
Strengths:
The imaging and analysis appear strong. The tool is novel and exciting.
Weaknesses:
I feel that the tool could do with a little more characterisation. It is assumed that the puncta observed are AZs with no further definition or characterisation.
We performed additional validation on the tool, including (1) nanoscopic localization of Brp::rGFP using STED imaging; (2) colocalization between Brp::rGFP and anti-Brp signals/VGCCs (Figure 1D-E); 3) activity-dependent active zone remodeling in R8 photoreceptors (Figure 1F). These will be detailed in our point-by-point response below.
Recommendations for the authors:
Reviewer #1 (Recommendations for the authors):
(1) The authors keep stating, they profile or assess synaptic structure by analyzing BRP localization, cluster volume, and intensity. However, I do not think that BRP cluster volume and intensity warrant an educated statement about presynaptic structure as a whole. I do not challenge the usefulness of BRP cluster analysis for synapse evaluation, but as there are so many more players involved in synaptic function, BRP analysis certainly cannot explain it all. This should at least be discussed.
It is correct that Brp is not the only player in the active zone. We have included more discussion on the specific role of Brp (line 84 to 89) and other synaptic markers (line 250) and edited potentially misunderstanding text.
(2) I do see that changes in BRP expression were observed following associative learning, but is it certain, that synaptic plasticity is generally unaffected by the large GFP fluorophore? BRP is grabbing onto other proteins, both with its C- and N-termini. As the GFP is right before the stop codon, it should be at the N-terminus. How far could BRP function be hampered by this? Is there still enough space for other proteins to interact?
We thank the reviewer for sharing the concerns. We here provided three lines of evidence to demonstrate that the Brp assembly at active zones required for synaptic plasticity is unaffected by split-GFP tagging.
First, we assessed olfactory memory of flies that have Brp::rGFP labeled in Kenyon cells and found the performance comparable to wild-type (Figure 7 - figure supplement 2), suggesting the Brp function required for olfactory memory (Knapek et al., J Neurosci 2011) is unaffected by split-GFP tagging.
Second, we measured Brp remodeling in photoreceptors induced by constant light exposure (LL; Sugie et al., 2015 Neuron). Consistent with the previous study, we found that LL decreased the numbers of Brp::rGFP clusters in R8 terminals in the medulla, as compared to constant dark condition (DD). This result validates the synaptic plasticity involving dynamic Brp rearrangement in the photoreceptors. We have included this result into the revised manuscript (Figure 1F).
To further validate protein interaction of Brp::rGFP, we focused on Rab3, as it was previously shown to control Brp allocation at active zones (Graf et al., 2009 Neuron). To this end, we silenced rab3 expression in Kenyon cells using RNAi and measured the intensity of Brp::rGFP clusters in γ Kenyon cells. As previously reported in the neuromuscular junction, we found that rab3 knock-down increased Brp::rGFP accumulation to the active zones, suggesting that Brp::rGFP represents the interaction with Rab3. We have included all the new data to the revised manuscript (Figure 1 - figure supplement 3).
(3) It may well be that not only active-zone-associated BRP is labeled but possibly also BRP molecules elsewhere in the neuron. I would like to see more validation, e.g., the percentage of tagged endogenous BRP associated with other presynaptic proteins.
To answer to what extent Brp::rGFP clusters represent active zones, we double-labelled Brp::rGFP and Cac::tdTomato (Cacophony, the alpha subunit of the voltage-gated calcium channels). We found that 97% of Brp::rGFP clusters showed co-localization with Cac::tdTomato in PAM-γ5 dopamine neurons terminals (Figure 1E), suggesting most Brp::rGFP clusters represent functional AZs.
(4) Z-size is ~200 nm, while x/y pixel size is ~75 nm during acquisition. How far down does the resolution go after deconvolution?
The Z-step was 370 nm and XY pixel size was 79 nm for image acquisition. We performed 20 iterations of Richarson-Lucy deconvolution using an empirical point spread function (PSF). We found that the effect of deconvolution on the full-width at half maximum (FWHM) of Brp::rGFP clusters improves only marginally beyond 20 iterations, when the XY FWHM is around 200 nm and the XZ FWHM is around 450 nm (Figure 1 - figure supplement 4).
(5) Figure Legend 7: What is a "cytoplasm membrane marker"? Does this mean membrane-bound tdTom is sticking into the cytoplasm?
We apologize for the typo and have corrected it to “plasma membrane marker”.
(6) At the end of the introduction: "characterizing multiple structural parameters..." - which were these parameters? I was under the assumption that BRP localization, cluster volume, and intensity were assessed. I do not see how these are structural parameters. Please define what exactly is meant by "structural parameters".
We apologize for the confusion. By "structural parameters”, we indeed referred to the volume, intensity and molecular density of Brp::rGFP clusters. We have revised the sentence to “Characterizing the distinct parameters and localization of Brp::rGFP cluster.”
(7) Next to last sentence of the introduction: "Characterizing multiple structural parameters revealed a significant synaptic heterogeneity within single neurons and AZ distribution stereotypy across individuals." What do the authors mean by "significant synaptic heterogeneity"?
By “synaptic heterogeneity”, we refer to the intracellular variability of active zone cytomatrices reported by Brp clusters. For instance, the intensities of Brp::rGFP clusters within Kenyon cell subtypes were variable among compartments (Figure 2). Intracellular variability of the Brp concentration of individual active zones was higher in DPM and APL neurons than Kenyon cells (Figure 3). These variabilities demonstrate intracellular synaptic heterogeneity. We have revised the sentence to be more specific to the different characters of Brp clusters.
(8) I do not understand the last sentence of the introduction. "These cell-type-specific synapse profiles suggest that AZs are organized at multiple scales, ranging from neighboring synapses to across individuals." What do the authors mean by "ranging from neighboring synapses to across individuals"? Does this mean that even neighboring synapses in the same cell can be different?
We have revised the sentence to “These cell-type-specific synapse profiles suggest that AZs are spatially organized at multiple scales, ranging from interindividual stereotypy to neighboring synapses in the same cells.”
By “neighboring synapses", we refer to the nearest neighbor similarity in Brp levels in some cell-types (Figure 6A-C), and also the sub-compartmental dense AZ clusters with high Brp level in Kenyon cells (Figure 6D-H). By “across individuals”, we refer to the individually conserved active zone distribution patterns in some neurons (Figure 5).
(9) The title talks about cell-type-specific spatial configurations. I do not understand what is meant by "spatial configurations"? Do you mean BRP cluster volume? I think the title is a little misleading.
By “spatial configuration”, we refer to the arrangement of Brp clusters within individual mushroom body neurons. This statement is based on our findings on the intracellular synaptic heterogeneity (see also response to comment #7). We have streamlined the text description in the revised manuscript for clarity.
Reviewer #2 (Recommendations for the authors):
(1) For Figure 3A: exemplary two AZs are compared here, a histogram comparing more AZs would aid in making the point that in general, AZ of similar size have different BRP level (intensities) and how much variation exists.
We have included histograms for Brp::rGFP intensity and cluster volumes to Figure 3 in the revised manuscript.
(2) Line 52: "endogenous synapses" is a confusing term; it's probably meant that the protein levels within the synapse are endogenous and not overexpressed.
We apologize for the confusion and have revised the term to “endogenous synaptic proteins.”
(3) It is not clear from the Materials and Methods section, whether and where deconvolved or not-deconvolved images were used for the quantification pipeline. Please comment on this.
We have now revised the Method section to clarify how deconvolved or not-deconvolved images were differently used in the pipeline.
(4) Line 664 (C) not bold.
We have corrected the error.
(5) 725 "Files" should be Flies.
We have corrected the error.
(6) 727 two times "first".
We have corrected the error.
(7) Figure 7. All (A) etc., not bold - there should be consistent annotation.
We want to thank the reviewer for the detailed proof and have corrected all the errors spotted.
Reviewer #3 (Recommendations for the authors):
(1) Has there been an expression of the construct in a non-neuronal cell? Astrocyte-like cell? Any glia? As some sort of control for background and activity?
As the reviewer suggested, we verified the neuronal expression specificity of Brp::rGFP. Using R86E01-GAL4 and Amon-GAL4, we compared Brp::rGFP in astrocyte-like glia and neuropeptide-releasing neurons. We found no Brp::rGFP puncta in the neuropils in astrocyte-like glia compared to neurons, suggesting Brp::rGFP is specific to neurons. We have included this new dataset to the revised manuscript (Figure 1 - figure supplement 2).
(2) Similarly, expression of the construct co-expressed with a channelrhodopsin, and induction of a 'learning'-like regime of activity, similarly in a control type of experiment, expression of an inwardly rectifying channel (e.g. Kir2.1) to show that increases in size of the BRP puncta are truly activity dependent? The NMJ may be an optimal neuron to use to see the 'donut' structures of the AZs and their increase with activity. Also, are these truly AZs we are seeing here? Perhaps try co-expressing cacophony-dsRed? If the GFP Puncta are active zones, then they should be surrounded by cacophony.
We would like to clarify that we did not find Brp::rGFP size increase upon learning. Instead, we demonstrated that associative training transiently remodelled sub-compartment-sized AZ “hot spots” in Kenyon cells, indicated by the correlation of local intensity and AZ density (Figure 6-7).
To demonstrate split-GFP tagging does not affect activity-dependent plasticity associated with Brp, we measured Brp remodeling in photoreceptors induced by constant light exposure (LL; Sugie et al., 2015 Neuron). Consistent with the previous study, we found that LL decreased the numbers of Brp::rGFP clusters in R8 terminals in the medulla, as compared to constant dark condition (DD). This result validates the synaptic plasticity involving dynamic Brp rearrangement in the photoreceptors (Figure 1F).
As the reviewer suggested, we performed the STED microscopy for the larval motor neuron and confirmed the donut-shape arrangement of Brp::rGFP (Wu, Eno et al., PLOS Biol 2025).
Also following the reviewer’s suggestion, we double-labelled Brp::rGFP and Cac::tdTomato (Cacophony, the alpha subunit of the voltage-gated calcium channels). We found that 97% Brp::rGFP clusters showed co-localization with Cac::tdTomato in PAM-γ5 dopamine neurons terminals (Figure 1E), suggesting most Brp::rGFP clusters represent functional AZs.
(3) In the introduction: Intro, a sentence about BRP - central organiser of the active zone, so a key regulator of activity.
We have included a few more sentences about the role Brp in the active zones to the revised manuscript.
(4) Figure 1 E, line 650 'cite the resource here'.
We thank the reviewer for pointing out the error and we have corrected it.
(5) Many readers may not be MB aficionados, and to make the data more accessible, perhaps use a cartoon of an MB with the cell bodies of the neurons around the MB expressing the constructs highlighted so that the reader can have a wider idea of the anatomy in relation to the MB.
We appreciate these comments and have appended cartoons of the MB to figures to help readers understand the anatomy.
Author response:
The following is the authors’ response to the original reviews.
eLife Assessment
This useful study uses creative scalp EEG decoding methods to attempt to demonstrate that two forms of learned associations in a Stroop task are dissociable, despite sharing similar temporal dynamics. However, the evidence supporting the conclusions is incomplete due to concerns with the experimental design and methodology. This paper would be of interest to researchers studying cognitive control and adaptive behavior, if the concerns raised in the reviews can be addressed satisfactorily.
We thank the editors and the reviewers for their positive assessment of our work and for providing us with an opportunity to strengthen this manuscript. Please see below our responses to each comment raised in the reviews.
Public Reviews:
Reviewer #1 (Public review):
Summary:
This study focuses on characterizing the EEG correlates of item-specific proportion congruency effects. In particular, two types of learned associations are characterized. One being associations between stimulus features and control states (SC), and the other being stimulus features and responses (SR). Decoding methods are used to identify SC and SR correlates and to determine whether they have similar topographies and dynamics.
The results suggest SC and SR associations are simultaneously coactivated and have shared topographies, with the inference being that these associations may share a common generator.
Strengths:
Fearless, creative use of EEG decoding to test tricky hypotheses regarding latent associations. Nice idea to orthogonalize the ISPC condition (MC/MI) from stimulus features.
Thank you for acknowledging the strength in EEG decoding and design. We have addressed all your concerns raised below point by point.
Weaknesses:
(1a) I'm relatively concerned that these results may be spurious. I hope to be proven wrong, but I would suggest taking another look at a few things.
While a nice idea in principle, the ISPC manipulation seems to be quite confounded with the trial number. E.g., color-red is MI only during phase 2, and is MC primarily only during Phase 3 (since phase 1 is so sparsely represented). In my experience, EEG noise is highly structured across a session and easily exploited by decoders. Plus, behavior seems quite different between Phase 2 and Phase 3. So, it seems likely that the classes you are asking the decoder to separate are highly confounded with temporally structured noise.
I suggest thinking of how to handle this concern in a rigorous way. A compelling way to address this would be to perform "cross-phase" decoding, however I am not sure if that is possible given the design.
Thank you for raising this important issue. To test whether decoding might be confounded by temporally structured noise, we performed a control decoding analysis. As the reviewer correctly pointed out, cross-phase decoding is not possible due to the experimental design. Alternatively, to maximize temporal separation between the training and test data, we divided the EEG data in phase 2 and phase 1&3 into the first and second half chronologically. Phase 1 and 3 were combined because they share the same MC and MI assignments. We then trained the decoders on one half and tested them on the other half. Finally, we averaged the decoding results across all possible assignments of training and test data. The similar patterns (Supplementary Fig.1) observed confirmed that the decoding results are unlikely to be driven by temporally structured noise in the EEG data. The clarification has been added to page 13 of the revised manuscript.
(1b) The time courses also seem concerning. What are we to make of the SR and SC timecourses, which have aggregate decoding dynamics that look to be <1Hz?
As detailed in the response to your next comment, some new results using data without baseline correction show a narrower time window of above-chance decoding. We speculate that the remaining results of long-lasting above-chance decoding could be attributed to trials with slow responses (some responses were made near the response deadline of 1500 ms). Additionally, as shown in Figure 6a, the long-lasting above-chance decoding seems to be driven by color and congruency representations. Thus, it is also possible that the binding of color and congruency contributes to decoding. This interpretation has been added to page 17 of the revised manuscript.
(1c) Some sanity checks would be one place to start. Time courses were baselined, but this is often not necessary with decoding; it can cause bias (10.1016/j.jneumeth.2021.109080), and can mask deeper issues. What do things look like when not baselined? Can variables be decoded when they should not be decoded? What does cross-temporal decoding look like - everything stable across all times, etc.?
As the reviewer mentioned, baseline-corrected data may introduce bias to the decoding results. Thus, we cited the van Driel et al (2021) paper in the revised manuscript to justify the use of EEG data without baseline-correction in decoding analysis (Page 27 of the revised manuscript), and re-ran all decoding analysis accordingly. The new results revealed largely similar results (Fig. 2, 4, 6 and 8 in the revised manuscript) with the following exceptions: narrower time window for separatable SC subspace and SR subspace (Fig. 4b), narrower time window for concurrent representations of SC and SR (Fig. 6a-b), and wider time window for the correlations of SC/SR representations with RTs (Fig. 8).
(2) The nature of the shared features between SR and SC subspaces is unclear.
The simulation is framed in terms of the amount of overlap, revealing the number of shared dimensions between subspaces. In reality, it seems like it's closer to 'proportion of volume shared', i.e., a small number of dominant dimensions could drive a large degree of alignment between subspaces.
What features drive the similarity? What features drive the distinctions between SR and SC? Aside from the temporal confounds I mentioned above, is it possible that some low-dimensional feature, like EEG congruency effect (e.g., low-D ERPs associated with conflict), or RT dynamics, drives discriminability among these classes? It seems plausible to me - all one would need is non-homogeneity in the size of the congruency effect across different items (subject-level idiosyncracies could contribute: 10.1016/j.neuroimage.2013.03.039).
Thank you for this question. To test what dimensions are shared between SC and SR subspaces, we first identify which factors can be shared across SC and SR subspaces. For SC, the eight conditions are the four colors × ISPC. Thus, the possible shared dimensions are color and ISPC. Additionally, because the four colors and words are divided into two groups (e.g., red-blue and green-yellow, counterbalanced across subjects, see Methods), the group is a third potential shared dimension. Similarly, for SR decoders, potential shared dimensions are word, ISPC and group. Note that each class in SC and SR decoders has both congruent and incongruent trials. Thus, congruency is not decodable from SC/SR decoders and hence unlikely to be a shared dimension in our analysis. To test the effect of sharing for each of the potential dimensions, we performed RSA on decoding results of the SC decoder trained on SR subspace (SR | SC) (Supplementary Fig. 4a) and the SR decoder trained on SC subspace (SC | SR) (Supplementary Fig. 4b), where the decoders indicated the decoding accuracy of shared SC and SR representations. In the SC classes of SR | SC, word red and blue were mixed within the same class, same were word yellow and green. The similarity matrix for “Group” of SR | SC (Supplementary Fig. 4a) shows the comparison between two word groups (red & blue vs. yellow & green). The similarity matrix for “Group” of SC | SR (Supplementary Fig. 4b) shows the comparison between two color groups (red & blue vs. yellow & green).
The RSA results revealed that the contributions of group to the SC decoder (Supplementary Fig. 5a) and the SR decoder (Supplementary Fig. 5b) were significant. Meanwhile, a wider time window showed significant effect of color on the SC decoder (approximately 100 - 1100 ms post-stimulus onset, Supplementary Fig. 5a) and a narrower time window showed significant effect of word on SR decoder (approximately 100 - 500 ms post-stimulus onset, Supplementary Fig. 5b). However, we found no significant effect of ISPC on either SC or SR decoders. We also performed the same analyses on response-locked data from the time window -800 to 200 ms. The results showed shared representation of color in the SC decoder (Supplementary Fig. 5c) and group in both decoders (Supplementary Fig. 5c-d). Overall, the above results demonstrated that color, word and group information are shared between SC and SR subspaces.
Lastly, we would like to stress that our main hypothesis for the cross-subspace decoding analysis is that SR and SC subspaces are not identical. This hypothesis was supported by lower decoding accuracy for cross-subspace than within-subspace decoders and enables following analyses that treated SC and SR as separate representations.
We have added the interpretation to page 13-14 of the revised manuscript.
(3) The time-resolved within-trial correlation of RSA betas is a cool idea, but I am concerned it is biased. Estimating correlations among different coefficients from the same GLM design matrix is, in general, biased, i.e., when the regressors are non-orthogonal. This bias comes from the expected covariance of the betas and is discussed in detail here (10.1371/journal.pcbi.1006299). In short, correlations could be inflated due to a combination of the design matrix and the structure of the noise. The most established solution, to cross-validate across different GLM estimations, is unfortunately not available here. I would suggest that the authors think of ways to handle this issue.
Thank you for raising this important issue. Because the bias comes from the covariance between the regressors and the same GLM was applied to all time points in our analysis, we assume that the inflation would be similar at different time points. Therefore, we calculated the correlation of SC and SR betas ranging from -200 to 0 ms relative to stimulus onset as a baseline (i.e., no SC or SR representation is expected before the stimulus onset) and compared the post-stimulus onset correlation coefficients against this baseline. We hypothesized that if the positively within-trial correlation of SC and SR betas resulted from the simultaneous representation instead of inflation, we should observe significantly higher correlation when compared with the baseline. To examine this hypothesis, we first performed the linear discriminant analysis (Supplementary Fig. 7a) and RSA regression (Supplementary Fig. 7b) on the -200 - 0 ms window relative to stimulus onset. We then calculated the average r<sub>baseline</sub> of SC and SR betas on that time window for each participant (group results at each time point are shown in Supplementary Fig. 7c) and computed the relative correlation at each post-stimulus onset time point using (fisher-z (r) - fisher-z (r<sub>baseline</sub>)). Finally, we performed a simple t test at the group level on baseline-corrected correlation coefficients with Bonferroni correction. The results (Fig. 6c) showed significantly more positive correlation from 100 - 500 ms post-stimulus onset compared with baseline, supporting our hypothesis that the positive within-trial correlation of SC and SR betas arise from simultaneous representation rather than inflation. The related interpretation was added to page 17 of the revised manuscript.
(4) Are results robust to running response-locked analyses? Especially the EEG-behavior correlation. Could this be driven by different RTs across trials & trial-types? I.e., at 400 ms poststim onset, some trials would be near or at RT/action execution, while others may not be nearly as close, and so EEG features would differ & "predict" RT.
Thanks for this question. We now pair each of the stimulus-locked EEG analysis in the manuscript with response-locked analysis. To control for RT variations among trial types, when using the linear mixed model (LMM) to predict RTs from trial-wise RSA results, we included a separate intercept for each of the eight trial types in SC or SR. Furthermore, at each time point, we only included trials that have not generated a response (for stimulus-locked analysis) or already started (for response-locked analysis). All the results (Fig. 3, 5, 7, 9 in the revised manuscript) are in support of our hypothesis. We added these detailed to page 31 of the revised manuscript.
(5) I suggest providing more explanation about the logic of the subspace decoding method - what trialtypes exactly constitute the different classes, why we would expect this method to capture something useful regarding ISPC, & what this something might be. I felt that the first paragraph of the results breezes by a lot of important logic.
In general, this paper does not seem to be written for readers who are unfamiliar with this particular topic area. If authors think this is undesirable, I would suggest altering the text.
To improve clarity, we revised the first paragraph of the SC and SR association subspace analysis to list the conditions for each of the SC and SR decoders and explain more about how the concept of being separatable can be tested by cross-decoding between SC and SR subspaces. The revised paragraph now reads:
“Prior to testing whether controlled and non-controlled associations were represented simultaneously, we first tested whether the two representations were separable in the EEG data.
In other words, we reorganized the 16 experimental conditions into 8 conditions for SC (4 colors × MC/MI, while collapsing across SR levels) and SR (4 words × 2 possible responses per word, while collapsing across SC levels) associations separately. If SC and SR associations are not separable, it follows that they encode the same information, such that both SC and SR associations can be represented in the same subspace (i.e., by the same information encoded in both associations). For example, because (1) the word can be determined by the color and congruency and (2) the most-likely response can be determined by color and ISPC, the SR association (i.e., association between word and most-likely response) can in theory be represented using the same information as the SC association. On the other hand, if SC and SR associations are separable, they are expected to be represented in different subspaces (i.e., the information used to encode the two associations is different). Notably, if some, but not all, information is shared between SC and SR associations, they are still separable by the unique information encoded. In this case, the SC and SR subspaces will partially overlap but still differ in some dimensions. To summarize, whether SC and SR associations are separable is operationalized as whether the associations are represented in the same subspace of EEG data. To test this, we leveraged the subspace created by the LDA (see Methods). Briefly, to capture the subspace that best distinguishes our experimental conditions, we trained SC and SR decoders using their respective aforementioned 8 experimental conditions. We then projected the EEG data onto the decoding weights of the LDA for each of the SC and SR decoders to obtain its respective subspace. We hypothesized that if SC and SR subspaces are identical (i.e., not separable), SC/SR decoding accuracy should not differ by which subspace (SC or SR) the decoder is trained on. For example, SC decoders trained in SC subspace should show similar decoding performance as SC decoders trained in SR subspace. On the other hand, if SC and SR association representations are in different subspaces, the SC/SR subspace will not encode all information for SR/SC associations. As a result, decoding accuracy should be higher using its own subspace (e.g., decoding SC using the SC subspace) than using the other subspace (e.g., decoding SC using the SR subspace). We used cross-validation to avoid artificially higher decoding accuracy for decoders using their own subspace (see Methods).” (Page 11-12).
We also explicitly tested what information is shared between SC and SR representations (see response to comment #2). Lastly, to help the readers navigate the EEG results, we added a section “Overview of EEG analysis” to summarize the EEG analysis and their relations in the following manner:
“EEG analysis overview. We started by validating that the 16 experimental conditions (8 unique stimuli × MC/MI) were represented in the EEG data. Evidence of representation was provided by above-chance decoding of the experimental conditions (Fig. 2-3). We then examined whether the SC and SR associations were separable (i.e., whether SC and SR associations were different representations of equivalent information). As our results supported separable representations of SC and SR association (Fig. 4-5), we further estimated the temporal dynamics of each representation within a trial using RSA. This analysis revealed that the temporal dynamics of SC and SR association representations overlapped (Fig. 6a-b, Fig. 7a-b). To explore the potential reason behind the temporal overlap of the two representations, we investigated whether SC and SR associations were represented simultaneously as part of the task representation, independently from each other, or competitively/exclusively (e.g., on some trials only SC association was represented, while on other trials only SR association was represented). This was done by assessing the correlation between the strength of SC and SR representations across trials (Fig. 6c, Fig. 7c). Lastly, we tested how SC and SR representations facilitated performance (Fig.8-9).” (Page 8-9).
Minor suggestions:
(6) I'd suggest using single-trial RSA beta coefficients, not t-values, as they can be more stable (it's a t-value based on 16 observations against 9 or so regressors.... the SE can be tiny).
Thank you for your suggestion. To choose between using betas and t-values, we calculate the proportion of outliers (defined as values beyond mean ± 5 SD) for each predictor of the design matrix and each subject. We found that outliers were less frequent for t-values than for beta coefficients (t-values: mean = 0.07%, SD = 0.009%; beta-values: mean = 0.19%, SD = 0.033%). Thus, we decided to stay with t-values.
(7) Instead of prewhitening the RTs before the HLM with drift terms, try putting those in the HLM itself, to avoid two-stage regression bias.
Thank you for your suggestion. Because our current LMM included each of the eight trial types in SC or SR as separate predictors with their own intercepts (as mentioned above), adding regressors of trial number and mini blocks (1-100 blocks) introduced collinearity (as ISPC flipped during the experiment). We therefore excluded these regressors from the current LMM (Page 31).
(8) The text says classical MDS was performed on decoding *accuracy* - is this accurate?
We now clarify in the manuscript that it is the decoders’ probabilistic classification results (Page 28).
(9) At a few points, it was claimed that a negative correlation between SC and SR would be expected within single trials, if the two were temporally dissociable. Wouldn't it also be possible that they are not correlated/orthogonal?
We agree with the reviewer and revised the null hypothesis in the cross-trial correlation analysis to include no correlation as SC and SR association representations may be independent from each other (Page 17, 22).
Reviewer #2 (Public review):
Summary:
In this EEG study, Huang et al. investigated the relative contribution of two accounts to the process of conflict control, namely the stimulus-control association (SC), which refers to the phenomenon that the ratio of congruent vs. incongruent trials affects the overall control demands, and the stimulus-response association (SR), stating that the frequency of stimulusresponse pairings can also impact the level of control. The authors extended the Stroop task with novel manipulation of item congruencies across blocks in order to test whether both types of information are encoded and related to behaviour. Using decoding and RSA, they showed that the SC and SR representations were concurrently present in voltage signals, and they also positively co-varied. In addition, the variability in both of their strengths was predictive of reaction time. In general, the experiment has a solid design, but there are some confounding factors in the analyses that should be addressed to provide strong support for the conclusions.
Strengths:
(1) The authors used an interesting task design that extended the classic Stroop paradigm and is potentially effective in teasing apart the relative contribution of the two different accounts regarding item-specific proportion congruency effect, provided that some confounds are addressed.
(2) Linking the strength of RSA scores with behavioural measures is critical to demonstrating the functional significance of the task representations in question.
Thank you for your positive feedback. We hope our responses below address your concerns.
Weakness:
(1) While the use of RSA to model the decoding strength vector is a fitting choice, looking at the RDMs in Figure 7, it seems that SC, SR, ISPC, and Identity matrices are all somewhat correlated. I wouldn't be surprised if some correlations would be quite high if they were reported. Total orthogonality is, of course, impossible depending on the hypothesis, but from experience, having highly covaried predictors in a regression can lead to unexpected results, such as artificially boosting the significance of one predictor in one direction, and the other one to the opposite direction. Perhaps some efforts to address how stable the timed-resolved RSA correlations for SC and SR are with and without the other highly correlated predictors will be valuable to raising confidence in the findings.
Thank you for this important point. The results of proportion of variability explained shown in the Author response table 1 below, indicated relatively higher correlation of SC/SR with Color and Identity. We agree that it is impossible to fully orthogonalize them. To address the issue of collinearity, we performed a control RSA by removing predictors highly correlated with others. Specifically, we calculated the variance inflation factor (VIF) for each predictor. The Identity predictor had a high VIF of 5 and was removed from the RSA. All other predictors had VIFs < 4 and were kept in the RSA. The results (Supplementary Fig. 6) showed patterns similar to the results with the Identity predictor, suggesting that the findings are not significantly influenced by collinearity. We have added the interpretation to page 17 of the revised manuscript.
Author response table 1.
Proportion of variability explained (r<sup>2</sup>) of RSA predictors.
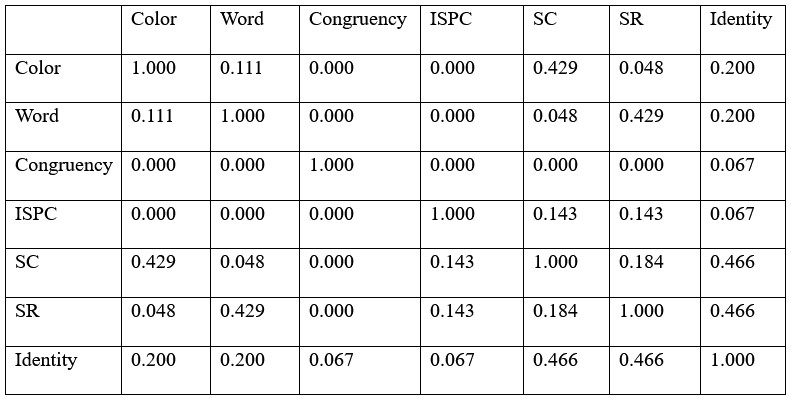
(2) In "task overview", SR is defined as the word-response pair; however, in the Methods, lines 495-496, the definition changed to "the pairing between word and ISPC" which is in accordance with the values in the RDMs (e.g., mccbb and mcirb have similarity of 1, but they are linked to different responses, so should they not be considered different in terms of SR?). This needs clarification as they have very different implications for the task design and interpretation of results, e.g., how correlated the SC and SR manipulations were.
Thank you for pointing out this important issue with how our operationalization captures the concept in questions. In the revised manuscript, we clarified the stimulus-response (SR) association is the link between the word and the most-likely response (i.e., not necessarily the actual response on the current trial). This association is likely to be encoded based on statistical learning over several trials. On each trial, the association is updated based on the stimulus and the actual response. Over multiple trials, the accumulated association will be driven towards the most-common (i.e., most-likely) response. In our ISPC manipulation, a color is presented in mostly congruent/incongruent (MC/MI) trials, which will also pair a word with a most-likely response. For example, if the color blue is MC, the color blue, which leads to the response blue, will co-occur with the word blue with high frequency. In other words, the SR association here is between the word blue and the response blue. As the actual response is not part of the SR association, in the RDM two trial types with different responses may share the same SR association, as long as they share the same word and the same ISPC manipulation, which, by the logic above, will produce the same most-likely response. These clarifications have been added to page 4 and 29 of the revised manuscript.
In the revised manuscript (Page 17), we addressed how much the correlated SC and SR predictors in the RDM could affect the correlation analysis between SC and SR association representation strength. Specifically, we conducted the RSA using the same GLM on EEG data prior to stimulus onset (Supplementary Fig. 7a-b). As no SC and SR associations are expected to be present before stimulus onset, the correlation between SC and SR representation would serve as a baseline of inflation due to correlated predictors in the GLM (Supplementary Fig. 7c, also see comment #3 of R1). The SC-SR correlation coefficients following stimulus onset was then compared to the baseline to control for potential inflation (Fig. 6c). Significantly above-baseline correlation was still observed between ~100-500 ms post-stimulus onset, providing support for the hypothesis that SC and SR are encoded in the same task representation.
Minor suggestions:
(3) Overall, I find that calling SC-controlled and SR-uncontrolled representations unwarranted. How is the level controlledness defined? Both are essentially types of statistical expectation that provide contextual information for the block of tasks. Is one really more automatic and requires less conscious processing than the other? More background/justification could be provided if the authors would like to use these terms.
Following your advice, we have added more discussion on how controlledness is conceptualized in this work and in the literature, which reads:
“We consider SC and SR as controlled and uncontrolled respectively based on the literature investigating the mechanism of ISPC effect. The SC account posits that the ISPC effect results from conflict and involves conflict adaptation, which requires the regulation of attention or control (Bugg & Hutchison, 2013; Bugg et al., 2011; Schmidt, 2018; Schmidt & Besner, 2008). On the other hand, the SR account argues that ISPC effect does not require conflict adaptation but instead reflects contingency leaning. That is, the response can be directly retrieved from the association between the stimulus and the most-likely response without top-down regulation of attention or control. As more empirical evidence emerged, researchers advocating control view began to acknowledge the role of associative learning in cognitive control regarding the ISPC effect (Abrahamse et al., 2016). SC association has been thought to include both automatic that is fast and resource saving and controlled processes that is flexible and generalizable (Chiu, 2019). Overall, we do not intend to claim that SC is entirely controlled or SR is completely automatic. We use SC-controlled and SR-uncontrolled representations to align with the original theoretical motivation and to highlight the conceptual difference between SC and SR associations.” (Page 24-25)
(4) Figures 3c and d: the figures could benefit from more explanation of what they try to show to the readers. Also for 3d, the dimensions were aligned with color sets and congruencies, but word identities were not linearly separable, at least for the first 3 axes. Shouldn't one expect that words can be decoded in the SR subspace if word-response pairs were decodable (e.g., Figure 3b)?
Thank you for the insightful observation. We now clarified that Fig. 3c and d in the original manuscript (Fig. 4c and d in the current manuscript) aim to show how each of the 8 trial types in the SC and SR subspaces are represented. The MDS approach we used for visualization tries to preserve dissimilarity between trial types when projecting from data from a high dimensional to a low dimensional space. However, such projection may also make patterns linearly separatable in high dimensional space not linearly separatable in low dimensional space. For example, if the word blue has two points (-1, -1) and (1, 1) and the word red has two points (-1, 1) and (1, -1), they are not linearly separatable in the 2D space. Yet, if they are projected from a 3D space with coordinates of (-1, -1, -0.1), (1, 1, -0.1), (-1, 1, 0.1) and (1, -1, 0.1), the two words can be linearly separatable using the 3<sup>rd</sup> dimension. Thus, a better way to test whether word can be linearly separated in SR subspace is to perform RSA on the original high dimensional space. We performed the RSA with word (Supplementary Fig. 2) on the SR decoder trained on the SR subspace. Note that in Fig. 3c and d of the original script (Fig. 4c and d in the current manuscript) there are two pairs of words that are not linearly separable: red-blue and yellow-green. Thus, we specifically tested the separability within the two pairs using the one predictor for each pair, as shown in Supplementary Fig. 2. The results showed that within both word pairs individual words were presented above chance level (Supplementary Fig. 3). Considering that the decoders are linear, this finding indicates linear separability of the word pairs in the original SR subspace. The clarification has been added to page 13 (the end of the second paragraph) of the revised manuscript.
References
Abrahamse, E., Braem, S., Notebaert, W., & Verguts, T. (2016). Grounding cognitive control in associative learning. Psychological Bulletin, 142(7), 693-728.doi:10.1037/bul0000047.
Bugg, J. M., & Hutchison, K. A. (2013). Converging evidence for control of color-word Stroop interference at the item level. Journal of Experimental Psychology:Human Perception and Performance, 39(2), 433-449. doi:10.1037/a0029145.
Bugg, J. M., Jacoby, L. L., & Chanani, S. (2011). Why it is too early to lose control in accounts of item-specific proportion congruency effects. Journal of Experimental Psychology: Human Perception and Performance, 37(3), 844-859. doi:10.1037/a0019957.
Chiu, Y.-C. (2019). Automating adaptive control with item-specific learning. In Psychology of Learning and Motivation (Vol. 71, pp. 1-37).
Schmidt, J. R. (2018). Evidence against conflict monitoring and adaptation: An updated review. Psychonomic Bulletin & Review, 26(3), 753-771. doi:10.3758/s13423018-1520-z.
Schmidt, J. R., & Besner, D. (2008). The Stroop effect: Why proportion congruent has nothing to do with congruency and everything to do with contingency. Journal of Experimental Psychology: Learning, Memory, and Cognition, 34(3), 514-523. doi:10.1037/0278-7393.34.3.514.
y pushing back three decades, past the recent waves of “new” immigrants from southern and Eastern Europe, Latin America, and Asia, the law made it extremely difficult for immigrants outside northern Europe to legally enter the United States.)
not much has changed since back then, there is still this decline for new immigrants now
That begs the obvious question: whether they’ve reached that goal yet. Not a chance, said Shah. “It’s a work in progress, right? It’s forever a work in progress. By definition, I don’t think we’ll ever reach it, but I think we are further along than almost anyone else.”
Me gusta en un 50/50 esta forma de pensar, si bien nada es perfecto y todo puede mejorar y evolucionar con el tiempo, no me cerraría a pensar de que estoy lejos o que no podría llegar a la meta que me propuse en cierto momento. Todo en la vida es resiliencia y mejora continua de procesos de manera progresiva y alcanzable.
(Karpsinki also set a Guinness World Record in 2006 for the fastest single-fare journey across the whole of New York City’s subway system; he’s a determined guy who doesn’t like to waste time.)
Me parece algo totalmente genial (dejando de lado de que no todo el mundo tiene un récord guinness y todos los requisitos que solicitan para tenerlo) sino por el hecho de que no es algo aleatorio.
Recuerdo haber leído sobre ese récord hace un tiempo y si no me equivoco era sobre recorrer cierta cantidad de estaciones de metro (unas 400 y algo) en un tiempo de 24 horas ("pasaditas") y que estuvo vigente hasta cierto tiempo, lo que me parece fascinante es que cómo dije anteriormente, no fue algo esporádico, fue algo planeado, algo planificado en equipo
Like many revolutionary changes in human history, it started with a flash of frustration.
Cómo toda gran idea novedosa o innovadora que nace de la incomodidad ...
Ser disruptivo y crear algo que cambie y mejore las reglas convencionales es algo que siempre he de admirar. Tener la convicción de diseñar algo que se sabe que reúne lo mejor de varios sistemas es algo que no todo el mundo hace, si bien quisieron hacer algo más "pequeño, propio y privado" (que se entiende muy bien, no por el tema de envidia o privatización sino porque quizá uno cómo persona no dimensiona el impacto de sus creaciones), algo que me llamó la atención es que fueron de lleno a crear algo a la altura de los lenguajes de alto nivel (básicamente que se pueden hacer más y mejores cosas sin tantas líneas de código), ósea que simplemente no fue un típico proyecto que ya existía, sino que intentaron ir más allá de una vez, simplemente adelantados a su tiempo, es increíble
The success has been such that the foursome joined forces with two others to create Julia Computing, the commercial advisory arm for the language. Setting up the commercial arm was a positive but nerve-racking moment, Shah said. Indeed, he pegged it as the most difficult time for Julia: “It was less to do with Julia and more [to do with] how we can make it self-sustaining. We knew it was the right time, but at the same time, it was scary to imagine doing that.”
La verdadera ruptura fue la transición de un proyecto entre amigos a una compañía auténtica, para Shah y su equipo, el desafío no consistía en el aspecto técnico del lenguaje, que ya era excelente; sino en cómo hacer que sobreviviera: convertir un código gratuito en una empresa sostenible. Fue una decisión, abandonar el experimento académico y transformarlo en un instrumento profesional que hoy emplean empresas de gran tamaño en cualquier parte del mundo.
That such a language didn’t exist frustrated Karpinski, and he expressed the sentiment to his friend Viral Shah toward the end of his time at UC Santa Barbara. Shah, who had previously worked at Interactive Supercomputing for Alan Edelman—an MIT professor and world-renowned mathematician responsible for Edelman’s law—and had since moved to Bengaluru, India, to work on a countrywide biometric identification project, agreed. So did Jeff Bezanson, a colleague of Shah’s at Interactive Supercomputing, as well as Edelman himself.
Básicamente, fue una "frustración colectiva" entre amigos, que unió a mentes brillantes Karpinski expresó su inconformidad a Shah, quien a su vez convenció a Bezanson y Edelman, decidieron dejar de esperar que no existiera una la herramienta tecnológica perfecta y crearon su propia solución .
“We were really just building something for ourselves,” said Julia co-creator Stefan Karpinski, a Harvard Mathematics alum with a PhD in computer science from the University of California, Santa Barbara. (Karpsinki also set a Guinness World Record in 2006 for the fastest single-fare journey across the whole of New York City’s subway system; he’s a determined guy who doesn’t like to waste time.)
Esta anécdota de Karpinski lo dice todo, Julia fue creado por gente que odiaba perder el tiempo, en otras palabras Julia es el resultado de expertos que se cansaron de esperar y decidieron construir un diseño mas ágil en el mundo de programación.
Like many revolutionary changes in human history, it started with a flash of frustration. Today, Julia is ranked among the top programming languages, and is deployed by the likes of Amazon, Apple, Facebook, NASA, and Uber. But when its creators started building it nearly a decade ago, their goal was a lot smaller.
A veces la frustración en cualquier campo es el combustible de las mejores innovaciones tecnológicas y el caso Julia y sus creadores no es exención.
Piercing that veil between the user and the developer has been really eye-opening
La colaboración entre comunidad y desarrolladores es imprescindible ya que estos mismos usuarios al encontrarse con necesidades propias y la adaptabilidad de las herramientas en condición de software libre genera una distribución y una evolución del proyecto de una manera que el equipo original jamás hubiera logrado. Es importante contar con el desarrollo y ayuda de cualquier persona interesada ya que al fin y al cabo de esa misma manera se hace la ciencia, mediante comunicación y aportando a lo ya existente.
creando algoritmos utilizando MATLAB, C y R
Hasta ahora no sabía de lenguajes de programación creados a partir de combinar varios lenguajes existentes y establecidos para transformar algo nuevo, ya ahora se me hace una idea muy interesante que se alinea con el objetivo que se planteó al principio el cual era hacer un lenguaje accesible para todos, cómodo para los principiantes y completo para los veteranos, por lo que este esfuerzo de crear algo nuevo con bases de otros se entiende como tomar los mejor de cada uno y crear algo nuevo mas allá de la suma de sus partes.
“Sin esas contribuciones, creo que sería muy difícil para Julia ser lo que es.”
Cuando Julia es puesta en código abierto, se convierte en un espacio donde muchas personas pueden contribuir y también proponer una mejora continua. Considero que de esta manera los usuarios dejan de solo consumir información a crear nuevo conocimiento a partir de sus intervenciones.
El objetivo del equipo de crear un lenguaje aficionado que pudiera combinar velocidad y profundidad fue recibido inicialmente con escepticismo
Creo que el hecho de siempre crear algo para hacer un cambio mayor en el mundo, trae muchos problemas como el hecho de no querer usarlo por ser nuevo, pero por lo que se nos cuenta, realmente era algo diferente a lo que ya habia
Por la noche, pasaba horas frente a su ordenador de casa, intentando programar un sistema que acabaría reemplazando los lenguajes de programación que usaba en su trabajo diurno
Es curioso como en algunas historias tambien se escuchan temas similares, una persona que tiene un trabajo en una empresa haciendo una labor, pero cuando tienen tiempo a solas, y esa libertad de crear, es cuando avanzan en su proyecto personal
Lo que nos mantiene unidos es el objetivo de construir el mejor software numérico y matemático posible, mucho mejor que cualquier cosa que exista hoy en día
Me encanta esta frase ya que resalta que lo que realmente une a las personas no es solo la tecnología en sí, sino un propósito compartido y no individual.
había sido dominio exclusivo de un puñado de personas de repente estaba siendo criticado por miles de personas a la vez.Algunos de esos usuarios se convirtieron en colaboradores, aportando su experiencia al desarrollo del proyecto.—y la base de colaboradores de Julia se expandió rápidamente. "A finales de 2012, teníamos cerca de 100 colaboradores", dijo Shah. (Ahora son 680). "Sin esas contribuciones, creo que sería muy difícil que Julia fuera lo que es".
¿Un lenguaje se vuelve grande solo con ser bueno? Considero firmemente que necesita de una comunidad que lo respalde.
El impulso inicial detrás de Julia fue el deseo de un lenguaje de programación que combinara elementos de la funcionalidad de alto nivel de MATLAB y R con la velocidad de C o Ruby, como lo expresó Karpinski
Esto es bastante real, ya que la mayoría de lenguas de programación nacen de una necesidad.
Shah and Karpinski agree that the work is never finished. Julia is constantly evolving, buoyed by its open-source ethos and the broad range of voices in its contributor base. “They enrich Julia in ways we could never have imagined ourselves,” said Shah.
El trabajo colaborativo del código abierto es lo que permite que evolucione contantemente, si algo a ellos los creadores no se les ocurre, puede que a otro se le ocurra algo mejor. y ese constante cambio puede llegar a mejores cosas.
That begs the obvious question: whether they’ve reached that goal yet. Not a chance, said Shah. “It’s a work in progress, right? It’s forever a work in progress. By definition, I don’t think we’ll ever reach it, but I think we are further along than almost anyone else.”
Ellos lo saben, con tantos desarrollos en proceso y la tecnología corriendo a grandes pasos, su proyecto no tendrá final, siempre estará en constante evolución, e impactando en su proceso.
From the initial suggestion to create a new, fast programming language to the first commit, which was made in August 2009, the team moved quickly. “We didn’t spend a lot of time talking about it,” said Karpinski. “We had one thread of emails back and forth, then Jeff, Viral, and I said, ‘Let’s do it.’”
Es curioso como se dio el comienzo de este lenguaje, sin tanto tramite o burocracia, solo una charla entre colegas con correos y pasaron manos a la obra, es gratificante ver como un proyecto así nace sin tanto papeleo, solo personas, una idea y ganas de desarrollar algo.
The initial drive behind Julia was the desire for a programming language that combined elements of the high-level functionality of MATLAB and R with the speed of C or Ruby—as Karpinski put it, “the best of all worlds.”
Las grandes invenciones son desde una necesidad, para estas personas que en su practica de uso de estos lenguajes y querer combinar y crear algún modelo mucho mejor y que fuera fácil, es como todo desde una idea o un pensamiento pequeño puede llegar a cambiar algo en gran medida.
Some of those users became contributors, adding their expertise to the development of the project
Las iniciativas que se amplían y permiten ver múltiples perspectivas, crecen debido a que el talento se puede esconder en las manos que no tienen la oportunidad.
Like many revolutionary changes in human history, it started with a flash of frustration.
La invención de grandes cosas inició con grandes frustraciones. Por ello, actualmente existe un dilema social y estructural: si la inteligencia artificial resuelve por nosotros, ¿qué pasará con nuestro desarrollo, especialmente en el ámbito cognitivo?
That such a language didn’t exist frustrated Karpinski
Esta frase me recuerda a ese dicho "se el cambio que quieres ver", y es que supongo que así es como se produce el avance, como el ejemplo que vimos en clase con Opera y como su fundador tras ver los cambios que le hicieron con su venta, lo llevaría a la creación de vivaldi. Al final supongo que para cambiar algo, es necesario crear un nuevo modelo que haga obsoleto el modelo existente.
502Lab Sitio para juegos de rol.
Es bastante bueno, diferencial e innovador que se permita crear y dirigir la creación de páginas web de acuerdo a lo que desean y quieren las personas. Mientras que otros servicios se encargan de ser generadores netamente de sitios web empresariales o de market, esta permite dirigir su servicio a otro del mercado, cómo el de los videojuegos
Cuando publicas algo en la web, debería pertenecerte a ti, no a una empresa. Demasiadas compañías han cerrado y perdido todos los datos de sus usuarios.
Si bien esto puede ser un ganchazo comercial muy bueno, es una razón valida para optar por herramientas gratuitas y propias que de verdad se preocupen y sean garantes de la protección de los datos, datos personales y contenidos de las páginas web que creen las personas
Crea sitios web autónomos, agradables y personalizables de manera ágil y resiliente. Brea es un generador y gestor de sitios web enfocado en la personalización interactiva y la autonomía, que permite publicar información integrada desde distintas fuentes, con presentaciones a la medida.
Si bien comparten ciertas características cómo algunos referentes que son lideres en la generación rápida de sitios web cómo GoDaddy o Wix, me llamó la atención que sean laxos en cuanto a funciones, contenidos e infraestructura, mientras que otros sitios que de cara ya son de pago o restringen el uso de cierto tipo de contenido, esta promesa que compite contra estos lideres potencia y libera la capacidad creativa de los usuarios de forma gratuita, propia e intuitiva
Preferimos pocos principios de funcionamiento y componentes que se interconectan formas poderosas y que funcionan en una amplia varidad de máquinas, desde memorias USB, hasta computadoras modestas o servidores potentes
En mi caso personal lo que importa es la versatilidad y la eficiencia que se logra con una base bien diseñada.
Abordamos nuestras propias necesidades, iterando y creando sobre nuestros propios sitios.
Considero que esto es lo que fortalece la pluralidad y expansión del conocimiento en todos sus ámbitos, la iteración. Poder volver atrás cuando algo no está bien o incluso volver a empezar, reconocer la frustración y los nuevos principios como nuevos comienzos.
NOTE DE SYNTHÈSE : Dans la tête d'un colérique
Introduction
Cette note de synthèse explore les facettes de la colère présentées dans les extraits de l'émission "Dans la tête d'un colérique".
Le documentaire examine la nature de cette émotion souvent perçue négativement, sa gestion individuelle et collective, ses manifestations, ses fonctions insoupçonnées, et les conséquences de son refoulement ou de son expression violente.
À travers des témoignages, des analyses de spécialistes et des expériences, l'émission offre un éclairage nuancé sur une émotion complexe et puissante.
Thèmes Principaux
La perception sociale de la colère et son contrôle: La colère est largement considérée comme une émotion négative et "mal vue".
L'éducation et les règles de bienséance nous incitent à la contrôler.
La fonction intrinsèque et l'utilité de la colère: Malgré sa mauvaise réputation, les spécialistes affirment que la colère est nécessaire.
Elle peut nous protéger et, de manière surprenante, augmenter considérablement nos performances physiques et cognitives.
Les manifestations et mécanismes de la colère individuelle:
Le témoignage d'Eduardo illustre comment la colère peut être déclenchée par la peur (face à une agression) ou la frustration (avec ses enfants), entraînant des réactions physiques intenses ("tout ton corps qui change si ce mr bouillir... les yeux qui devient pour les rouges tout ça").
Chez un colérique, la tension monte vite et très haut, rendant difficile la prise en compte d'autres perspectives ("il est plus capable de penser... il n'ya plus que son point de vue qui compte").
La colère dans les relations proches:
Les émotions, y compris la colère, débordent davantage avec ceux qu'on aime.
L'anticipation des réactions de l'autre ("je savais que tu allais faire ça") et le système d'attachement (sécurisé ou insécure) influencent la gestion de la colère dans les relations intimes.
Un système d'attachement insécure peut amplifier les émotions négatives ("ça va alimenter active est encore plus mes émotions de tristesse de colère").
La réaction face à la colère d'autrui:
Être confronté à la colère d'un inconnu provoque souvent la "pétrification" ou la "sidération".
La colère fait peur car elle "menace potentiellement l'intégrité d'autrui", mais aussi "l'intégrité des règles de civilité".
On ne sait jamais quelles sont les "limites" de la personne en colère, d'où la peur et le retrait.
Les conséquences de la colère non maîtrisée et violente:
La colère, surtout lorsqu'elle devient violente, fait souffrir non seulement les proches mais aussi les personnes colériques elles-mêmes.
Dans les cas extrêmes, elle peut empêcher de vivre et mener à des comportements autodestructeurs ou hétéro-agressifs.
Le témoignage de Mischa, une femme violente, met en lumière la honte et le caractère dévastateur de sa colère ("c'est très violent c'est c'est comme un tremblement de terre").
La gestion et la canalisation de la colère:
Refouler la colère est comparé à un "cancer" qui peut créer des "pathologies physiques".
Apprendre à réguler sa colère ne signifie pas l'éradiquer, mais trouver d'autres stratégies pour soulager la tension interne.
L'utilité fonctionnelle de la colère: Communication et positionnement:
La colère est un "outil de communication" dès l'enfance et permet, à l'âge adulte, de "mettre des limites" et de ne pas se faire "bouffer par les autres".
Performance physique: Une expérience a démontré que la colère (induite par un sentiment d'injustice) peut augmenter la force physique ("augmentent leur force physique").
La colère agit comme un "moteur", un "booster" qui "permet d'optimiser les performances" physiques car elle est associée à un niveau d'"activation" et d'"éveil" élevé.
Performance cognitive (inconsciente):
Une autre expérience suggère que l'activation inconsciente du concept de colère (par des images subliminales) peut faciliter les performances cognitives et rendre le cœur plus efficace ("économise son énergie et devient plus efficace").
Ce processus doit être inconscient pour fonctionner.
Performance sociale et politique: La colère peut être utilisée consciemment pour "faire passer un message", comme le fait l'entraîneur Bernard Challandes.
La "colère sociale" est perçue comme un "moteur" essentiel pour "changer les choses" et maintenir l'engagement dans les mouvements collectifs (comme la grève du climat).
Les colères collectives ont historiquement fait peur car elles sont "synonyme d'émeutes" et de "révolution", mobilisant les individus en une force collective qui peut ébranler l'ordre établi.
Le traitement de la colère:
L'approche pour gérer la colère dépend de sa nature.
La psychiatrie peut être pertinente si la difficulté à contrôler la colère est constante, survient dans différents contextes et est associée à des comportements délétères, suggérant un trouble psychiatrique sous-jacent (comme une dépression).
Cependant, pour des difficultés comportementales, des approches se concentrant sur l'apprentissage de la gestion des émotions et le renforcement de l'estime de soi sont également efficaces, notamment pour les femmes violentes qui recherchent souvent de l'aide comportementale plutôt que psychiatrique.
Idées ou Faits Importants et Citations Clés
La colère, une émotion nécessaire:
"pourtant les spécialistes l'affirment nous ne pourrions pas vivre sans colère elle nous protège et vous le verrez dans cette émission elle augmente considérablement nos performances physiques et cognitives".
La montée rapide de la colère chez certains:
"[chez Eduardo] la tension monte très vite un très rapidement mais aussi très haut et qu'à ce moment là sur une émotion qui semble être de la colère il est plus capable de penser".
La colère dans les relations proches:
"les psychologues le disent les émotions déborde davantage avec ceux qu'on aime".
L'influence du système d'attachement:
Un système d'attachement insécure "va très vite interpréter les signaux que me donne l'autre comme il est en train de me laisser tomber... ça va alimenter active est encore plus mes émotions de tristesse de colère ou tout autre émotion négative".
La peur face à la colère d'autrui:
"les émotions de colère elles elles font peur parce que menace potentiellement l'intégrité d'autrui... face à la colère d'autrui surtout des personnes inconnues on est plutôt dans un état de pétrification de sidération".
Les conséquences du refoulement:
"je pense que la colère c'est comme un cancer c'est que si on la garde à l'intérieur qu'on laval caen laval caen laval... réellement je pense que oui ça rend malade sa c'est sûr ça j'en suis sûre et certaine".
La fonction de communication de la colère:
"c'est un outil de communication déjà depuis la petite la prime enfance c'est un outil qui me sera utile aussi plus tard à l'âge adulte pour me positionner dans la vie mettre des limites... Si je me mets jamais en colère je me fais bouffer par les autres".
La colère comme moteur de performance physique:
"la colère c'est une sorte de moteur un booster qui va permettre d'optimiser les performances mais certaines performances performance physique".
La colère et la performance cognitive inconsciente:
"cette activation d'une idée de la colère de penser à la colère peut influencer comment je m'applique pendant une tâche... la colère peut faciliter nos actions". "tout ça doit être inconscient".
La colère collective comme moteur du changement social: "il faut une colère sociale pour changer les choses Sinon c'est quoi le moteur". "les colères collective elles ont toujours fait extrêmement peur parce que ça a été synonyme d' émeutes synonyme de l'annoncé de révolution".
Conclusion
L'émission "Dans la tête d'un colérique" démystifie la colère en la présentant non pas uniquement comme une émotion destructive, mais aussi comme une force intrinsèque et potentiellement utile.
Si sa manifestation violente ou constante peut avoir des conséquences dévastatrices pour l'individu et ses proches, la colère, lorsqu'elle est comprise et gérée de manière appropriée, peut servir d'outil de communication, de motivation et même de catalyseur pour le changement social.
Il est crucial d'apprendre à canaliser cette énergie plutôt que de la refouler ou de la laisser déborder de manière incontrôlée.
a heuristic for personal responsibility
heuristics for personal responsibiity
that's why I resonate with Hermetic principles
Rejet, victimisation par les pairs et émotions négatives : Synthèse des dynamiques d'influence en milieu scolaire
Ce document présente une analyse approfondie des recherches récentes menées par l'Institut universitaire Jeunes en difficulté concernant les liens entre l'isolement social, la victimisation par les pairs et les émotions négatives chez les élèves du primaire.
Les points saillants de cette étude sont les suivants :
• Prévalence élevée : Un nombre significatif de jeunes, particulièrement les filles, éprouvent une détresse émotionnelle quotidienne et un sentiment de non-acceptation dès le début du secondaire, des tendances amorcées au primaire.
• Renversement de la perspective traditionnelle :
Contrairement à l'idée reçue voulant que les problèmes relationnels causent les émotions négatives, les résultats indiquent que les émotions négatives (tristesse, désespoir) précèdent et prédisent souvent la victimisation.
• Boucle de rétroaction pour l'isolement : Il existe une relation bidirectionnelle entre l'isolement et les émotions négatives, créant un cycle d'aggravation mutuelle.
• Stabilité des traits vs États changeants : L'étude distingue les caractéristiques chroniques des élèves des fluctuations momentanées, révélant que si les relations sociales peuvent se réinitialiser partiellement entre deux années scolaires, les émotions négatives ont tendance à persister, voire à s'intensifier lors des transitions.
• Nécessité d'interventions multidimensionnelles : La simple prévention de l'intimidation est jugée insuffisante.
Les interventions doivent impérativement intégrer la promotion du bien-être et la gestion des émotions pour rompre les cycles de victimisation.
--------------------------------------------------------------------------------
Les données statistiques issues d'enquêtes canadiennes et québécoises révèlent une réalité complexe pour les élèves :
| Indicateur | Garçons | Filles | | --- | --- | --- | | Tristesse ou désespoir quotidien (début secondaire) | 19 % | 36 % | | Sentiment de ne pas être accepté tel que l'on est | 36 % | 52 % | | Victimes d'intimidation (12 derniers mois - Québec) | ~11 % | ~11 % |
Note sur la victimisation : Bien que le chiffre de 11 % soit cité, la proportion peut grimper jusqu'à 20 %, voire 40 % pour des événements isolés, soulignant la difficulté de cerner précisément ce phénomène.
--------------------------------------------------------------------------------
L'étude s'articule autour de trois réalités distinctes mais interconnectées :
• Émotions négatives : Comprennent la tristesse, le sentiment de désespoir et les idées négatives.
Elles sont considérées comme des précurseurs de la dépression, bien qu'elles ne correspondent pas nécessairement à un diagnostic clinique à ce stade (primaire).
• Isolement des pairs : Fait d'avoir peu d'interactions sociales, que ce soit par choix ou par rejet subi. Le rejet est la forme d'isolement non volontaire la plus fréquente.
• Victimisation : Actes d'agressivité intentionnels et répétitifs caractérisés par un déséquilibre des forces (physiques ou de réputation).
Elle peut être directe (frapper, insulter) ou indirecte (nuire à la réputation, propager des rumeurs).
--------------------------------------------------------------------------------
Trois modèles alternatifs tentent d'expliquer l'interaction entre ces variables :
1. Modèle des risques interpersonnels : Les expériences difficiles avec les pairs agissent comme des stresseurs qui s'accumulent et génèrent des émotions négatives.
C'est le modèle le plus testé et documenté à ce jour.
2. Modèle axé sur les symptômes : Les émotions négatives (ou l'affectivité négative) entraînent un retrait social ou une vulnérabilité qui fait de l'élève une cible privilégiée pour la victimisation.
3. Modèle transactionnel : Suppose une influence réciproque et un renforcement mutuel entre les émotions et les expériences sociales.
--------------------------------------------------------------------------------
L'étude a suivi 992 élèves de la 3e à la 6e année du primaire (Québec) sur deux années scolaires, avec quatre points de mesure.
L'originalité de l'approche réside dans l'utilisation de modèles statistiques ("modèles à décalage croisé avec intercept aléatoire") permettant de distinguer :
• Le Trait (stable/chronique) : La tendance d'un élève à être d'une certaine façon sur le long terme.
• L'État (changeant) : Les fluctuations d'un élève autour de sa propre tendance stable à un moment précis.
--------------------------------------------------------------------------------
De manière chronique, les trois dimensions sont liées : un élève ayant une tendance stable à l'isolement aura également une tendance stable à la victimisation et aux émotions négatives.
Ces réalités co-occurrent sans ordre temporel défini.
L'analyse des fluctuations d'un moment à l'autre révèle des mécanismes distincts :
• Émotions négatives et Isolement : Suivent un modèle transactionnel.
Un niveau élevé d'émotions négatives en début d'année prédit un isolement accru en fin d'année, et inversement. C'est une boucle d'accentuation.
• Émotions négatives et Victimisation : Suivent un modèle axé sur les symptômes.
Les émotions négatives en début d'année prédisent une victimisation accrue plus tard, mais la victimisation ne semble pas augmenter les émotions négatives de manière immédiate.
Ce lien est direct et ne passe pas par l'intermédiaire de l'isolement.
• Stabilité temporelle :
◦ La victimisation et l'isolement sont plus stables au sein d'une même année qu'entre deux années.
Le changement de classe ou d'enseignant atténue l'effet de réputation. ◦
Les émotions négatives sont plus stables entre les années scolaires, suggérant une anticipation anxieuse de la rentrée ou une persistance des traits internes malgré les changements d'environnement.
Constat important : Ces mécanismes sont identiques pour les garçons et les filles, ainsi que pour les élèves plus jeunes ou plus vieux au sein du primaire.
--------------------------------------------------------------------------------
Les résultats de cette étude québécoise, bien que novateurs, ne font pas encore consensus au niveau international, d'autres études montrant parfois des résultats inverses ou sexués.
Une réplication du modèle est prévue en Belgique (Flandre) pour valider ces observations.
L'étude remet en question les stratégies d'intervention uniquement centrées sur le comportement social :
• Insuffisance de la lutte contre l'intimidation seule : Retirer un élève d'une situation de victimisation ne garantit pas la disparition de ses émotions négatives.
• Approche multifactorielle : Il est impératif d'agir simultanément sur l'environnement social et sur le bien-être psychologique interne.
• Priorité à la promotion du bien-être : La prévention de la dépression et la gestion des émotions négatives dès le primaire sont des leviers essentiels pour réduire, par ricochet, les risques de victimisation et d'isolement.
"Les efforts de prévenir la victimisation sont essentiels, mais nos résultats suggèrent qu'ils ne sont potentiellement pas suffisants parce qu'il y a une dynamique plus large."
Briefing : L’autorégulation chez les enfants victimes d’agression sexuelle
Ce document synthétise les résultats de recherches doctorales portant sur l’autorégulation des enfants ayant survécu à une agression sexuelle (AS).
L’autorégulation, définie comme la capacité à moduler ses réponses cognitives et émotionnelles pour générer des comportements adaptatifs, est un processus clé souvent altéré par le trauma.
Les conclusions principales soulignent que si l’agression sexuelle est globalement associée à des difficultés de fonctionnement exécutif (inhibition et flexibilité cognitive), l'impact n'est pas uniforme.
La recherche identifie quatre profils distincts d'autorégulation chez les victimes : disrégulé, inhibé, flexible et régulation identifiée par les parents.
L'étude démontre également que des facteurs tels que le sexe de l'enfant, l'historique de maltraitance multiple et l'environnement socio-économique (défavorisation du quartier) influencent de manière significative les capacités d'autorégulation.
Les implications cliniques suggèrent d'abandonner les approches universelles au profit d'interventions différenciées et d'évaluations multi-méthodes (tâches cognitives et questionnaires) impliquant plusieurs répondants (parents et enseignants).
--------------------------------------------------------------------------------
L'agression sexuelle est une problématique de santé publique mondiale touchant environ une fille sur cinq et un garçon sur dix avant l'âge de 18 ans.
Elle entraîne des conséquences psychologiques variées, notamment des problèmes de comportement intériorisés (dépression, retrait) et extériorisés (agression, opposition).
Le concept d'autorégulation repose sur deux composantes interdépendantes :
• La régulation émotionnelle : Stratégies et compétences modulant l'expression et l'expérience des émotions.
• Les fonctions exécutives : Processus mentaux orientés vers un but, incluant :
◦ L'inhibition : Capacité à freiner une réponse automatique face à un stimulus (ex: répondre "nuit" quand on montre un soleil). ◦ La flexibilité cognitive : Capacité à s'adapter au changement de règles dans l'environnement.
L'exposition précoce à un stress intense (maltraitance, pauvreté) provoque une dysrégulation des hormones de stress, entraînant des atteintes structurelles et fonctionnelles au cerveau, ce qui fragilise les capacités d'autorégulation.
--------------------------------------------------------------------------------
Les recherches présentées indiquent que l'agression sexuelle est un prédicteur significatif de difficultés exécutives, même après avoir contrôlé d'autres facteurs comme le TDAH ou la défavorisation sociale.
• Flexibilité cognitive : L'agression sexuelle est directement associée à une moins bonne performance dans les tâches mesurant cette capacité.
• Inhibition : Les enfants victimes montrent une performance significativement inférieure aux enfants non victimes.
L'étude révèle des différences marquées selon le sexe de l'enfant :
• Garçons : Les enseignants rapportent beaucoup plus de difficultés de fonctionnement exécutif chez les garçons victimes que chez les non-victimes. Ils affichent également des performances plus faibles aux tâches d'inhibition.
• Filles : Il y a peu de différence significative entre les filles victimes et non victimes sur le plan de l'évaluation des fonctions exécutives par les enseignants ou dans les tâches d'inhibition.
--------------------------------------------------------------------------------
L'analyse a permis de dégager quatre profils types chez les enfants victimes d'agression sexuelle (échantillon de 225 enfants) :
| Profil | Proportion | Caractéristiques principales | Problèmes de comportement associés | | --- | --- | --- | --- | | Disrégulé | 39 % | Faible performance cognitive, forte labilité émotionnelle, difficultés rapportées par les parents. | Problèmes intériorisés et extériorisés élevés (comorbidité). | | Inhibé | 19 % | Excellente performance aux tâches d'inhibition, mais faibles compétences émotionnelles perçues par les parents. | Niveaux les plus élevés de problèmes intériorisés. | | Flexible | ~28 % | Autorégulation supérieure à la moyenne, profil concordant (maison/école), résilience. | Faible symptomatologie. | | Régulation (Parents) | 14 % | Performance cognitive faible, mais parents rapportant de très bonnes capacités (profil discordant). | Symptômes visibles par les enseignants mais sous-estimés par les parents. |
• Le profil "Inhibé" : Ces enfants semblent utiliser une sur-régulation cognitive pour contrôler leurs impulsions, mais au prix d'une grande détresse interne.
Chez les filles, ce profil est un facteur de risque pour les problèmes intériorisés, tandis que chez les garçons, il semble agir comme un facteur de protection apparent contre les problèmes extériorisés.
• Le profil "Discordant" : Souvent associé à des agressions sexuelles intrafamiliales (80-90 % des cas dans ce groupe). Les parents peuvent surévaluer les compétences de l'enfant par désir de normalité ou sous l'effet d'un cadre familial trop rigide.
--------------------------------------------------------------------------------
L'autorégulation ne dépend pas uniquement de l'acte traumatique, mais d'un écosystème de facteurs :
• Historique de maltraitance : Les profils "disrégulé" et "inhibé" sont corrélés à une exposition à un plus grand nombre de formes de maltraitance.
• Défavorisation du quartier : Les enfants vivant dans des quartiers favorisés présentent une meilleure autorégulation. Cela s'expliquerait par l'accès aux ressources (bibliothèques, musées, espaces verts) et une moindre exposition à la violence communautaire.
• Éducation parentale : Un niveau d'études plus élevé chez les parents favorise le développement des compétences langagières, lesquelles soutiennent directement l'autorégulation de l'enfant.
--------------------------------------------------------------------------------
Il est impératif de multiplier les sources d'information :
1. Multi-modalité : Combiner les questionnaires (perceptions) et les tâches cognitives (mesures objectives), car les résultats sont souvent divergents.
2. Multi-répondants : Inclure systématiquement le point de vue des enseignants pour identifier les difficultés qui pourraient être masquées dans le cadre familial.
L'intervention ne doit pas être identique pour tous les profils :
• Pour les enfants disregulés : Approche standard axée sur le renforcement des fonctions exécutives et de la régulation émotionnelle.
• Pour les enfants inhibés : Éviter de renforcer l'inhibition (potentiellement néfaste). Prioriser la reconnaissance, la compréhension et l'expression des émotions, ainsi que la flexibilité cognitive.
• Pour les enfants "flexibles" : L'intervention sur l'autorégulation peut être inutile. Se concentrer sur le soutien psychosocial et la prévention de la revictimisation.
• Pour le profil discordant : Évaluer la flexibilité des parents et utiliser des sources d'évaluation externes pour pallier la sous-estimation parentale des difficultés.
• Pour l'inhibition : Jeux de type "1, 2, 3 Soleil", coloriage attentionnel (arrêter au signal), ou jeux de rôle où l'enfant doit attendre son tour face à une frustration.
• Pour la flexibilité : Jeux avec changement de règles fréquent (ex: varier qui gagne à "Roche-Papier-Ciseau"), résolution de problèmes avec des solutions multiples ou inversions de rôles.
• Implication des parents : Travailler sur l'autorégulation propre des parents et favoriser un attachement sécurisant, facteur de protection majeur pour l'enfant.
--------------------------------------------------------------------------------
La recherche souligne la complexité des trajectoires de développement après une agression sexuelle.
Le constat majeur est que le trauma n'entraîne pas systématiquement une dysrégulation.
Près de 42 % des enfants présentent des profils adaptés.
L'enjeu clinique réside dans l'identification des profils "surrégulés" ou "discordants", qui peuvent passer inaperçus tout en présentant des risques élevés de pathologie à long terme.
Author response:
The following is the authors’ response to the original reviews.
Public Reviews:
Reviewer #1 (Public review):
Summary:
In this study, Lamberti et al. investigate how translation initiation and elongation are coordinated at the single-mRNA level in mammalian cells. The authors aim to uncover whether and how cells dynamically adjust initiation rates in response to elongation dynamics, with the overarching goal of understanding how translational homeostasis is maintained. To this end, the study combines single-molecule live-cell imaging using the SunTag system with a kinetic modeling framework grounded in the Totally Asymmetric Simple Exclusion Process (TASEP). By applying this approach to custom reporter constructs with different coding sequences, and under perturbations of the initiation/elongation factor eIF5A, the authors infer initiation and elongation rates from individual mRNAs and examine how these rates covary.
The central finding is that initiation and elongation rates are strongly correlated across a range of coding sequences, resulting in consistently low ribosome density ({less than or equal to}12% of the coding sequence occupied). This coupling is preserved under partial pharmacological inhibition of eIF5A, which slows elongation but is matched by a proportional decrease in initiation, thereby maintaining ribosome density. However, a complete genetic knockout of eIF5A disrupts this coordination, leading to reduced ribosome density, potentially due to changes in ribosome stalling resolution or degradation.
Strengths:
A key strength of this work is its methodological innovation. The authors develop and validate a TASEP-based Hidden Markov Model (HMM) to infer translation kinetics at single-mRNA resolution. This approach provides a substantial advance over previous population-level or averaged models and enables dynamic reconstruction of ribosome behavior from experimental traces. The model is carefully benchmarked against simulated data and appropriately applied. The experimental design is also strong. The authors construct matched SunTag reporters differing only in codon composition in a defined region of the coding sequence, allowing them to isolate the effects of elongation-related features while controlling for other regulatory elements. The use of both pharmacological and genetic perturbations of eIF5A adds robustness and depth to the biological conclusions. The results are compelling: across all constructs and conditions, ribosome density remains low, and initiation and elongation appear tightly coordinated, suggesting an intrinsic feedback mechanism in translational regulation. These findings challenge the classical view of translation initiation as the sole rate-limiting step and provide new insights into how cells may dynamically maintain translation efficiency and avoid ribosome collisions.
We thank the reviewer for their constructive assessment of our work, and for recognizing the methodological innovation and experimental rigor of our study.
Weaknesses:
A limitation of the study is its reliance on exogenous reporter mRNAs in HeLa cells, which may not fully capture the complexity of endogenous translation regulation. While the authors acknowledge this, it remains unclear how generalizable the observed coupling is to native mRNAs or in different cellular contexts.
We agree that the use of exogenous reporters is a limitation inherent to the SunTag system, for which there is currently no simple alternative for single-mRNA translation imaging. However, we believe our findings are likely generalizable for several reasons.
As discussed in our introduction and discussion, there is growing mechanistic evidence in the literature for coupling between elongation (ribosome collisions) and initiation via pathways such as the GIGYF2-4EHP axis (Amaya et al. 2018, Hickey et al. 2020, Juszkiewicz et al. 2020), which might operate on both exogenous and endogenous mRNAs.
As already acknowledged in our limitations section, our exogenous reporters may not fully recapitulate certain aspects of endogenous translation (e.g., ER-coupled collagen processing), yet the observed initiation-elongation coupling was robust across all tested constructs and conditions.
We have now expanded the Discussion (L393-395) to cite complementary evidence from Dufourt et al. (2021), who used a CRISPR-based approach in Drosophila embryos to measure translation of endogenous genes. We also added a reference to Choi et al. 2025, who uses a ER-specific SunTag reporter to visualize translation at the ER (L395-397).
Additionally, the model assumes homogeneous elongation rates and does not explicitly account for ribosome pausing or collisions, which could affect inference accuracy, particularly in constructs designed to induce stalling. While the model is validated under low-density assumptions, more work may be needed to understand how deviations from these assumptions affect parameter estimates in real data.
We agree with the reviewer that the assumption of homogeneous elongation rates is a simplification, and that our work represents a first step towards rigorous single-trace analysis of translation dynamics. We have explicitly tested the robustness of our model to violations of the low-density assumption through simulations (Figure 2 - figure supplement 2). These show that while parameter inference remains accurate at low ribosome densities, accuracy slightly deteriorates at higher densities, as expected. In fact, our experimental data do provide evidence for heterogeneous elongation: the waiting times between termination events deviate significantly from an exponential distribution (Figure 3 - figure supplement 2C), indicating the presence of ribosome stalling and/or bursting, consistent with the reviewer's concern. We acknowledge in the Limitations section (L402-406) that extending the model to explicitly capture transcript-dependent elongation rates and ribosome interactions remains challenging. The TASEP is difficult to solve analytically under these conditions, but we note that simulation-based inference approaches, such as particle filters to replace HMMs, could provide a path forward for future work to capture this complexity at the single-trace level.
Furthermore, although the study observes translation "bursting" behavior, this is not explicitly modeled. Given the growing recognition of translational bursting as a regulatory feature, incorporating or quantifying this behavior more rigorously could strengthen the work's impact.
While we do not explicitly model the bursting dynamics in the HMM framework, we have quantified bursting behavior directly from the data. Specifically, we measure the duration of translated (ON) and untranslated (OFF) periods across all reporters and conditions (Figure 1G for control conditions and Figure 4G-H for perturbed conditions), finding that active translation typically lasts 10-15 minutes interspersed with shorter silent periods of 5-10 minutes. This empirical characterization demonstrates that bursting is a consistent feature of translation across our experimental conditions. The average duration of silent periods is similar to what was inferred by Livingston et al. 2023 for a similar SunTag reporter; while the average duration of active periods is substantially shorter (~15 min instead of ~40 min), which is consistent with the shorter trace duration in our system compared to theirs (~15 min compared to ~80 min, on average). Incorporating an explicit two-state or multi-state bursting model into the TASEP-HMM framework would indeed be computationally intensive and represents an important direction for future work, as it would enable inference of switching rates alongside initiation and elongation parameters. We have added this point to the Discussion (L415-417).
Assessment of Goals and Conclusions:
The authors successfully achieve their stated aims: they quantify translation initiation and elongation at the single-mRNA level and show that these processes are dynamically coupled to maintain low ribosome density. The modeling framework is well suited to this task, and the conclusions are supported by multiple lines of evidence, including inferred kinetic parameters, independent ribosome counts, and consistent behavior under perturbation.
Impact and Utility:
This work makes a significant conceptual and technical contribution to the field of translation biology. The modeling framework developed here opens the door to more detailed and quantitative studies of ribosome dynamics on single mRNAs and could be adapted to other imaging systems or perturbations. The discovery of initiation-elongation coupling as a general feature of translation in mammalian cells will likely influence how researchers think about translational regulation under homeostatic and stress conditions.
The data, models, and tools developed in this study will be of broad utility to the community, particularly for researchers studying translation dynamics, ribosome behavior, or the effects of codon usage and mRNA structure on protein synthesis.
Context and Interpretation:
This study contributes to a growing body of evidence that translation is not merely controlled at initiation but involves feedback between elongation and initiation. It supports the emerging view that ribosome collisions, stalling, and quality control pathways play active roles in regulating initiation rates in cis. The findings are consistent with recent studies in yeast and metazoans showing translation initiation repression following stalling events. However, the mechanistic details of this feedback remain incompletely understood and merit further investigation, particularly in physiological or stress contexts.
In summary, this is a thoughtfully executed and timely study that provides valuable insights into the dynamic regulation of translation and introduces a modeling framework with broad applicability. It will be of interest to a wide audience in molecular biology, systems biology, and quantitative imaging.
We appreciate the reviewer's thorough and positive assessment of our work, and that they recognize both the technical innovation of our modeling framework and its potential broad utility to the translation biology community. We agree that further mechanistic investigation of initiation-elongation feedback under various physiological contexts represents an important direction for future research.
Reviewer #2 (Public review):
Summary:
This manuscript uses single-molecule run-off experiments and TASEP/HMM models to estimate biophysical parameters, i.e., ribosomal initiation and elongation rates. Combining inferred initiation and elongation rates, the authors quantify ribosomal density. TASEP modeling was used to simulate the mechanistic dynamics of ribosomal translation, and the HMM is used to link ribosomal dynamics to microscope intensity measurements. The authors' main conclusions and findings are:
(1) Ribosomal elongation rates and initiation rates are strongly coordinated.
(2) Elongation rates were estimated between 1-4.5 aa/sec. Initiation rates were estimated between 0.5-2.5 events/min. These values agree with previously reported values.
(3) Ribosomal density was determined below 12% for all constructs and conditions.
(4) eIF5A-perturbations (KO and GC7 inhibition) resulted in non-significant changes in translational bursting and ribosome density.
(5) eIF5A perturbations resulted in increases in elongation and decreases in initiation rates.
Strengths:
This manuscript presents an interesting scientific hypothesis to study ribosome initiation and elongation concurrently. This topic is highly relevant for the field. The manuscript presents a novel quantitative methodology to estimate ribosomal initiation rates from Harringtonine run-off assays. This is relevant because run-off assays have been used to estimate, exclusively, elongation rates.
We thank the reviewer for their careful evaluation of our work and for recognizing the novelty of our quantitative methodology to extract both initiation and elongation rates from harringtonine run-off assays, extending beyond the traditional use of these experiments.
Weaknesses:
The conclusion of the strong coordination between initiation and elongation rates is interesting, but some results are unexpected, and further experimental validation is needed to ensure this coordination is valid.
We agree that some of our findings need further experimental investigation in future studies. However, we believe that the coordination between initiation and elongation is supported by multiple results in our current work: (1) the strong correlation observed across all reporters and conditions (Figure 3E), and (2) the consistent maintenance of low ribosome density despite varying elongation rates. While additional experimental validation would be valuable, we note that directly manipulating initiation or elongation independently in mammalian cells remains technically challenging. Nevertheless, our findings are consistent with emerging mechanistic understanding of collision-sensing pathways (GIGYF2-4EHP) that could mediate such coupling, as discussed in our manuscript.
(1) eIF5a perturbations resulted in a non-significant effect on the fraction of translating mRNA, translation duration, and bursting periods. Given the central role of eIF5a, I would have expected a different outcome. I would recommend that the authors expand the discussion and review more literature to justify these findings.
We appreciate this comment. This finding is indeed discussed in detail in our manuscript (Discussion, paragraphs 6-7). As we note there, while eIF5A plays a critical role in elongation, the maintenance of bursting dynamics and ribosome density upon perturbation can be explained by compensatory feedback mechanisms. Specifically, the coordinated decrease in initiation rates that counterbalances slower elongation to maintain homeostatic ribosome density. We also discuss several factors that complicate interpretation: (1) potential RQC-mediated degradation masking stronger effects in proline-rich constructs, (2) differences between GC7 treatment and genetic knockout suggesting altered stalling resolution kinetics, and (3) the limitations of using exogenous reporters that lack ER-coupled processing, which may be critical for eIF5A function in endogenous collagen translation (as suggested by Rossi et al., 2014; Mandal et al., 2016; Barba-Aliaga et al., 2021). The mechanistic complexity and tissue-specific nature of eIF5A function in mammals, which differs substantially from the better-characterized yeast system, likely contributes to the nuanced phenotype we observe. We believe our Discussion adequately addresses these points.
(2) The AAG construct leading to slow elongation is very surprising. It is the opposite of the field consensus, where codon-optimized gene sequences are expected to elongate faster. More information about each construct should be provided. I would recommend more bioinformatic analysis on this, for example, calculating CAI for all constructs, or predicting the structures of the proteins.
We agree that the slow elongation of the AAG construct is counterintuitive and indeed surprising. Following the reviewer's suggestion, we have now calculated the Codon Adaptation Index (CAI) for all constructs (Renilla 0.89, Col1a1 0.78, Col1a1 mutated 0.74). It is therefore unlikely that codon bias explains the slow translation, particularly since we designed the mutated Col1a1 construct with alanine codons selected to respect human codon usage bias, thereby minimizing changes in codon optimality. As we discuss in the manuscript, we hypothesize that the proline-to-alanine substitutions disrupted co-translational folding of the collagen-derived sequence. Prolines are critical for collagen triple-helix formation (Shoulders and Raines, 2009), and their replacement with alanines likely generates misfolded intermediates that cause ribosome stalling (Barba-Aliaga et al., 2021; Komar et al., 2024). This interpretation is supported by the high frequency (>30%) of incomplete run-off traces for AAG, suggesting persistent stalling events. Our findings thus illustrate an important potential caveat: "optimizing" a sequence based solely on codon usage can be detrimental when it disrupts functionally important structural features or co-translational folding pathways.
This highlights that elongation rates depend not only on codon optimality but also on the interplay between nascent chain properties and ribosome progression.
(3) The authors should consider using their methodology to study the effects of modifying the 5'UTR, resulting in changes in initiation rate and bursting, such as previously shown in reference Livingston et al., 2023. This may be outside of the scope of this project, but the authors could add this as a future direction and discuss if this may corroborate their conclusions.
We thank the reviewer for this excellent suggestion. We agree that applying our methodology to 5'-UTR variants would provide a complementary test of initiation-elongation coupling, and we have now added this as a future direction in the Discussion (L417-420).
(4) The mathematical model and parameter inference routines are central to the conclusions of this manuscript. In order to support reproducibility, the computational code should be made available and well-documented, with a requirements file indicating the dependencies and their versions.
We have added the Github link in the manuscript (https://github.com/naef-lab/suntag-analysis) and have also deposited the data (.ome.tif) on Zenodo (https://zenodo.org/records/17669332).
Reviewer #3 (Public review):
Disclaimer:
My expertise is in live single-molecule imaging of RNA and transcription, as well as associated data analysis and modeling. While this aligns well with the technical aspects of the manuscript, my background in translation is more limited, and I am not best positioned to assess the novelty of the biological conclusions.
Summary:
This study combines live-cell imaging of nascent proteins on single mRNAs with time-series analysis to investigate the kinetics of mRNA translation.
The authors (i) used a calibration method for estimating absolute ribosome counts, and (ii) developed a new Bayesian approach to infer ribosome counts over time from run-off experiments, enabling estimation of elongation rates and ribosome density across conditions.
They report (i) translational bursting at the single-mRNA level, (ii) low ribosome density (~10% occupancy
{plus minus} a few percents), (iii) that ribosome density is minimally affected by perturbations of elongation (using a drug and/or different coding sequences in the reporter), suggesting a homeostatic mechanism potentially involving a feedback of elongation onto initiation, although (iv) this coupling breaks down upon knockout of elongation factor eIF5A.
Strengths:
(1) The manuscript is well written, and the conclusions are, in general, appropriately cautious (besides the few improvements I suggest below).
(2) The time-series inference method is interesting and promising for broader applications.
(3) Simulations provide convincing support for the modeling (though some improvements are possible).
(4) The reported homeostatic effect on ribosome density is surprising and carefully validated with multiple perturbations.
(5) Imaging quality and corrections (e.g., flat-fielding, laser power measurements) are robust.
(6) Mathematical modeling is clearly described and precise; a few clarifications could improve it further.
We thank the reviewer for recognizing the novelty of the approach and its rigour, and for providing suggestions to improve it further.
Weaknesses:
(1) The absolute quantification of ribosome numbers (via the measurement of $i_{MP}$ ) should be improved.This only affects the finding that ribosome density is low, not that it appears to be under homeostatic control. However, if $i_{MP}$ turns out to be substantially overestimated (hence ribosome density underestimated), then "ribosomes queuing up to the initiation site and physically blocking initiation" could become a relevant hypothesis. In my detailed recommendations to the authors, I list points that need clarification in their quantifications and suggest an independent validation experiment (measuring the intensity of an object with a known number of GFP molecules, e.g., MS2-GFP MS2-GFP-labeled RNAs, or individual GEMs).
We agree with the reviewer that the estimation of the number of ribosomes is central to our finding that translation happens at low density on our reporters. This result derives from our measurement of the intensity of one mature protein (i<sub>MP</sub>), that we have achieved by using a SunTag reporter with a RH1 domain in the C terminus of the mature protein, allowing us to stabilise mature proteins via actin-tethering. In addition, as suggested by the reviewer, we already validated this result with an independent estimate of the mature protein intensity (Figure 5 - figure supplement 2B), which was obtained by adding the mature protein intensity directly as a free parameter of the HMM. The inferred value of mature protein intensity for each construct (10-15 a.u) was remarkably close to the experimental calibration result (14 ± 2 a.u.). Therefore, we have confidence that our absolute quantification of ribosome numbers is accurate.
(2) The proposed initiation-elongation coupling is plausible, but alternative explanations, such as changes in abortive elongation frequency, should be considered more carefully. The authors mention this possibility, but should test or rule it out quantitatively.
We thank the reviewer for the comment, but we consider that ruling out alternative explanations through new perturbation experiments is beyond the scope of the present work.
(3) The observation of translational bursting is presented as novel, but similar findings were reported by Livingston et al. (2023) using a similar SunTag-MS2 system. This prior work should be acknowledged, and the added value of the current approach clarified.
We did cite Livingston et al. (2023) in several places, but we recognized that we could add a few citations in key places, to make clear that the observation of bursting is not novel but is in agreement with previous results. We now did so in the Results and Discussion sections.
(4) It is unclear what the single-mRNA nature of the inference method is bringing since it is only used here to report _average_ ribosome elongation rate and density (averaged across mRNAs and across time during the run-off experiments - although the method, in principle, has the power to resolve these two aspects).
While decoding individual traces, our model infers shared (population-level) rates. Inferring transcript-specific parameters would be more informative, but it is highly challenging due to the uncertainty on the initial ribosome distribution on single transcripts. Pooling multiple transcripts together allows us to use some assumptions on the initial distribution and infer average elongation and initiation-rate parameters, while revealing substantial mRNA-to-mRNA variability in the posterior decoding (e.g. Figure 3 - figure Supplement 2C). Indeed, the inference still informs on the single-trace run-off time distribution (Figure 3 A) and the waiting time between termination events (Figure 3 - figure supplement 2C), suggesting the presence of stalling and bursting. In addition, the transcript-to-transcript heterogeneity is likely accounted for by our model better than previous methods (linear fit of the average run-off intensity), as suggested by their comparison (Figure 3 - figure supplement 2 A). In the future the model could be refined by introducing transcript-specific parameters, possibly in a hierarchical way, alongside shared parameters.
(5) I did not find any statement about data availability. The data should be made available. Their absence limits the ability to fully assess and reproduce the findings.
We have added the Github link in the manuscript (https://github.com/naef-lab/suntag-analysis) and have also deposited the data (.ome.tif) on Zenodo (https://zenodo.org/records/17669332).
Recommendations for the authors:
Reviewer #1 (Recommendations for the authors):
Major Comments:
(1) Lack of Explicit Bursting Model
Although translation "bursts" are observed, the current framework does not explicitly model initiation as a stochastic ON/OFF process. This limits insight into regulatory mechanisms controlling burst frequency or duration. The authors should either incorporate a two-state/more-state (bursting) model of initiation or perform statistical analysis (e.g., dwell-time distributions) to quantify bursting dynamics. They should clarify how bursting influences the interpretation of initiation rate estimates.
We agree with the reviewer that an explicit bursting model (e.g., a two-state telegraph model) would be the ideal theoretical framework. However, integrating such a model into the TASEP-HMM inference framework is computationally intensive and complex. As a robust first step, we have opted to quantify bursting empirically based on the decoded single-mRNA traces. As shown in Figure 1G (control) and Figure 4G (perturbed conditions), we explicitly measured the duration of "ON" (translated) and "OFF" (untranslated) periods. This statistical analysis provides a quantitative description of the bursting dynamics without relying on the specific assumptions of a telegraph model. We have clarified this in the text (L123-125) and, as suggested, added a discussion (L415-417) on the potential extensions of the model to include explicit switching kinetics in the Outlook section.
(2) Assumption of Uniform Elongation Rates
The model assumes homogeneous elongation across coding sequences, which may not hold for stalling-prone inserts (e.g., PPG). This simplification could bias inference, particularly in cases of sequence-specific pausing. Adding simulations or sensitivity analysis to assess how non-uniform elongation affects the accuracy of inferred parameters. The authors should explicitly discuss how ribosome stalling, collisions, or heterogeneity might skew model outputs (see point 4).
A strong stalling sequence that affects all ribosomes equally should not deteriorate the inference of the initiation rate, provided that the low-density assumption holds. The scenario where stalling events lead to higher density, and thus increased ribosome-ribosome interactions, is comparable to the conditions explored in Figure 2E. In those simulations, we tested the inference on data generated with varying initiation and elongation rates, resulting in ribosome densities ranging from low to high. We demonstrated that the inference remains robust at low ribosome densities (<10%). At higher densities, the accuracy of the initiation rate estimate decreases, whereas the elongation rate estimate remains comparatively robust. Additionally, the model tends to overestimate ribosome density under high-density conditions, likely because it neglects ribosome interference at the initiation site (Figure 2 figure supplement 2C). We agree that a deeper investigation into the consequences of stochastic stalling and bursting would be beneficial, and we have explicitly acknowledged this in the Limitations section.
(3) Interpretation of eIF5A Knockout Phenotype
The observation that eIF5A KO reduces initiation more than elongation, leading to decreased ribosome density, is biologically intriguing. However, the explanation invoking altered RQC kinetics is speculative and not directly tested. The authors should consider validating the RQC hypothesis by monitoring reporter mRNA stability, ribosome collision markers, or translation termination intermediates.
We thank the reviewer for the comment, but we consider that ruling out alternative explanations through new experiments is beyond the scope of the present work.
(4) To strengthen the manuscript, the authors should incorporate insights from three studies.
- Livingston et al. (PMC10330622) found that translation occurs in bursts, influenced by mRNA features and initiation factors, supporting the coupling of initiation and elongation.
- Madern et al. (PMID: 39892379) demonstrated that ribosome cooperativity enhances translational efficiency, highlighting coordinated ribosome behavior.
- Dufourt et al. (PMID: 33927056) observed that high initiation rates correlate with high elongation rates, suggesting a conserved mechanism across cell cultures and organisms.
Integrating these studies could enrich the manuscript's interpretation and stimulate new avenues of thought.
We thank the reviewer for the valuable comment. We added citations of Livingston et al. in the context of translational bursting. We already cited Madern et al. in multiple places and, although its observations of ribosome cooperativity are very compelling, they cannot be linked with our observations of a feedback between initiation and elongation, and it would be very challenging to see a similar effect on our reporters. This is why we did not expressly discuss cooperativity. We also integrated Dufourt et al. in the Discussion about the possibility of designing genetically-encoded reporter. We also added a sentence about the possibility of using an ER-specific SunTag reporter, as done recently in Choi et al., Nature (2025) (https://doi.org/10.1038/s41586-025-09718-0).
Minor Comments:
(1) Use consistent naming for SunTag reporters (e.g., "PPG" vs "proline-rich") throughout.
Thank you for the comment. However, the term proline-rich always appears together with PPG, so we believe that the naming is clear and consistent.
(2) Consider a schematic overview of the experimental design and modeling pipeline for accessibility.
Thank you for the suggestion. We consider that experimental design and modeling is now sufficiently clearly described and does not justify an additional scheme.
(3) Clarify how incomplete run-off traces are handled in the HMM inference.
Incomplete run-off traces are treated identically to complete traces in our HMM inference. This is possible because our model relies on the probability of transitions occurring per time step to infer rates. It does not require observing the final "empty" state to estimate the kinetic parameters ɑ and λ. The loss of signal (e.g., mRNA moving out of the focal volume or photobleaching) does not invalidate the kinetic information contained in the portion of the trace that was observed. We have clarified this in the Methods section.
Reviewer #2 (Recommendations for the authors):
(1) Reproducibility:
(1.1) The authors should use a GitHub repository with a timestamp for the release version.
The code is available on GitHub (https://github.com/naef-lab/suntag-analysis).
(1.2) Make raw images and data available in a figure repository like Figshare.
The raw images (.ome.tif) are now available on Zenodo (https://zenodo.org/records/17669332).
(2) Paper reorganization and expansion of the intensity and ribosome quantification:
(2.1) Given the relevance of the initiation and elongation rates for the conclusions of this study, and the fact that the authors inferred these rates from the spot intensities. I recommend that the authors move Figure 1 Supplement 2 to the main text and expand the description of the process to relate spot intensity and number of ribosomes. Please also expand the figure caption for this image.
We agree with the importance of this validation. We have expanded the description of the calibration experiment in the main text and in the figure caption.
(2.2) I suggest the authors explicitly mention the use of HMM in the abstract.
We have now explicitly mentioned the TASEP-based HMM in the abstract.
(2.3) In line 492, please add the frame rate used to acquire the images for the run-off assays.
We have added the specific frame rate (one frame every 20 seconds) to the relevant section.
(3) Figures and captions:
(3.1) Figure 1, Supplement 2. Please add a description of the colors used in plots B, C.
We have expanded the caption and added the color description.
(3.2) In the Figure 2 caption. It is not clear what the authors mean by "traceseLife". Please ensure it is not a typo.
Thank you for spotting this. We have corrected the typo.
(3.3) Figure 1 A, in the cartoon N(alpha)->N-1, shouldn't the transition also depend on lambda?
The transition probability was explicitly derived in the “Bayesian modeling of run-off traces” section (Eqs. 17-18), and does not depend on λ, but only on the initiation rate under the low-density assumption.
(3.4) Figure 3, Supplement 2. "presence of bursting and stalling.." has a typo.
Corrected.
(3.5) Figure 5, panel C, the y-axis label should be "run-off time (min)."
Corrected.
(3.6) For most figures, add significance bars.
(3.7) In the figure captions, please add the total number of cells used for each condition.
We have systematically indicated the number of traces (n<sub>t</sub>) and the number of independent experiments (n<sub>e</sub>) in the captions in this format (n<sub>t</sub>, n<sub>e</sub>).
(4) Mathematical Methods:
We greatly thank the reviewer for their detailed attention to the mathematical notation. We have addressed all points below.
(4.1) In lines 555, Materials and Methods, subsection, Quantification of Intensity Traces, multiple equations are not numbered. For example, after Equation (4), no numbers are provided for the rest of the equations. Please keep consistency throughout the whole document.
We have ensured that all equations are now consistently numbered throughout the document.
(4.2) In line 588, the authors mention "$X$ is a standard normal random variable with mean $\mu$ and standard deviation $s_0$". Please ensure this is correct. A standard normal random variable has a 0 mean and std 1.
Thank you for the suggestion, we have corrected the text (L678).
(4.3) Line 546, Equation 2. The authors use mu(x,y) to describe a 2d Gaussian function. But later in line 587, the authors reuse the same variable name in equation 5 to redefine the intensity as mu = b_0 + I.
We have renamed the 2D Gaussian function to \mu_{2D}(x,y) in the spot tracking section
(4.4) For the complete document, it could be beneficial to the reader if the authors expand the definition of the relationship between the signal "y" and the spot intensity "I". Please note how the paragraph in lines 582-587 does not properly introduce "y".
We have added an explicit definition of y and its relationship to the underlying spot intensity I in the text to improve readability and clarity.
(4.5) Please ensure consistency in variable names. For example, "I" is used in line 587 for the experimental spot intensity, then line 763 redefines I(t) as the total intensity obtained from the TASEP model; please use "I_sim(t)" for simulated intensities. Please note that reusing the variable "I" for different contexts makes it hard for the reader to follow the text.
We agree that this was confusing. We have implemented the suggestion and now distinguish simulated intensities using the notation I<sub>S</sub> .
(4.6) Line 555 "The prior on the total intensity I is an "uninformative" prior" I ~ half_normal(1000). Please ensure it is not "I_0 ~ half_normal(1000)."?
We confirm that “I” is the correct variable representing the total intensity in this context; we do not use an “I<sub>0</sub>” variable here.
(4.7) In lines 595, equation 6. Ensure that the equation is correct. Shouldn't it be: s_0^2 = ln ( 1 + (sigma_meas^2 / ⟨y⟩^2) )? Please ensure that this is correct and it is not affecting the calculated values given in lines 598.
Thank you for catching this typo. We have corrected the equation in the manuscript. We confirm that the calculations performed in the code used the correct formula, so the reported values remain unchanged.
(4.8) In line 597, "the mean intensity square ^2". Please ensure it is not "the square of the temporal mean intensity."
We have corrected the text to "the square of the temporal mean intensity."
(4.9) In lines 602-619, Bayesian modeling of run-off traces, please ensure to introduce the constant "\ell". Used to define the ribosomal footprint?
We have added the explicit definition of 𝓁 as the ribosome footprint size (length of transcript occupied by one ribosome) in the "Bayesian modeling of run-off traces" section.
(4.10) Line 687 has a minor typo "[...] ribosome distribution.. Then, [...]"
We have corrected the punctuation.
(4.11) In line 678, Equation 19 introduces the constant "L_S", Please ensure that it is defined in the text.
We have added the explicit definition of L<sub>S</sub> (the length of the SunTag) to the text surrounding Equation 19.
(4.12) In line 695, Equation 22, please consider using a subscript to differentiate the variance due to ribosome configuration. For example, instead of "sigma (...)^2" use something like "sigma_c ^2 (...)". Ensure that this change is correctly applied to Equation 24 and all other affected equations.
Thank you, we have implemented the suggestions.
(4.13) In line 696, please double-check equations 26 and 27. Specifically, the denominator ^2. Given the previous text, it is hard to follow the meaning of this variable.
We have revised the notation in Equations 26 and 27 to ensure the denominator is consistent with the definitions provided in the text.
(4.14) In lines 726, the authors mention "[...], but for the purposes of this dissertation [...]", it should be "[...], but for the purposes of this study [...]"
Thank you for spotting this. We have replaced "dissertation" with "study."
(4.15) Equations 5, 28, 37, and the unnumbered equation between Equations 16 and 17 are similar, but in some, "y" does not explicitly depend on time. Please ensure this is correct.
We have verified these equations and believe they are correct.
(4.16) Please review the complete document and ensure that variables and constants used in the equations are defined in the text. Please ensure that the same variable names are not reused for different concepts. To improve readability and flow in the text, please review the complete Materials and Methods sections and evaluate if the modeling section can be written more clearly and concisely. For example, Equation 28 is repeated in the text.
We have performed a comprehensive review of the Materials and Methods section. To improve conciseness and flow, we have merged the subsection “Observation model and estimation of observation parameters” with the “Bayesian modeling of run-off traces” section. This allowed us to remove redundant definitions and repeated equations (such as the previous Equation 28). We have also checked that all variables and constants are defined upon first use and that variable names remain consistent throughout the manuscript.
Reviewer #3 (Recommendations for the authors):
(1) Data Presentation
(1.1) In main Figures 1D and 4E, the traces appear to show frequent on-off-on transitions ("bursting"), but in supplementary figures (1-S1A and 4-S1A), this behavior is seen in only ~8 of 54 traces. Are the main figure examples truly representative?
We acknowledge the reviewer's point. In Figure 1D, we selected some of the longest and most illustrative traces to highlight the bursting dynamics. We agree that the term "representative" might be misleading if interpreted as "average." We have updated the text to state "we show bursting traces" to more accurately reflect the selection.
(1.2) There are 8 videos, but I could not identify which is which.
Thank you for pointing this out. We have renamed the video files to clearly correspond to the figures and conditions they represent.
(2) Data Availability:
As noted above, the data should be shared. This is in accordance with eLife's policy: "Authors must make all original data used to support the claims of the paper, or that are required to reproduce them, available in the manuscript text, tables, figures or supplementary materials, or at a trusted digital repository (the latter is recommended). [...] eLife considers works to be published when they are posted as preprints, and expects preprints we review to meet the standards outlined here." Access to the time traces would have been helpful for reviewers.
We have now added the Github link for the code (https://github.com/naef-lab/suntag-analysis) and deposited the raw data (.ome.tif files) on Zenodo (10.5281/zenodo.17669332).
(3) Model Assumptions:
(3.1) The broad range of run-off times (Figure 3A) suggests stalling, which may be incompatible with the 'low-density' assumption used on the TASEP model, which essentially assumes that ribosomes do not bump into each other. This could impact the validity of the assumptions that ribosomes behave independently, elongate at constant speed (necessary for the continuum-limit approximation), and that the rate-limiting step is the initiation. How robust are the inferences to this assumption?
We agree that the deviation of waiting times from an exponential distribution (Figure 3 - figure supplement 2C) suggests the presence of stalling, which challenges the strict low-density assumption and constant elongation speed. We explicitly explored the robustness of our model to higher ribosome densities in simulations. As shown in Figure 2 - figure supplement 2, while the model accuracy for single parameters deteriorates at very high densities (overestimating density due to neglected interference), it remains robust for estimating global rates in the regime relevant to our data. We have expanded the discussion on the limitations of the low density and homogeneous elongation rate assumptions in the text (L404-408).
(3.2) Since all constructs share the same SunTag region, elongation rates should be identical there and diverge only in the variable region. This would affect $\gamma (t)$ and hence possibly affect the results. A brief discussion would be helpful.
This is a valid point. Currently, our model infers a single average elongation rate that effectively averages the behavior over the SunTag and the variable CDS regions. Modeling distinct rates for these regions would be a valuable extension but adds significant complexity. While our current "effective rate" approach might underestimate the magnitude of differences between reporters, it captures the global kinetic trend. We have added a brief discussion acknowledging this simplification (L408-412).
(3.3) A similar point applies to the Gillespie simulations: modeling the SunTag region with a shared elongation rate would be more accurate.
We agree. Simulating distinct rates for the SunTag and CDS would increase realism, though our current homogeneous simulations serve primarily to benchmark the inference framework itself. We have noted this as a potential future improvement (L413-414).
(3.4) Equation (13) assumes that switching between bursting and non-bursting states is much slower than the elongation time. First, this should be made explicit. Second, this is not quite true (~5 min elongation time on Figure 3-s2A vs ~5-15min switching times on Figure 1). It would be useful to show the intensity distribution at t=0 and compare it to the expected mixture distribution (i.e., a Poisson distribution + some extra 'N=0' cells).
We thank the reviewer for this insightful comment. We have added a sentence to the text explicitly stating the assumption that switching dynamics are slower than the translation time. While the timescales are indeed closer than ideal (5 min vs. 5-15 min), this assumption allows for a tractable approximation of the initial conditions for the run-off inference. Comparing the intensity distribution at t=0 to a zero-inflated Poisson distribution is an excellent suggestion for validation, which we will consider for future iterations of the model.
(4) Microscopy Quantifications:
(4.1) Figure 1-S2A shows variable scFv-GFP expression across cells. Were cells selected for uniform expression in the analysis? Or is the SunTag assumed saturated? which would then need to be demonstrated.
All cell lines used are monoclonal, and cells were selected via FACS for consistent average cytoplasmic GFP signal. We assume the SunTag is saturated based on the established characterization of the system by Tanenbaum et al. (2014), where the high affinity of the scFv-GFP ensures saturation at expression levels similar to ours.
(4.2) As translation proceeds, free scFv-GFP may become limiting due to the accumulation of mature SunTag-containing proteins. This would be difficult to detect (since mature proteins stay in the cytoplasm) and could affect intensity measurements (newly synthesized SunTag proteins getting dimmer over time).
This effect can occur with very long induction times. To mitigate this, we optimized the Doxycycline (Dox) incubation time for our harringtonine experiments to prevent excessive accumulation of mature protein. We also monitor the cytoplasmic background for granularity, which would indicate aggregation or accumulation.
(4.3) The statements "for some traces, the mRNA signal was lost before the run-off completion" (line 195) and "we observed relatively consistent fractions of translated transcripts and trace duration distributions across reporters" (line 340) should be supported by a supplementary figure.
The first statement is supported by Figure 2 - figure supplement 1, which shows representative run-off traces for all constructs, including incomplete ones.
The second statement regarding consistency is supported by the quantitative data in Figure 1E and G, which summarize the fraction of translated transcripts and trace durations across conditions.
(4.4) Measurements of single mature protein intensity $i_{MP}$:
(4.4.1) Since puromycin is used to disassemble elongating ribosomes, calibration may be biased by incomplete translation products (likely a substantial fraction, since the Dox induction is only 20min and RNAs need several minutes to be transcribed, exported, and then fully translated).
As mentioned in the “Live-cell imaging” paragraph, the imaging takes place 40 min after the end of Dox incubation. This provides ample time for mRNA export and full translation of the synthesized proteins. Consequently, the fraction of incomplete products generated by the final puromycin addition is negligible compared to the pool of fully synthesized mature proteins accumulated during the preceding hour.
(4.4.2) Line 519: "The intensity of each spot is averaged over the 100 frames". Do I understand correctly that you are looking at immobile proteins? What immobilizes these proteins? Are these small aggregates? It would be surprising that these aggregates have really only 1, 2, or 3 proteins, as suggested by Figure 1-S2A.
We are visualizing mature proteins that are specifically tethered to the actin cytoskeleton. This is achieved using a reporter where the RH1 domain is fused directly to the C-terminus of the Renilla protein (SunTag-Renilla-RH1). The RH1 domain recruits the endogenous Myosin Va motor, which anchors the protein to actin filaments, rendering it immobile. Since each Myosin Va motor interacts with one RH1 domain (and thus one mature protein), the resulting spots represent individual immobilized proteins rather than aggregates. We have now revised the text and Methods section to make this calibration strategy and the construct design clearer (L130-140).
(4.4.3) Estimating the average intensity $i_{MP}$ of single proteins all resides in the seeing discrete modes in the histogram of Figure 1-S2B, which is not very convincing. A complementary experiment, measuring *on the same microscope* the intensity of an object with a known number of GFP molecules (e.g., MS2-GFP labeled RNAs, or individual GEMs https://doi.org/10.1016/j.cell.2018.05.042 (only requiring a single transfection)) would be reassuring to convince the reader that we are not off by an order of magnitude.
While a complementary calibration experiment would be valuable, we believe our current estimate is robust because it is independently validated by our model. When we inferred i<sub>MP</sub> as a free parameter in the HMM (Figure 5 - figure supplement 2B), the resulting value (10-15 a.u.) was remarkably consistent with our experimental calibration (14 ± 2 a.u.). We have clarified this independent validation in the text to strengthen the confidence in our quantification (L264-272).
(4.4.4) Further on the histogram in Figure 1-S2B:
- The gap between the first two modes is unexpectedly sharp. Can you double-check? It means that we have a completely empty bin between two of the most populated bins.
We have double-checked the data; the plot is correct, though the sharp gap is likely due to the small sample size (n=29).
- I am surprised not to see 3 modes or more, given that panel A shows three levels of intensity (the three colors of the arrows).
As noted below, brighter foci exist but fall outside the displayed range of the histogram.
- It is unclear what the statistical test is and what it is supposed to demonstrate.
The Student's t-test compares the means of the two identified populations to confirm they are statistically distinct intensity groups.
- I count n = 29, not 31. (The sample is small enough that the bars of the histogram show clear discrete heights, proportional to 1, 2, 3, 4, and 5 --adding up all the counts, I get 29). Is there a mistake somewhere? Or are some points falling outside of the displayed x-range?
You are correct. Two brighter data points fell outside the displayed range. The total number of foci in the histogram is 29. We have corrected the figure caption and the text accordingly.
(5) Miscellaneous Points:
(5.1) Panel B in Figure 2-s1 appears to be missing.
The figure contains only one panel.
(5.2) In Equation (7), $l$ is not defined (presumably ribosome footprint length?). Instead, $J$ is defined right after eq (7), as if it were used in this equation.
Thank you for pointing this out, we have corrected it.
(5.3) Line 703, did you mean to write something else than "Equation 26" (since equation 26 is defined after)?
Yes, this was a typo. We have corrected the cross-reference.
Synthèse de la Matinale Associations : Fiscalité, Mécénat et Fonds de Dotation
Ce document synthétise les interventions de la Direction Régionale des Finances Publiques (DRFIP) d’Île-de-France lors d'un webinaire consacré à l'actualité fiscale des organismes sans but lucratif (OSBL).
La gestion fiscale des associations et fonds de dotation est marquée par une recherche accrue de sécurité juridique, illustrée par une hausse constante des demandes de rescrit fiscal (près de 50 % des demandes totales concernent le secteur associatif).
Les points critiques à retenir sont le renforcement des contrôles sur l'émission des reçus fiscaux suite à la loi du 24 août 2021, l'application rigoureuse des critères de non-lucrativité (règle des « 4P » et gestion désintéressée), et la distinction impérative entre le mécénat et le parrainage commercial.
Enfin, le cadre des fonds de dotation, bien que plus souple, impose des obligations déclaratives et de dotation minimale (15 000 €) strictes.
--------------------------------------------------------------------------------
La Direction Régionale des Finances Publiques d'Île-de-France, et plus particulièrement son pôle de contrôle fiscal et des affaires juridiques, assure une mission de sécurisation de la dépense fiscale.
Le rescrit est une procédure volontaire permettant à un organisme d'obtenir une prise de position formelle de l'administration sur son régime fiscal.
• Statistiques : En 2025, la DRFIP prévoit de traiter environ 1 140 demandes de rescrits, dont 493 concernent spécifiquement les associations (soit environ 45 %).
• Objectif : Sécuriser l'émission des reçus fiscaux pour les donateurs afin d'éviter des remises en cause ultérieures lors de contrôles.
• Limites : Le rescrit ne protège l'organisme que si les informations fournies sont exhaustives et conformes à la réalité. Il n'empêche pas un contrôle fiscal ultérieur.
La loi confortant le respect des principes de la République a transformé la nature des contrôles :
• Avant 2021 : Simple contrôle de concordance des montants.
• Depuis 2021 : Contrôle de validité sur le fond. L'administration vérifie si l'organisme est réellement fondé à émettre des reçus fiscaux au regard des critères d'intérêt général.
--------------------------------------------------------------------------------
Le régime par défaut d'une association est l'exonération des impôts commerciaux, basée sur une présomption simple de non-lucrativité.
L'administration peut toutefois apporter la preuve contraire en suivant une analyse par étapes.
C’est la condition préalable indispensable. Elle repose sur trois piliers :
• Absence de rémunération des dirigeants : Les dirigeants doivent être bénévoles.
Une tolérance existe pour une rémunération ne dépassant pas les 3/4 du SMIC, appréciée annuellement.
• Absence de distribution de ressources : Aucun bénéfice ne doit être reversé aux membres.
• Absence d'attribution de parts d'actif : Les membres ne peuvent pas s'approprier les biens de l'association, même lors de sa dissolution.
Si une association intervient dans un secteur concurrentiel, l'administration évalue ses modalités de gestion par rapport aux entreprises commerciales selon le faisceau d'indices dit des « 4P » (par ordre d'importance décroissante) :
| Critère | Analyse | | --- | --- | | Produit | L'utilité sociale du service rendu (ex: méthodes adaptées pour les troubles dys). | | Public | Le service s'adresse-t-il à des personnes ne pouvant normalement pas y accéder (critères sociaux) ? | | Prix | Les tarifs sont-ils nettement inférieurs au marché ou modulés selon les revenus ? | | Publicité | L'association utilise-t-elle des méthodes commerciales de promotion ou une simple information ? |
Une association peut être jugée lucrative si elle constitue le prolongement d'une entreprise commerciale ou lui offre des débouchés.
• Jurisprudence "Audace" (2016) : Une association servant de « capteur de clientèle » pour une société d'assistance juridique dirigée par la même personne a été requalifiée en organisme lucratif.
• Relations privilégiées : Cette notion s'applique lorsque l'association permet à des entreprises membres de réduire leurs dépenses (ex: études de marché à moindre coût), leur offrant ainsi un avantage concurrentiel.
--------------------------------------------------------------------------------
Le dispositif du mécénat a été libéralisé par la loi de décembre 2023 (entrée en vigueur en janvier 2024), mais reste soumis à des définitions strictes.
L'intérêt général au sens fiscal (articles 200 et 238 bis du CGI) diffère du sens commun. Il exige :
• Une gestion désintéressée.
• Une activité non lucrative.
• L'absence de bénéfice pour un « cercle restreint » de personnes.
La distinction repose sur la valorisation des contreparties :
• Mécénat : Il doit exister une disproportion marquée entre le don et les contreparties reçues par le donateur (ex: simple mention du nom du donateur).
• Parrainage (Sponsoring) : Si les contreparties (publicité, logos sur maillots, cocktails premium, places réservées) ont une valeur proche du montant versé, il s'agit d'une prestation de service commerciale taxable.
Le législateur autorise certains organismes lucratifs (ex: sociétés commerciales détenues par des entités publiques) à bénéficier du mécénat pour des activités de spectacle vivant, de cinéma ou d'expositions d'art contemporain, à condition que la gestion reste désintéressée.
--------------------------------------------------------------------------------
Créés par la loi de 2008, les fonds de dotation visent à favoriser le mécénat pour le financement de missions d'intérêt général.
• Fonds opérateur : Réalise lui-même des activités d'intérêt général.
• Fonds redistributeur : Collecte des fonds pour les reverser à d'autres organismes d'intérêt général.
• Mixte : Combine les deux activités.
• Dotation minimale : 15 000 €.
• Obligations déclaratives : Déclaration annuelle en préfecture précisant le montant de la collecte et des redistributions.
• Consomptibilité : Si les statuts prévoient que la dotation peut être consommée, le fonds perd certains avantages fiscaux sur ses revenus patrimoniaux (soumission à l'IS à taux réduit).
• Taxe sur les salaires : Les fonds de dotation y sont soumis sans l'abattement dont bénéficient les associations (2 144 €), sauf pour les salaires liés à l'organisation de six manifestations de bienfaisance annuelles.
--------------------------------------------------------------------------------
L'administration s'appuie sur des cas concrets pour illustrer l'application des règles :
• École de voile de Carantec : Requalification lucrative car la zone de chalandise (touristes venant de toute la France) et les tarifs étaient comparables aux écoles de voile commerciales de la région.
• Arrêt "Piou-Piou" (2022) : Une association de ski pour enfants entretenait des relations privilégiées avec les moniteurs de l'ESF (membres de l'association), car elle leur fournissait un débouché économique direct.
• Défense de la mémoire (Affaire Maréchal Pétain) : Le mécénat est refusé si l'activité éligible (ex: un musée) est accessoire par rapport à l'objet principal de l'association qui, lui, ne rentre pas dans les critères de la loi.
Une association non lucrative peut exercer des activités commerciales accessoires.
• Franchise d'impôts : Jusqu'à un seuil de 90 011 € (chiffre cité pour 2023/2024), ces revenus ne sont pas imposés si l'activité non lucrative reste prépondérante.
• Au-delà du seuil : L'association doit sectoriser ses activités. Elle paie des impôts commerciaux sur le secteur lucratif dès le premier euro.
• Critère de prépondérance : L'administration ne regarde pas seulement les recettes, mais aussi la mobilisation des ressources (temps de bénévolat, occupation des locaux, salaires) pour déterminer si l'activité non lucrative reste dominante.
Réforme de l'éducation : Enjeux, modèles et perspectives systémiques
Le système éducatif européen, et particulièrement le modèle allemand, fait face à une remise en question fondamentale de ses structures centenaires.
Le débat oppose deux visions : une approche neuroscientifique et réformatrice, prônant l'abolition des notes et l'autonomie, et une approche sociologique et réaliste, soulignant les fonctions de sélection et de cohésion sociale de l'école.
Les points critiques incluent l'impact délétère de l'évaluation chiffrée sur le développement cérébral des jeunes enfants, la persistance des inégalités sociales à travers le tri précoce des élèves, et la nécessité de passer d'une motivation extrinsèque (notes) à une motivation intrinsèque.
Toutefois, les recherches convergent vers un constat central : au-delà de la structure du système, la qualité et l'investissement de l'enseignant demeurent le facteur le plus déterminant de la réussite scolaire.
--------------------------------------------------------------------------------
Le système de notation est au cœur des tensions entre partisans de la tradition et réformateurs.
L'analyse des sources révèle des conséquences divergentes selon le profil des élèves.
La professeure Michaela Brohm-Badri souligne que les notes modifient la chimie cérébrale des élèves :
• Pour les bons élèves : La réussite déclenche la libération de dopamine (motivation) et d'ocytocine.
Cependant, cela remplace la motivation intrinsèque (curiosité naturelle) par une motivation extrinsèque de récompense.
• Pour les élèves en difficulté : L'échec libère de l'adrénaline et du cortisol (hormones du stress).
L'amygdale bloque alors le cortex préfrontal, empêchant toute réflexion correcte et créant un cercle vicieux de contre-performance.
• Immaturité cérébrale : Le cortex préfrontal n'atteint sa maturité qu'entre 21 et 23 ans.
Noter et orienter les enfants dès 9 ou 10 ans revient à figer leur destin social avant la fin de leur développement biologique.
L'évaluation est critiquée pour son manque d'objectivité, influencée par plusieurs phénomènes :
• La constante macabre : Tendance inconsciente des enseignants à reproduire une courbe de répartition (bons, moyens, faibles) quel que soit le niveau réel de la classe.
• L'effet d'ordre : Un devoir moyen semble meilleur s'il suit une copie très médiocre.
• Facteurs exogènes : L'apparence physique (lunettes, coiffure), l'origine sociale, le sexe ou l'humeur de l'enseignant interfèrent avec la note.
--------------------------------------------------------------------------------
Selon le professeur Roland Reichenbach, l'école ne peut être réduite à un simple lieu d'apprentissage ; elle remplit une dizaine de fonctions essentielles à la société.
• Instruction et intégration : Transmission des savoirs et apprentissage de la vie en communauté.
• Sélection : Bien que critiquée, la sélection prépare à la réalité du marché du travail et de l'économie.
• Gardiennage : Une fonction logistique fondamentale permettant le fonctionnement de la société.
• Éducation démocratique : L'école apprend à l'individu à s'autocorriger, à viser l'objectivité et à dépasser ses désirs individuels.
• Protection contre l'arbitraire privé : Si l'école publique renonçait à l'évaluation, cette mission incomberait au secteur privé, favorisant alors exclusivement les plus riches ou les plus puissants.
--------------------------------------------------------------------------------
Le document met en évidence des disparités majeures dans l'organisation scolaire en Europe :
| Pays | Caractéristiques du système | | --- | --- | | Allemagne | Système conservateur. Orientation précoce (10 ans) vers trois filières (professionnelle, technique, générale). | | France | État centralisé, programmes nationaux, style d'enseignement plutôt autoritaire et hiérarchisé. | | Finlande | Relation d'égalité prof-élève. Pas de notes avant la 3ème. Très haut niveau de performance. | | Royaume-Uni | Forte présence du privé. Innovation technologique précoce (programmation obligatoire dès le secondaire). |
Cette école allemande propose une alternative radicale au modèle frontal :
• Apprentissage autonome : Les élèves sont des "partenaires d'apprentissage". Les cours classiques ("inputs") sont réduits au profit d'ateliers libres.
• Responsabilisation : L'élève décide du moment où il passe ses tests de compétences.
• Mixité sociale et tutorat : L'entraide entre élèves de différentes filières est encouragée.
• Résultats : En 2022, les résultats au baccalauréat y étaient supérieurs à la moyenne régionale, avec une augmentation du nombre d'élèves brillants.
--------------------------------------------------------------------------------
La méta-analyse "Visible Learning" de John Hattie, portant sur plus de 2 100 études, apporte des conclusions nuancées qui bousculent les idéologies :
1. L'enseignant est la variable clé : La réussite scolaire dépend avant tout de la clarté de l'enseignant, de sa gestion de classe et de son investissement individuel auprès des élèves.
2. Dépassement du clivage traditionnel/moderne : Si Hattie valide certains aspects de l'enseignement traditionnel (consignes directes), il soutient également des réformes comme le feedback individualisé et l'abolition des étiquettes (notes).
3. Valorisation de la profession : Dans les pays performants (Finlande, Suède), seuls les 10 % des meilleurs diplômés peuvent devenir enseignants, et la profession bénéficie d'une haute reconnaissance sociale.
--------------------------------------------------------------------------------
Une mise en garde est formulée concernant l'autonomie totale : certains élèves, issus de milieux éloignés de la culture scolaire, ont besoin d'un encadrement strict et d'un guidage direct.
L'apprentissage autonome peut, paradoxalement, accroître les inégalités s'il n'est pas accompagné d'un renforcement de l'affirmation de soi pour les élèves les plus fragiles.
L'égalité des chances ne signifie pas que tous les élèves doivent être identiques ou avancer au même rythme. Le défi moderne de l'école est de concilier :
• Le développement du goût du risque et de l'expérimentation.
• La nécessité d'un feedback pour grandir.
• Le maintien de la motivation intrinsèque face à un monde concurrentiel.
En conclusion, si le système de performance semble inévitable pour la structure sociale et économique, l'enjeu majeur reste de transformer l'autorité autoritaire en une autorité inspirante, capable de valoriser la différence sans la stigmatiser par l'échec.
Author response:
The following is the authors’ response to the original reviews.
Public Reviews:
Reviewer #1 (Public review):
Summary:
Here, the authors aim to investigate the potential improvements of ANNs when used to explain brain data using top-down feedback connections found in the neocortex. To do so, they use a retinotopic and tonotopic organization to model each subregion of the ventral visual (V1, V2, V4, and IT) and ventral auditory (A1, Belt, A4) regions using Convolutional Gated Recurrent Units. The top-down feedback connections are inspired by the apical tree of pyramidal neurons, modeled either with a multiplicative effect (change of gain of the activation function) or a composite effect (change of gain and threshold of the activation function).
To assess the functional impact of the top-down connections, the authors compare three architectures: a brain-like architecture derived directly from brain data analysis, a reversed architecture where all feedforward connections become feedback connections and vice versa, and a random connectivity architecture. More specifically, in the brain-like model the visual regions provide feedforward input to all auditory areas, whereas auditory areas provide feedback to visual regions.
First, the authors found that top-down feedback influences audiovisual processing and that the brain-like model exhibits a visual bias in multimodal visual and auditory tasks. Second, they discovered that in the brain-like model, the composite integration of top-down feedback, similar to that found in the neocortex, leads to an inductive bias toward visual stimuli, which is not observed in the feedforward-only model. Furthermore, the authors found that the brain-like model learns to utilize relevant stimuli more quickly while ignoring distractors. Finally, by analyzing the activations of all hidden layers (brain regions), they found that the feedforward and feedback connectivity of a region could determine its functional specializations during the given tasks.
Strengths:
The study introduces a novel methodology for designing connectivity between regions in deep learning models. The authors also employ several tasks based on audiovisual stimuli to support their conclusions. Additionally, the model utilizes backpropagation of error as a learning algorithm, making it applicable across a range of tasks, from various supervised learning scenarios to reinforcement learning agents. Conversely, the presented framework offers a valuable tool for studying top-down feedback connections in cortical models. Thus, it is a very nice study that also can give inspiration to other fields (machine learning) to start exploring new architectures.
We thank the reviewer for their accurate summary of our work and their kind assessment of its strengths.
Weaknesses:
Although the study explores some novel ideas on how to study the feedback connections of the neocortex, the data presented here are not complete in order to propose a concrete theory of the role of top-down feedback inputs in such models of the brain.
(1) The gap in the literature that the paper tries to fill in the ability of DL algorithms to predict behavior: "However, there are still significant gaps in most deep neural networks' ability to predict behavior, particularly when presented with ambiguous, challenging stimuli." and "[...] to accurately model the brain."
It is unclear to me how the presented work addresses this gap, as the only facts provided are derived from a simple categorization task that could also be solved by the feedforward-only model (see Figures 4 and 5). In my opinion, this statement is somewhat far-fetched, and there is insufficient data throughout the manuscript to support this claim.
We can see now that the way the introduction was initially written led to some confusion about our goal in this study. Our goal here was not to demonstrate that top-down feedback can enable superior matches to human behaviour. Rather, our goal was to determine if top-down feedback had any real implications for processing ambiguous stimuli. The sentence that the reviewer has highlighted was intended as an explanation for why top-down feedback, and its impact on ambiguous stimuli, might be something one would want to examine for deep neural networks. But, here, we simply wanted to (1) provide an overview of the code base we have created, (2) demonstrate that top-down feedback does impact the processing of ambiguous stimuli.
We agree with the reviewer that if our goal was to improve our ability to predict behaviour, then there was a big gap in the evidence we provided here. But, this was not our goal, and we believe that the data we provide here does convincingly show that top-down feedback has an impact on processing of ambiguous stimuli. We have updated the text in the introduction to make our goals more clear for the reader and avoid this misunderstanding of what we were trying to accomplish here. Specifically, the end of the introduction is changed to:
“To study the effect of top-down feedback on such tasks, we built a freely available code base for creating deep neural networks with an algorithmic approximation of top-down feedback. Specifically, top-down feedback was designed to modulate ongoing activity in recurrent, convolutional neural networks. We explored different architectural configurations of connectivity, including a configuration based on the human brain, where all visual areas send feedforward inputs to, and receive top-down feedback from, the auditory areas. The human brain-based model performed well on all audiovisual tasks, but displayed a unique and persistent visual bias compared to models with only driving connectivity and models with different hierarchies. This qualitatively matches the reported visual bias of humans engaged in audio-visual tasks. Our results confirm that distinct configurations of feedforward/feedback connectivity have an important functional impact on a model's behavior. Therefore, top-down feedback captures behaviors and perceptual preferences that do not manifest reliably in feedforward-only networks. Further experiments are needed to clarify whether top-down feedback helps an ANN fit better to neural data, but the results show that top-down feedback affects the processing of stimuli and is thus a relevant feature that should be considered for deep ANN models in computational neuroscience more broadly.”
(2) It is not clear what the advantages are between the brain-like model and a feedforward-only model in terms of performance in solving the task. Given Figures 4 and 5, it is evident that the feedforward-only model reaches almost the same performance as the brain-like model (when the latter uses the modulatory feedback with the composite function) on almost all tasks tested. The speed of learning is nearly the same: for some tested tasks the brain-like model learns faster, while for others it learns slower. Thus, it is hard to attribute a functional implication to the feedback connections given the presented figures and therefore the strong claims in the Discussion should be rephrased or toned down.
Again, we believe that there has been a misunderstanding regarding the goals of this study, as we are not trying to claim here that there are performance advantages conferred by top-down feedback in this case. Indeed, we share the reviewer’s assessment that the feedforward only model seems to be capable of solving this task well. To reiterate: our goal here was to demonstrate that top-down feedback alters the computations in the network and, thus, has distinct effects on behaviour that need to be considered by researchers who use deep networks to model the brain. But we make no claims of “superiority” of the brain-like model.
In-line with this, we’re not completely sure which claims in the discussion the reviewer is referring to. We note that we were quite careful in our claims. For example, in the first section of the discussion we say:
“Altogether, our results demonstrate that the distinction between feedforward and feedback inputs has clear computational implications, and that ANN models of the brain should therefore consider top-down feedback as an important biological feature.”
And later on:
“In summary, our study shows that modulatory top-down feedback and the architectural diversity enabled by it can have important functional implications for computational models of the brain. We believe that future work examining brain function with deep neural networks should therefore consider incorporating top-down modulatory feedback into model architectures when appropriate.”
If we have missed a claim in the discussion that implies superiority of the brain-like model in terms of task performance we would be happy to change it.
(3) The Methods section lacks sufficient detail. There is no explanation provided for the choice of hyperparameters nor for the structure of the networks (number of trainable parameters, number of nodes per layer, etc). Clarifying the rationale behind these decisions would enhance understanding. Moreover, since the authors draw conclusions based on the performance of the networks on specific tasks, it is unclear whether the comparisons are fair, particularly concerning the number of trainable parameters. Furthermore, it is not clear if the visual bias observed in the brain-like model is an emerging property of the network or has been created because of the asymmetries in the visual vs. auditory pathway (size of the layer, number of layers, etc).
We thank the reviewer for raising this issue, and want to provide some clarifications: First, the number of trainable parameters are roughly equal, since we were only switching the direction of connectivity (top-down versus bottom-up), not the number of connections. We confirmed the biggest difference in size is between models with composite and multiplicative feedback; models with composite feedback have roughly ~1K more parameters, and all models are within the 280K parameter range. We now state this in the methods.
Second, because superior performance was not the goal of this study, as stated above, we conducted limited hyperparameter tuning. Given the reviewer’s comment, we wondered whether this may have impacted our results. Therefore, we explored different hyperparameters for the model during the multimodal auditory tasks, which show the clearest example of the visual dominance in the brainlike model (Figure 3).
We explored different hidden state sizes, learning rates and processing times, and examined whether the core results were different. We found that extremely high learning rates (0.1) destabilize all models and that some models perform poorly under different processing times. But overall, the core results are evident across all hyperparameters where the models learn i.e the different behaviors of models with different connectivities and the visual dominance observed in the brainlike model. We now provide these results in a supplementary figure (Fig. S2, showing larger models trained with different learning rates, and Fig S3, which shows the effect of processing time on AS task performance).
Reviewer #2 (Public review):
Summary:
This work addresses the question of whether artificial deep neural network models of the brain could be improved by incorporating top-down feedback, inspired by the architecture of the neocortex.
In line with known biological features of cortical top-down feedback, the authors model such feedback connections with both, a typical driving effect and a purely modulatory effect on the activation of units in the network.
To assess the functional impact of these top-down connections, they compare different architectures of feedforward and feedback connections in a model that mimics the ventral visual and auditory pathways in the cortex on an audiovisual integration task.
Notably, one architecture is inspired by human anatomical data, where higher visual and auditory layers possess modulatory top-down connections to all lower-level layers of the same modality, and visual areas provide feedforward input to auditory layers, whereas auditory areas provide modulatory feedback to visual areas.
First, the authors find that this brain-like architecture imparts the models with a light visual bias similar to what is seen in human data, which is the opposite in a reversed architecture, where auditory areas provide a feedforward drive to the visual areas.
Second, they find that, in their model, modulatory feedback should be complemented by a driving component to enable effective audiovisual integration, similar to what is observed in neural data.
Last, they find that the brain-like architecture with modulatory feedback learns a bit faster in some audiovisual switching tasks compared to a feedforward-only model.
Overall, the study shows some possible functional implications when adding feedback connections in a deep artificial neural network that mimics some functional aspects of visual perception in humans.
Strengths:
The study contains innovative ideas, such as incorporating an anatomically inspired architecture into a deep ANN, and comparing its impact on a relevant task to alternative architectures.
Moreover, the simplicity of the model allows it to draw conclusions on how features of the architecture and functional aspects of the top-down feedback affect the performance of the network.
This could be a helpful resource for future studies of the impact of top-down connections in deep artificial neural network models of the neocortex.
We thank the reviewer for their summary and their recognition of the innovative components and helpful resources therein.
Weaknesses:
Overall, the study appears to be a bit premature, as several parts need to be worked out more to support the claims of the paper and to increase its impact.
First, the functional implication of modulatory feedback is not really clear. The "only feedforward" model (is a drive-only model meant?) attains the same performance as the composite model (with modulatory feedback) on virtually all tasks tested, it just takes a bit longer to learn for some tasks, but then is also faster at others. It even reproduces the visual bias on the audiovisual switching task. Therefore, the claims "Altogether, our results demonstrate that the distinction between feedforward and feedback inputs has clear computational implications, and that ANN models of the brain should therefore consider top-down feedback as an important biological feature." and "More broadly, our work supports the conclusion that both the cellular neurophysiology and structure of feed-back inputs have critical functional implications that need to be considered by computational models of brain function" are not sufficiently supported by the results of the study. Moreover, the latter points would require showing that this model describes neural data better, e.g., by comparing representations in the model with and without top-down feedback to recorded neural activity.
To emphasize again our specific claims, we believe that our data shows that top-down feedback has functional implications for deep neural network behaviour, not increased performance or neural alignment. Indeed, our results demonstrate that top-down feedback alters the behaviour of the networks, as shown by the differences in responses to various combinations of ambiguous stimuli. We agree with the reviewer that if our goal was to claim either superior performance on these tasks, or better fit to neural data, we would need to actually provide data supporting that claim.
Given the comments from the reviewer, we have tried to provide more clarity in the introduction and discussion regarding our claims. In particular, we now highlight that we are not trying to demonstrate that the models with top-down feedback exhibit superior performance or better fit to neural data.
As one final note, yes, the reviewer understood correctly that the “only feedforward” model is a model with only driving inputs. We have renamed the feedforward-only models to drive only models and added additional emphasis in the text to ensure that the distinction is clear for all readers.
Second, the analyses are not supported by supplementary material, hence it is difficult to evaluate parts of the claims. For example, it would be helpful to investigate the impact of the process time after which the output is taken for evaluation of the model. This is especially important because in recurrent and feedback models the convergence should be checked, and if the network does not converge, then it should be discussed why at which point in time the network is evaluated.
This is an excellent point, and we thank the reviewer for raising it. We allowed the network to process the stimuli for seven time-steps, which was enough for information from any one region to be transmitted to any other. We found in some initial investigations that if we shortened the processing time some seeds would fail to solve the task. But, based on the reviewer’s comment, we have now also run additional tests with longer processing times for the auditory tasks where we see the clearest visual bias (Figure 3). We find that different process times do not change the behavioral biases observed in our models, but may introduce difficulties ignoring visual stimuli for some models. Thus, while process time is an important hyperparameter for optimal performance of the model, the central claim of the paper remains. We include this new data in a supplementary figure S3.
Third, the descriptions of the models in the methods are hard to understand, i.e., parameters are not described and equations are explained by referring to multiple other studies. Since the implications of the results heavily rely on the model, a more detailed description of the model seems necessary.
We agree with the reviewer that the methods could have been more thorough. Therefore, we have greatly expanded the methods section. We hope the model details are now more clear.
Lastly, the discussion and testable predictions are not very well worked out and need more details. For example, the point "This represents another testable prediction flowing from our study, which could be studied in humans by examining the optical flow (Pines et al., 2023) between auditory and visual regions during an audiovisual task" needs to be made more precise to be useful as a prediction. What did the model predict in terms of "optic flow", how can modulatory from simple driving effect be distinguished, etc.
We see that the original wording of this prediction was ambiguous, thank you for pointing this out. In the study highlighted (Pines et al., 2023) the authors use an analysis technique for measuring information flow between brain regions, which is related to analysis of optical flow in images, but applied to fMRI scans. This is confusing given the current study, though. Therefore, we have changed this sentence to make clear that we are speaking of information flow here.
Reviewer #3 (Public review):
Summary:
This study investigates the computational role of top-down feedback in artificial neural networks (ANNs), a feature that is prevalent in the brain but largely absent in standard ANN architectures. The authors construct hierarchical recurrent ANN models that incorporate key properties of top-down feedback in the neocortex. Using these models in an audiovisual integration task, they find that hierarchical structures introduce a mild visual bias, akin to that observed in human perception, not always compromising task performance.
Strengths:
The study investigates a relevant and current topic of considering top-down feedback in deep neural networks. In designing their brain-like model, they use neurophysiological data, such as externopyramidisation and hierarchical connectivity. Their brain-like model exhibits a visual bias that qualitatively matches human perception.
We thank the reviewer for their summary and evaluation of our paper’s strengths.
Weaknesses:
While the model is brain-inspired, it has limited bioplausibility. The model assumes a simplified and fixed hierarchy. In the brain with additional neuromodulation, the hierarchy could be more flexible and more task-dependent.
We agree, there are still many facets of top-down feedback that we have not captured here, and the modulation of hierarchy is an interesting example. We have added some consideration of this point to the limitations section of the discussion.
While the brain-like model showed an advantage in ignoring distracting auditory inputs, it struggled when visual information had to be ignored. This suggests that its rigid bias toward visual processing could make it less adaptive in tasks requiring flexible multimodal integration. It hence does not necessarily constitute an improvement over existing ANNs. It is unclear, whether this aspect of the model also matches human data. In general, there is no direct comparison to human data. The study does not evaluate whether the top-down feedback architecture scales well to more complex problems or larger datasets. The model is not well enough specified in the methods and some definitions are missing.
We agree with the reviewer that we have not demonstrated anything like superior performance (since the brain-like network is quite rigid, as noted) nor have we shown better match to human data with the brain-like network. This was not our intended claim. Rather, we demonstrated here simply that top-down feedback impacts behavior of the networks in response to ambiguous stimuli. We have now added statements to the introduction and discussion to make our specific claims (which are supported by our data, we believe) clear.
Recommendations for the authors:
Reviewer #1 (Recommendations for the authors):
I believe that the work is very nice but not so mature at this stage. Below, you can find some comments that eventually could improve your manuscript.
(1) Intro, last sentence: "Therefore, top-down feedback is a relevant feature that should be considered for deep ANN models in computational neuroscience more broadly." I don't understand what the authors refer to with this sentence. There are numerous models (deep ANNs) that have been used to model the neural activity and are much simpler than the one proposed here which contains very complex models and connectivity. Although I do agree that the top-down connections are very important there is no data to support their importance for modeling the brain.
Respectfully, we disagree with the reviewer that we don’t provide data to demonstrate the importance of top-down feedback for modelling. Indeed, we provided a great deal of data to show that top-down feedback in the networks has real functional implications for behaviour, e.g., it can induce a human-like visual bias. Thus, top-down feedback is a factor that one should care about when modelling the brain. But, we agree with the reviewer that more demonstration of the utility of using top-down feedback for achieving better fits to neural data would be an important next step.
(2) I suggest adding some extra supplementary simulations where, for example, the number of data for visual and auditory pathways is equal in size (i.e., the same number of examples), the number of layers is identical (3 per pathway), and also the number of parameters. Doing this would help strengthen the claims presented in the paper.
In fact, all of the hyperparameters the reviewer mentions here were identical for the different networks, so the experiments the reviewer is requesting here were already part of the paper. We now clarify this in the text.
(3) Results: I suggest adding Tables with quantifications of the presented results. For example, best performance, epochs to converge, etc. As it is now, it is very hard to follow the evidence shown in Figures.
This is a good suggestion, we have now added this table to the start of the supplemental figures.
(4) Figure 2e, 3e: Although VS3, and AS3 have been used only for testing, the plot shows alignments with respect to training epochs. The authors should clarify in the Methods if they tested the network with all intermediate weights during VS1/VS2 or AS1/AS2 training.
Testing scenarios in this context meant that the model was never shown the scenario/task during training, but the models were indeed evaluated on the VS3 and AS3 after each training epoch. We have added clarifications to the figure legends.
(5) Methods: It would be beneficial to discuss how specific hyperparameters were selected based on prior research, empirical testing, or theoretical considerations. Also, it is not clear how the alignment (visual or audio) is calculated. Do the authors use the examples that have been classified correctly for both stimuli or do they exclude those from the analysis (maybe I have missed it).
As noted above, because superior performance was not the goal of this study, we conducted limited hyperparameter tuning. But we have extended the results with additional hyperparameter tuning in a supplementary figure, and describe the hyperparameter choices more thoroughly in the methods. As well, all data includes all model responses, regardless of whether they were correct or not. We now clarify this in the methods.
(6) Code: The code repository lacks straightforward examples demonstrating how to utilize the modeling approach. Given that it is referred to as a "framework", one would expect it to facilitate easy integration into various models and tasks. Including detailed instructions or clear examples would significantly improve usability and help users effectively apply the proposed methodology.
We agree with the reviewer, this would be beneficial. We have revised the README of the codebase to explain the model and its usage more clearly and included an interactive jupyter notebook with example training on MNIST.
Some minor comments are given below. Generally speaking, the Figures need to be more carefully checked for consistent labels, colors, etc.
(1) Page 4, 1st paragraph - grammar correction: "a larger infragranular layer" or "larger infragranular layers"
Thank you for catching this, we have fixed the text.
(2) Page 4, 2nd para - rephrase: "In three additional control ANNs" → "In the third additional control ANN"
In fact, we did mean three additional control ANNs, each one representing a different randomized connectivity profile. We now clarify this in the text and provide the connectivity of the two other random graphs in the supplemental figures.
(3) Page 4, VAE acronym needs to be defined before its first use
The variational autoencoder is introduced by its full name in the text now.
(4) Page 4: Fig. 2c reference should be Fig. 2b, Fig. 2d should be Fig. 2c, Fig. 2b should be Fig. 2d, VS4; Fig. 2b, bottom should be VS4; Fig. 2f, Fig. 2f to Fig. 2g. Double check the Figure references in the text. Here is very confusing for the reader.
We have now fixed this, thank you for catching it.
(5) Page 5, 1st para: "Altogether, our results demonstrated both" → "Altogether, our results demonstrated that both"
This has been updated.
(6) Figure 2: In the e and g panels the x label is missing.
This was actually because the x-axis were the same across the panels, but we see how this was unclear, so we have updated the figure.
(7) Figure 3: There is no panel g (the title is missing); In panels b, c, e, and g the y label is missing, and in panels e and g the x label is missing. Also, the Feedforward model is shown in panel g but it is introduced later in the text. Please remove it from Figure 3. Also in legend: "AV Reverse graph" → "Reverse graph". Also, "Accuracy" and "Alignment" should be presented as percentages (as in Figure 2).
This has been corrected.
(8) Figure 4; x labels are missing.
As with point (6), this was actually because the x-axis were the same across the panels, but we see how this was unclear, so we have updated the figure.
(9) Page 7; I can’t find the cited Figure S1.
Apologies, we have added the supplemental figure (now as S4). It shows the results of models with multiplicative feedback on the task in Fig 5 (as opposed to models with composite feedback shown in the main figure).
Reviewer #2 (Recommendations for the authors):
(1) Discussion Section 3.1 is only a literature review, and does not really add any value.
Respectfully, we think it is important to relate our work to other computational work on the role of top-down feedback, and to make clear what our specific contribution is. But, we have updated the text to try to place additional emphasis on our study’s contribution, so that this section is more than just a literature review.
“Our study adds to this previous work by incorporating modulatory top-down feedback into deep, convolutional, recurrent networks that can be matched to real brain anatomy. Importantly, using this framework we could demonstrate that the specific architecture of top-down feedback in a neural network has important computational implications, endowing networks with different inductive biases.”
(2) Including ipython notebooks and some examples would be great to make it easier to use the code.
We now provide a demo of how to use the code base in a jupyter notebook.
(3) The description of the model is hard to comprehend. Please name and describe all parameters. Also, a figure would be great to understand the different model equations.
We have added definitions of all model terms and parameters.
(4) The terminology is not really clear to me. For example "The results further suggest that different configurations of top-down feedback make otherwise identically connected models functionally distinct from each other and from traditional feedforward only recurrent models." The feedforward and only recurrent seem to contradict each other. Would maybe driving and modulatory be a better term here? I also saw in the code that you differentiate between three types of inputs, modulatory, threshold offset and basal (like feedforward). How about you only classify connections based on these three type? I was also confused about the feedforward only model, because I was unsure whether it is still feedback connections but with "basal" quality, or whether feedback connections between modalities and higher-to-lower level layers were omitted altogether.
We take the reviewer’s point here. To clarify this, we have updated the text to refer to “driving only” rather than “feedforward only”, to make it obvious that what we change in these models is simply whether the connection has any modulatory impact on the activity.
(5) "incorporating it into ANNs can affect their behavior and help determine the solutions that the network can discover." -> Do you mean constrain? Overall, I did not really get this point.
Yes, we mean that it constrains the solutions that the network is likely to discover.
(6) "ignore the auditory inputs when they visual inputs were unambiguous" -> the not they
This has been fixed. Thank you for catching it.
(7) xlabel in Figure 4 is missing.
This has been fixed, thank you for catching it.
Reviewer #3 (Recommendations for the authors):
Major:
(1) How alignment is computed is not defined. In addition to a proper definition in the methods section, it would be nice to briefly define it when it first appears in the results section.
We’ve added an explicit definition of how alignment is calculated in the methods and emphasized the calculation when its first explained in the results
(2) A connectivity matrix for the feedforward-only model is missing and could be added.
We have added this to Figure 1.
(3) The connectivity matrix for each random model should also be shown.
We’ve shown each of the random model configurations in the new supplemental figure S1.
(4) Initial parameters are not defined, such as W, b etc. A table with all model parameters would be great.
We have added a table to the methods listing all of the parameters.
(5) Would be nice to show the t-sne plots (not just the NH score) for each model and each task in the appendix.
We can provide these figures on request. They massively increase the file size of the paper pdf, as there’s 49 of them for each task and each model, 980 in total. An example t-SNE plot is provided in figure 6.
Minor:
(1) Page 4:
"we refer to this as Visual-dominant Stimulus case 1, or VS1; Fig. 1a, top)." This should be Fig. 2a.
(2) "In stimulus condition VS1, all of the models were able to learn to use the auditory clues to disambiguate the images (Fig. 2c)."
This should be Fig. 2b.
(3) "In comparison, in VS2, we found that the brainlike model learned to ignore distracting audio inputs quickly and consistently compared to the random models, and a bit more rapidly than the auditory information (Fig 2d)."
This should be Fig. 2c.
(4) "VS3; Fig. 2b, top"
This should be Fig. 2d
(5) "while all other models had to learn to do so further along in training (Fig. 2e)."
It is not stated explicitly, but this suggests that the image-aligned target was considered correct, and that weight updates were happening.
(6) "VS4; Fig. 2b, bottom"
This should be Fig. 2f
(7) "adept at learning (Fig. 2f)."
This should be Fig. 2g
(8) Figure 3:b,c,e y-labels are missing
3f: both x and y labels are missing
(9) Figure labeling in the text is not consistent (Fig. 1A versus Fig. 2a)
(10) Doubled "the" in ""This shows that the inductive bias towards vision in the brainlike model depended on the presence of the multiplicative component of the the feedback"
(11) Page 9 Figure 6: The caption says b shows the latent spaces for the VS2 task, whereas the main text refers to 6b as showing the latent space for the AS2 task. Please correct which task it is.
(12) Methods 4.1 page 13
"which is derived from the feedback input (h_{l−1})"
This should be h_{l+1}
(13) r_l, u_l, u and c are not defined to which aspects of the model they refer to
Even though this is based on a previous model, the methods section should completely describe the model.
Equations 1,2,3: the notation [x;y] is unclear and should be defined.
Equation 5: u should probably be u_l.
(14) Page 14 typo: externopyrmidisation.
(15) It is confusing to use different names for the same thing: the all-feedforward model, the all feedforward network, the feedforward network, and the feedforward-only model are probably all the same? Consistent naming would help here.
Thank you for the detailed comments! We’ve fixed the minor errors and renamed the feedforward models to drive-only models.
Author response:
The following is the authors’ response to the original reviews.
Public Reviews:
Reviewer #1 (Public review):
Authors state, "we identified ETF dehydrogenase (ETFDH) as one of the most dispensable metabolic genes in neoplasia." Surely there are thousands of genes that are dispensable for neoplasia. Perhaps the authors can revise this sentence and similar sentiments in the text.
We agree with the reviewer and have corrected the text accordingly. Specifically, we rephrased the sentence: “Surprisingly, we observed that in contrast to muscle, ETFDH is one of the most non-essential metabolic genes in cancer cells.” to “Surprisingly, we observed that in contrast to muscle, ETFDH is a non-essential gene in acute lymphoblastic leukemia NALM-6 cells”
Authors state, "These findings show that ETFDH loss elevates glutamine utilization in the CAC to support mitochondrial metabolism." While elevated glutamine to CAC flux is consistent with the statement that increased glutamine, the authors have not measured the effect of restoring glutamine utilization to baseline on mitochondrial metabolism. Thus, the causality implied by the authors can only be inferred based on the data presented. Indeed, the increased glutamine consumption may be linked to the increase in ROS, as glutamate efflux via system xCT is a major determinant of glutamine catabolism in vitro.
Indeed. We changed the statement "These findings show that ETFDH loss elevates glutamine utilization in the CAC to support mitochondrial metabolism." to "Collectively, these data demonstrate that ETF insufficiency in cancer cells remodels mitochondrial metabolism and increases the glutamine consumption and anaplerosis."
Authors state that the mechanism described is an example of "retrograde signaling". However, the mechanism seems to be related to a reduction in BCAA catabolism, suggesting that the observed effects may be a consequence of altered metabolic flux rather than a direct signaling pathway. The data presented do not delineate whether the observed effects stem from disrupted mitochondrial communication or from shifts in nutrient availability and metabolic regulation.
Notwithstanding that the term “retrograde” was used to refer to signaling from mitochondria to mTORC1, rather than from mTORC1 to mitochondria [1], we have removed the term “retrograde signaling” throughout the manuscript.
The authors should discuss which amino acids that are ETFDH substrates might affect mTORC1 activity or consider whether other ETFDH substrates might also affect mTORC1 in their discussion. Along these lines, the authors might consider discussing why amino acids that are not ETFDH substrates are increased upon ETFDH loss.
Based on the literature, we expect that branched chain amino acids that are ETFDH substrates (e.g., leucine) are likely to play a major role in activating mTORC1 upon ETFDH abrogation. As expected, the aforementioned amino acids are among those that are the most highly upregulated in ETFDH deficient cells (Fig 3A). We have, however, never formally tested the role of branched chain amino acid in activating mTORC1 in the context of ETFDH disruption. The increase in amino acids that are not metabolized via ETFDH, is likely to stem from global metabolic rewiring of ETFDH-deficient cells and observed alterations in amino acid uptake (e.g., glutamine; Fig 2F). We discuss this in the revised version of the paper as follows:
“Several metabolites can be sensed via signaling partners upstream of mTORC1, including leucine, arginine, methionine/SAM, and threonine [2]. Branched-chain amino acids (leucine, isoleucine, and valine), which are among the highest upregulated metabolites in ETFDH deficient cells (Fig 3A) serve as ETFDH substrates, and have been described to display strong activation capabilities towards mTORC1 in the literature [3,4]. Glutamine can also activate mTORC1 through Arf family of GTPases [5]. Indeed, glutamine can supplement the non-essential amino acid (NEAA) pool through transamination [6] and amino acid uptake [7]. Accordingly, the maintenance of NEAA that are non-ETFDH substrates may be supported by the global metabolic rewiring fueled by enhanced glutamine metabolism in ETFDH-deficient cells. Deciphering the mechanisms leading to accumulation of specific amino acids and their role in ETFDH-dependent mTORC1 modulation is warranted.”
Reviewer #2 (Public review):
The authors would strengthen the paper considerably by adding back catalytically inactive ETFDH to show that the activity of this enzyme is responsible for the increased growth phenotypes and changes in labeling that they observe.
Based on the Reviewers’ suggestions we performed these experiments. Herein, we took advantage of Y304A/G306E ETFDH mutant that impairs electron transfer from ETF and cannot substitute for the wild type (WT) gene function in ETFDH-deficient myoblasts [8]. We expressed WT and Y304A/G306E ETFDH mutant in ETFDH KO HCT116 colorectal cancer cells and confirmed that they are expressed to a comparable level (Supplementary Figure 6C). Re-expression of WT decreased proliferation, while suppressing mTORC1 signaling and increasing 4E-BP1 levels relative to control (vector infected) ETFDH KO EV HCT116 cells (Supplementary Figure 6D). In contrast, proliferation rates, mTORC1 signaling and 4E-BP1 levels remained largely unchanged upon Y304A/G306E ETFDH mutant expression in ETFDH KO HCT116 cells (Supplementary Figure 6D). Similarly, re-expression of WT ETFDH disrupted the bioenergetic phenotype associated with ETFDH loss, in contrast to re-expression of Y304A/G306E ETFDH mutant, which exhibited similar bioenergetic profiles as ETFDH KO control (Supplementary Figure 6E-F). Collectively these findings argue that the ETFDH activity is required for its tumor suppressive effects.
If nucleotide pool and labeling data are available, or can be obtained readily, this would significantly strengthen the tracing data already obtained.
We followed Reviewer’s suggestion and measured nucleotide levels. This revealed that loss of ETFDH results in increase in steady-state nucleotide pools (Supplementary Figure 2K), consistent with increased aspartate labelling and accelerated tumor growth.
References
(1) Morita, M. et al. mTORC1 controls mitochondrial activity and biogenesis through 4EBP-dependent translational regulation. Cell Metab 18, 698-711 (2013). https://doi.org/10.1016/j.cmet.2013.10.001
(2) Valenstein, M. L. et al. Structural basis for the dynamic regulation of mTORC1 by amino acids. Nature 646, 493-500 (2025). https://doi.org/10.1038/s41586-025-09428-7
(3) Appuhamy, J. A., Knoebel, N. A., Nayananjalie, W. A., Escobar, J., & Hanigan, M. D. Isoleucine and leucine independently regulate mTOR signaling and protein synthesis in MAC-T cells and bovine mammary tissue slices. J Nutr 142, 484-491 (2012). https://doi.org/10.3945/jn.111.152595
(4) Herningtyas, E. H. et al. Branched-chain amino acids and arginine suppress MaFbx/atrogin-1 mRNA expression via mTOR pathway in C2C12 cell line. Biochim Biophys Acta 1780, 1115-1120 (2008). https://doi.org/10.1016/j.bbagen.2008.06.004
(5) Jewell, J. L. et al. Metabolism. Differential regulation of mTORC1 by leucine and glutamine. Science 347, 194-198 (2015). https://doi.org/10.1126/science.1259472
(6) Tan, H. W. S., Sim, A. Y. L. & Long, Y. C. Glutamine metabolism regulates autophagy-dependent mTORC1 reactivation during amino acid starvation. Nat Commun 8, 338 (2017). https://doi.org/10.1038/s41467-017-00369-y
(7) Chen, R. et al. The general amino acid control pathway regulates mTOR and autophagy during serum/glutamine starvation. J Cell Biol 206, 173-182 (2014).https://doi.org/10.1083/jcb.201403009
(8) Herrero Martin, J. C. et al. An ETFDH-driven metabolon supports OXPHOS efficiency in skeletal muscle by regulating coenzyme Q homeostasis. Nat Metab 6, 209-225 (2024). https://doi.org/10.1038/s42255-023-00956-y
Author response:
The following is the authors’ response to the original reviews.
Public reviews:
Reviewer #1 (Public review):
Summary:
Schafer et al. tested whether the hippocampus tracks social interactions as sequences of neural states within an abstract social space defined by dimensions of affiliation and power, using a task in which participants engaged in narrative-based social interactions. The findings of this study revealed that individual social relationships are represented by unique sequences of hippocampal activity patterns. These neural trajectories corresponded to the history of trial-to-trial affiliation and power dynamics between participants and each character, suggesting an extended role of the hippocampus in encoding sequences of events beyond spatial relationships.
The current version has limited information on details in decoding and clustering analyses which can be improved in the future revision.
Strengths:
(1) Robust Analysis: The research combined representational similarity analysis with manifold analyses, enhancing the robustness of the findings and the interpretation of the hippocampus's role in social cognition.
(2) Replicability: The study included two independent samples, which strengthens the generalizability and reliability of the results.
Weaknesses:
I appreciate the authors for utilizing contemporary machine-learning techniques to analyze neuroimaging data and examine the intricacies of human cognition. However, the manuscript would benefit from a more detailed explanation of the rationale behind the selection of each method and a thorough description of the validation procedures. Such clarifications are essential to understand the true impact of the research. Moreover, refining these areas will broaden the manuscript's accessibility to a diverse audience.
We thank the reviewer for these comments and have addressed them in various ways.
First, we removed the spline-based decoding and spectral clustering analyses. As we detail in our response to the recommendations, these approaches were complex and raised legitimate interpretational concerns, making it unclear how they supported our core claims. The revised manuscript now focuses on a set of representational similarity analyses to show representations consistent with social dimension similarity (affiliation vs. power decision trials) and social location similarity (trajectory/map-like coding based on participant choices).
Second, we expanded the Methods and Results to more clearly explain the analyses, the questions they address, and associated controls and robustness tests. The dimension similarity analysis tests whether hippocampal patterns differentiate affiliation and power decisions in a way consistent with an abstract dimension representation. The location similarity RSAs test whether within-character neural pattern distances scale with Euclidean distance in social space (relationship-specific trajectories), and whether pattern distances across all characters scale with location distances when distances are globally standardized, consistent with a shared map-like coordinate system.
Third, we emphasize new controls. For the dimension similarity RSA, we test for potential confounds such as word count, text sentiment, and reaction time differences between affiliation and power trials. For the location similarity RSA, we control for temporal distance between trials and show (in the Supplement) that the reported effects cannot be explained by temporal autocorrelation in the fMRI data or by the relationship between temporal distance and behavioral location distance.
We believe that these changes address the reviewer’s request for clearer rationale and validation.
Reviewer #2 (Public review):
Summary:
Using an innovative task design and analysis approach, the authors set out to show that the activity patterns in the hippocampus related to the development of social relationships with multiple partners in a virtual game. While I found the paper highly interesting (and would be thrilled if the claims made in the paper turned out to be true), I found many of the analyses presented either unconvincing or slightly unconnected to the claims that they were supposed to support. I very much hope the authors can alleviate these concerns in a revision of the paper.
Strengths & Weaknesses:
(1) The innovative task design and analyses, and the two independent samples of participants are clear strengths of the paper.
We thank the reviewer for this comment.
(2) The RSA analysis is not what I expected after I read the abstract and tile of the result section "The hippocampus represents abstract dimensions of affiliation and power". To me, the title suggests that the hippocampus has voxel patterns, which could be read out by a downstream area to infer the affiliation and power value, independent of the exact identity of the character in the current trial. The presented RSA analysis however presents something entirely different - namely that the affiliation trials and power trials elicit different activity patterns in the area indicated in Figure 3. What is the meaning of this analysis? It is not clear to me what is being "decoded" here and alternative explanations have not been considered. How do affiliation and power trials differ in terms of the length of sentences, complexity of the statements, and reaction time? Can the subsequent decision be decoded from these areas? I hope in the revision the authors can test these ideas - and also explain how the current RSA analysis relates to a representation of the "dimensions of affiliation and power".
We agree that this analysis needed to be better justified and explained. We have revised the text to clarify that by “represents the interaction decision trials along abstract social dimensions” we mean that hippocampal multivoxel patterns differentiate affiliation and power decisions in a way consistent with the conceptual framework of underlying latent dimensions. The analysis tests one simple prediction of this view – that on average these trial types are separable in the neural patterns. We have added details to the Methods, showing how the affiliation and power trials do not differ in word count or in sentiment, but do differ in their semantics, as assessed by a Large Language Model, as we expect from our task assumptions. Thanks to the reviewer’s comment, we also tested for and found a reaction time difference between affiliation and power trials, that we now control for.
(3) Overall, I found that the paper was missing some more fundamental and simpler RSA analyses that would provide a necessary backdrop for the more complicated analyses that followed. Can you decode character identity from the regions in question? If you trained a simple decoder for power and affiliation values (using the LLE, but without consideration of the sequential position as used in the spline analysis), could you predict left-out trials? Are affiliation and power represented in a way that is consistent across participants - i.e. could you train a model that predicts affiliation and power from N-1 subjects and then predict the Nth subject? Even if the answer to these questions is "no", I believe that they are important to report for the reader to get a full understanding of the nature of the neural representations in these areas. If the claim is that the hippocampus represents an "abstract" relationship space, then I think it is important to show that these representations hold across relationships. Otherwise, the claim needs to be adjusted to say that it is a representation of a relationship-specific trajectory, but not an abstract social space.
We appreciate this comment and agree on the value of clear, conceptually simple analyses. To address this concern, we have simplified our main analysis significantly by removing the spline-based analysis and substituting it with a multiple regression representational similarity analysis approach. We test whether within-character neural pattern distances scale with distance in social space (relationship-specific trajectories), and whether pattern distances across all characters scale with location distances when distances are globally standardized. We find evidence for both, consistent with a shared map-like coordinate system.
We agree that decoding character identity and an across-participant decoding approach could be informative. However, our current task is not well designed for such analyses and as such would complicate the paper. Although we agree that these questions are interesting, they would test questions that are outside the scope of this paper.
(4) To determine that the location of a specific character can be decoded from the hippocampal activity patterns, the authors use a sequential analysis in a lowdimensional space (using local linear embedding). In essence, each trial is decoded by finding the pair of two temporally sequential trials that is closest to this pattern, and then interpolating the power/affiliation values linearly between these two points. The obvious problem with this analysis is that fMRI pattern will have temporal autocorrelation and the power and affiliation values have temporal autocorrelation. Successful decoding could just reflect this smoothness in both time series. The authors present a series of control analyses, but I found most of them to not be incisive or convincing and I believe that they (and their explanation of their rationale) need to be improved. For example, the circular shifting of the patterns preserves some of the autocorrelation of the time series - but not entirely. In the shifted patterns, the first and last items are considered to be neighboring and used in the evaluation, which alone could explain the poor performance. The simplest way that I can see is to also connect the first and last item in a circular fashion, even when evaluating the veridical ordering. The only really convincing control condition I found was the generation of new sequences for every character by shuffling the sequence of choices and re-creating new artificial trajectories with the same start and endpoint. This analysis performs much better than chance (circular shuffling), suggesting to me that a lot of the observed decoding accuracy is indeed simply caused by the temporal smoothness of both time series.
We thank the reviewer for emphasizing this important concern; we agree that we did not sufficiently address this in the initial submission. This concern is one main reason we removed the spline-based analysis and now use regression-based representational similarity analyses in its place. In the revision, we report autocorrelation-related analyses in the supplement, and via controls and additional analysis show that temporal distance (or its square) cannot explain the location-like effects. This substantially improves our ability to interpret the findings.
(5) Overall, I found the analysis of the brain-behavior correlation presented in Figure 5 unconvincing. First, the correlation is mostly driven by one individual with a large network size and a 6.5 cluster. I suspect that the exclusion of this individual would lead to the correlation losing significance. Secondly, the neural measure used for this analysis (determining the number of optimal clusters that maximize the overlap between neural clustering and behavioral clustering) is new, non-validated, and disconnected from all the analyses that had been reported previously. The authors need to forgive me for saying so, but at this point of the paper, would it not be much more obvious to use the decoding accuracy for power and affiliation from the main model used in the paper thus far? Does this correlate? Another obvious candidate would be the decoding accuracy for character identity or the size of the region that encodes affiliation and power. Given the plethora of candidate neural measures, I would appreciate if the authors reported the other neural measures that were tried (and that did not correlate). One way to address this would have been to select the method on the initial sample and then test it on the validation sample - unfortunately, the measure was not pre-registered before the validation sample was collected. It seems that the correlation was only found and reported on the validation sample?
We agree that this analysis was too complicated and under constrained, and thus not convincing. We think that removing this cluster-based analysis is the most conservative response to the reviewer’s concerns and have removed it from the revised paper.
Recommendations to the authors:
Reviewer #1 (Recommendations for the authors):
The manuscript's description of the shuffling analysis performed during decoding is currently ambiguous, particularly concerning the control variables. This ambiguity is present only in the Figure 4 legends and requires a more detailed explanation within the methods section. It is essential to clarify whether the permutation process was conducted within each character's data set or across multiple characters' data sets. If permutations were confined to within-character data, the conclusion would be that the hippocampus encodes context-specific information rather than providing a twodimensional common space.
We thank the reviewer for this comment. We have now removed the spline analysis due to these and other problems and have replaced it with representational similarity analyses that are both more rigorous and easier to interpret. We think these analyses allow us to make the claim that the characters are represented in a common space.
In the methods, we explain the analyses (page 23-24, lines 475-500):
“We also expected the hippocampus to represent the different characters’ changing social locations, which are implicit in the participant’s choices. We used multiple regression searchlight RSA to test whether hippocampal pattern dissimilarity increases with social location distance, based on participant-specific trial-wise beta images where boxcar regressors spanned each trial’s reaction time.”
“We ran two complementary regression analyses to address two related questions. First, we asked whether the hippocampus represents how a specific relationship changes over time. For this analysis, for each participant and each searchlight, we computed character-specific (i.e., only for same character trial pairs) correlation distances between trial-wise beta patterns and Euclidean distances between the social location behavioral coordinates. Distances were zscored within character trial pairs to isolate character-specific changes. The second analysis asked whether the there is a common map-like representation, where all trials, regardless of relationship, are represented in a shared coordinate system. Here, we included all trial pairs and z-scored the distances globally. For both regression analyses, we included control distances to control for possible confounds. To account for generic time-related changes, we controlled for absolute scan-time difference, as this correlated with location distance across participants (see Temporal autocorrelation of hippocampal beta patterns in the supplement). Although the square of this temporal distance did not explain any additional variance in behavioral distances, we ran a robustness analysis including both temporal distance and its square and saw qualitatively the same clusters with similar effect sizes. As such, we report the main analysis only. We included binary dimension difference (0 = trial pairs of different dimension, 1 = trials pairs of the same dimension), to ensure effects could not be explained by dimension-related effects. In the group-level model, we controlled for sample and the average reaction time between affiliation and power decisions.”
In the results, we describe the results and our interpretation (pages 11-12, lines 185208):
“We have shown that the left hippocampus represents the affiliation and power trials differently, consistent with an abstract dimensional representation. Does it also represent the changing social coordinates of each character? To test this, we multiple-regression RSA searchlight to test whether left hippocampus patterns represent the characters’ changing social locations across interactions (see Figure 3). We restricted the distances to those from trial pairs from the same character and standardized the distances within character (see Figure 3BD). We controlled for temporal distance to ensure the effect was not explainable by the time between trials, and for whether the trials shared the same underlying dimension (affiliation or power; see Location similarity searchlight analyses for more details). At the group level, we controlled for sample and the average reaction time difference between affiliation and power trials. Using the same testing logic as the dimensionality similarity analysis, we first tested our hypothesis in the bilateral hippocampus and found widespread effects in both the left (peak voxel MNI x/y/z = -35/-22/-15, cluster extent = 1470 voxels) and right (peak voxel MNI x/y/z = 37/-19/-14, cluster extent = 1953 voxels) hemispheres. The whole-brain searchlight analysis revealed additional clusters in the left putamen (-27/-3/14, cluster extent = 131 voxels) and left posterior cingulate cortex (-10/-28/41, cluster extent = 304 voxels).”
“We then asked a second, complementary question: does the hippocampus represent all interactions, across characters, within a shared map? To test for this map-like structure, we repeated the analysis but now included all trial pairs, z-scoring distances globally rather than within character (Figure 3E-F). The remainder of the procedure followed the same logic as the preceding analysis. The hippocampus analysis revealed an extensive right hippocampal cluster (27/27/-14, cluster extent = 1667 voxels). The whole-brain analysis did not show any significant clusters.”
We also describe the results in the discussion (page 12, lines 220-226):
“Then, we show that the hippocampus tracks the changing social locations (affiliation and power coordinates), above and beyond the effects of dimension or time; the hippocampus seemed to reflect both the changing within-character locations, tracking their locations over time, and locations across characters, as if in a shared map. Thus, these results suggest that the hippocampus does not just encode static character-related representations but rather tracks relationship changes in terms of underlying affiliation and power.”
The manuscript's description of the decoding analysis is unclear regarding the variability of the decoded positions. The authors appear to decode the position of a character along a spline, which raises the question of whether this position correlates with time, since characters are more likely to be located further from the center in later trials. There is a concern that the decoded position may not solely reflect the hippocampal encoding of spatial location, but could also be influenced by an inherent temporal association. Given that a character's position at time t is likely to be similar to its positions at t−1 and t+1, it is crucial that the authors clearly articulate their approach to separating spatial representation from temporal autocorrelation. While this issue may have been addressed in the construction of the test set, the manuscript does not seem to adequately explain how such biases were mitigated in the training set.
We agree that temporal confounding needs to be better accounted for, as our claims depend on space-like signals being separable from time-like ones. We address this in several ways in the revised manuscript.
First, we emphasize that this is a narrative-based task, where temporal structure is relevant. As such, our analyses aim to demonstrate that effects go beyond simple temporal confounds, like trial order or time elapsed.
Despite the temporal structure to the task, the decisions for the same character are spaced in time, and interleaved with other characters’ decisions, reducing the chance that a simple temporal confound could explain trajectory-related effects. We now describe the task better in the revised methods (page 16, lines 314-318):
“All six characters’ decision trials are interleaved with one another and with narrative slides. On average, after a decision trial for a given character, participants view ~11 narrative slides and complete ~3 decisions for other characters before returning to that same character, such that each character’s choices are separated by an average of ~20 seconds (range 12 seconds to 10 min).”
To address temporal autocorrelation in the fMRI time series, we used SPM’s FAST algorithm. Briefly, FAST models temporal autocorrelation as a weighted combination of candidate correlation functions, using the best estimate to remove autocorrelated signal.
We also now report the temporal autocorrelation profile of the hippocampal beta series in the supplement, including (pages 29-31, lines 593-656):
“The Social Navigation Task is a narrative-based task, where the relationships with characters evolve over time; trial pairs that are close in time may have more similar fMRI patterns for reasons unrelated to social mapping (e.g., slow drift). It is important to account for the role of time in our analyses, to ensure effects go beyond simple temporal confounds, like the time between decision trials. To aid in this, we quantified how fMRI signals change over time using a pattern autocorrelation function across decision trial lags. We defined the left and right hippocampus and the left and right intracalcarine cortex using the HarvardOxford atlas and thresholded them at 50% probability. We chose intracalcarine corex as an early visual control region that largely corresponds to primary visual cortex (V1), as it is likely to be driven by the visually presented narrative. We used the same trial-wise beta images as in the location similarity RSA (boxcar regressors spanning each decision trial’s reaction time). For each participant and region-of-interest (ROI), we extracted the decision trial-by-voxel beta matrix and quantified three kinds of temporal dependence: beta autocorrelation, multivoxel pattern correlation and multivoxel pattern correlation after regressing out temporal distance.”
“To estimate the temporal autocorrelation of the trial-wise beta values, we treated each voxel’s beta values as a time series across trials and measured how much a voxel’s response on one trial correlated (Pearson) with its response on previous trials. We averaged these voxel wise autocorrelations within each ROI. At one trial apart (lag 1), both the hippocampus and V1 showed small positive autocorrelations, indicating modest trial-to-trial carryover in response amplitude (see Supplemental figure 1) that by three trials apart was approximately 0.”
“Because our representational similarity analyses depend on trial-by-trial pattern similarity, we also estimated how multivoxel patterns were autocorrelated over time. For each lag, we computed the Pearson correlation between each trial’s voxelwise pattern and the pattern from the trial that many trials earlier, then averaged those correlations to obtain a single autocorrelation value for that lag. At one trial apart, both regions showed positive autocorrelation, with V1 having greater autocorrelation than the hippocampus; pattern correlations between trials 3 or 4 trials apart reduced across participants, settling into low but positive values. Then, for each participant and ROI, we regressed out the effect of absolute trial onset differences from all pairwise pattern correlations, to mirror the effects of controlling for these temporal distances in regressions. After removing this temporal distance component, the short lag pattern autocorrelation dropped substantially in both regions. The similarity in autocorrelation profiles between the two regions suggests that significant similarity effects in the hippocampus are unlikely to be driven by generic temporal autocorrelation.”
“Relationship between behavioral location distance and temporal distance “
“We also quantified how temporal distances between trials relates to their behavioral location distances, participant by participant. Our dimension similarity analysis controls for temporal distance between trials by design (see Social dimension similarity searchlight analysis), but our location similarity analysis does not. To decide on covariates to include in the analysis, we tested whether temporal distances can explain behavioral location distances. For each participant, we computed the correlations between trial pairs’ Euclidean distances in social locations and their linear temporal distances (“linear”) and the temporal distances squared (“quadratic”), to test for nonlinear effects. We then summarized the correlations using one-sample t-tests. The linear relationship was statistically significant (t<sub>49</sub> = 12.24, p < 0.001), whereas the quadratic relationship was not (t<sub>49</sub> = -0.55, p = 0.586). Similarly, in participant specific regressions with both linear and quadratic temporal distances, the linear effect was significant (t<sub>49</sub> = 5.69, p < 0.001) whereas the quadratic effect was not (t<sub>49</sub> = 0.20, p = 0.84). Based on this, we included linear temporal distances as a covariate in our location similarity analyses (see Location similarity searchlight analyses), and verified that adding a quadratic temporal distance covariate does not alter the results. Thus, the reported location-related pattern similarity effects go beyond what can be explained by temporal distance alone.”
How the free parameter of spectral clustering was determined, if there is any?
The interpretation of the number of hippocampal activity clusters is ambiguous. It is suggested that this number could fluctuate due to unique activity patterns or the fit to behaviorally defined trajectories. A lower number of clusters might indicate either a noisier or less distinct representation, raising the question of the necessity and interpretability of such a complex analysis. This concern is compounded by the potential sensitivity of the clustering to the variance in Euclidean distances of each trial's position relative to the center. If a character's position is consistently near the center, this could artificially reduce the perceived number of clusters. Furthermore, the manuscript should address whether there is any correlation between the number of clusters and behavioral performance. Specifically, what are the implications if participants are able to perform the task adequately with a smaller number of distinct hippocampal representation states?
The rationale for conducting both cluster analysis and position decoding as separate analyses remains unclear. While cluster analysis can corroborate the findings of position decoding, it is not apparent why the authors chose to include trials across characters for cluster analysis but not for decoding analysis. An explanation of the reasoning behind this methodological divergence would help in understanding the distinct contributions of each analysis to the study's findings.
The paper by Cohen et al. (1997), which provides the questionnaire for measuring the social network index, is not cited in the references. Upon reviewing the questionnaire that the author may have used, it appears that the term "social network size" does not refer to the actual size but to a score or index derived from the questionnaire responses. It may be more appropriate to replace the term "size" with a different term to more accurately reflect this distinction.
Thank you for seeking these clarifications. Given the complexity of this analysis, we have decided to drop it to focus instead on our dimension and location representational similarity analysis results.
Reviewer #2 (Recommendations for the authors):
How did the participants' decisions on previous trials influence the future trials that the subjects saw? If the different participants were faced with different decision trials, then how did you compare their decision? If two participants made the same decisions, would they have seen exactly the same sequence of trials (see point X on how the trial sequence was randomized).
All participants experience the same narrative, with the same decisions (i.e., the same available options); their choices (i.e., the options they select) are what implicitly shape each character’s affiliation and power locations, and thus each character’s trajectory. In other words, the narrative is fixed; what changes is the social coordinates assigned to each trial’s outcome depending on the participant’s choice of how to interact from the two narrative options. This means that we can meaningfully compare participants' neural patterns, given that every participant received the same text and images throughout.
We have now added details on the narrative structure, replacing more ambiguous statements with a clearer description (page 16, lines 309-318):
“The sequence of trials, including both narrative and decision trials, were fixed across participants; all that differs are the choices that the participants make. Narrative trials varied in duration, depending on the content (range 2-10 seconds), but were identical across participants. Decision trials always lasted 12 seconds, with two options presented until the participant made a choice, after which a blank screen was presented for the remainder of the duration. All six characters’ decision trials are interleaved with one another, and with the narrative slides. On average, after a decision trial for a given character, participants view ~11 narrative slides and complete ~3 decisions for other characters before returning to another decision with the same character, such that each character’s choices are separated by an average of ~20 seconds (ranging from 12 seconds to 10 min).”
Figure 2B: I assume that "count" is "count of participants"? It would be good to indicate this on the axis/caption.
Thank you for noting this. We have now removed this figure to improve the clarity of our figures.
We have shown that the hippocampus represents the interaction decision trials along abstract social dimensions, but does it track each relationship's unique sequence of abstract social coordinates?". Please clarify what you mean by "represents the interaction decision trials”.
By “represents the interaction decision trials along abstract social dimensions”, we mean that when the participant makes a choice during the social interactions the hippocampal patterns represent the current social dimension of the choice (affiliation vs power). In other words, the hippocampal BOLD patterns differentiate affiliation and power decisions, consistent with our hypothesis of abstract social dimension representation in the hippocampus. We have clarified this (page 11, lines 185-187):
“We have shown that the left hippocampus represents the affiliation and power trials differently, consistent with an abstract dimensional representation.”
Page 8: "Hippocampal sequences are ordered like trajectories": It is not entirely clear to me what is meant by the split midpoint. Is this the midpoint of the piece-wise linear interpolation between two points, or simply the mean of all piecewise splines from one character? If the latter, is the null model the same as simply predicting the mean affiliation and power value for this character? If yes, please clarify and simplify this for the reader.
Page 8: "Hippocampal sequences track relationship-specific paths". First, I was misled by the "relationship-specific". I first understood this to mean that you wanted to test whether two relationships (i.e. the identity of the partner) had different representations in Hippocampus, even if the power/affiliation trajectories are the same. I suggest changing the title of this section.
The analysis in this section also breaks any temporal autocorrelation of measured patterns - so I am not sure if this is a strong analysis that should be interpreted at all. This analysis seems to not address the claim and conclusion that is drawn from it. I assume that the random trajectories have different choices and different affiliation/power values than the true trajectories. So the fact that the true trajectories can be better decoded simply shows that either choices or affiliation and power (or both) are represented in the neural code - but not necessarily anything beyond this.
Page 9: "Neural trajectories reflect social locations, not just choices". The motivation of this analysis is not clear to me. As I understand this analysis, both social location and choices are changed from the real trajectories. How can it then show that it reflects social locations, not just the choices?
Figure 4 caption: "on the -based approximation" Is there a missing "point"-[based] here?
We agree with the reviewer that this analysis is hard to interpret and does not adequately address concerns regarding temporal autocorrelation, and as such we have removed it from the manuscript. We describe the new results that include controlling for temporal distance between trials (pages 11-12, lines 185-208):
“We have shown that the left hippocampus represents the affiliation and power trials differently, consistent with an abstract dimensional representation. Does it also represent the changing social coordinates of each character? To test this, we multiple-regression RSA searchlight to test whether left hippocampus patterns represent the characters’ changing social locations across interactions (see Figure 3). We restricted the distances to those from trial pairs from the same character and standardized the distances within character (see Figure 3BD). We controlled for temporal distance to ensure the effect was not explainable by the time between trials, and for whether the trials shared the same underlying dimension (affiliation or power; see Location similarity searchlight analyses for more details). At the group level, we controlled for sample and the average reaction time difference between affiliation and power trials. Using the same testing logic as the dimensionality similarity analysis, we first tested our hypothesis in the bilateral hippocampus and found widespread effects in both the left (peak voxel MNI x/y/z = -35/-22/-15, cluster extent = 1470 voxels) and right (peak voxel MNI x/y/z = 37/-19/-14, cluster extent = 1953 voxels) hemispheres. The whole-brain searchlight analysis revealed additional clusters in the left putamen (-27/-3/14, cluster extent = 131 voxels) and left posterior cingulate cortex (-10/-28/41, cluster extent = 304 voxels).”
“We then asked a second, complementary question: does the hippocampus represent all interactions, across characters, within a shared map? To test for this map-like structure, we repeated the analysis but now included all trial pairs, z-scoring distances globally rather than within character (Figure 3E-F). The remainder of the procedure followed the same logic as the preceding analysis. The hippocampus analysis revealed an extensive right hippocampal cluster (27/27/-14, cluster extent = 1667 voxels). The whole-brain analysis did not show any significant clusters.”
We emphasize that the results are robust to the inclusion of temporal distance squared, in the methods (pages 23-24, lines 493-496):
“Although the square of this temporal distance did not explain any additional variance in behavioral distances, we ran a robustness analysis including both temporal distance and its square and saw qualitatively the same clusters with similar effect sizes.”
Page 8: last paragraph: The text sounds like you have already shown that you can decode character identity from the patterns - but I do not believe you have it this point. I would consider this would be an interesting addition to the paper, though.
This section has been removed, and we have been careful to not imply this in the current version of the manuscript. While we agree a character identity decoding would enrich our argument, we do not believe our task is well-suited to capture a character identity effect. Each character only has 12 decision trials, and these trials are partially clustered in time - this is one problem of temporal autocorrelation that we thank the reviewers for pushing us to consider in more detail. Dimension and location patterns, on the other hand, are more natural to analyze in our task, especially in representational similarity analyses that test whether the relevant differences scale with neural distances.
Page 14ff: Why is "Analysis section" not part of "Materials and Methods"? I believe adding the analysis after a careful description of the methods would improve the clarity of this section.
We agree with the reviewer and have now consolidated these two sections.
Two or three examples of Affiliation and Power decision trials should be provided, so the reader can form a more thorough understanding of how these dimensions were operationalized. For the RSA analysis, it is important to consider other differences between these two types of trials.
We agree that adding examples will clarify the operationalization of these dimensions. We now include example affiliation and power trials in a table (page 17-18).
We thank the reviewer for noting the need to rule out alternative hypotheses; we have added several such tests. Affiliation and power trials were not different in word count (page 17, lines 329-332):
“To ensure that any observed neural or behavioral differences were not confounded by trivial features of the text, we tested for differences between the affiliation and power trials (where the two options are concatenated). There were no differences in word count (affiliation average = 26.6, power average = 25.6; t-test p = 0.56).”
They were also not different in their sentiment, as assessed by a Large Language Model (LLM) analysis (page 17, lines 332-335):
“The text’s sentiment also did not differ between these trial types (t-test p = 0.72), as quantified by comparing sentiment compound scores (from most negative, −1, to most positive, +1), using a Large Language Model (LLM) specialized for sentiment analysis [26]. “
The affiliation and power trials were different in terms of semantic content, consistent with our assumptions (page 17, lines 337-347):
“Our framework assumes that affiliation and power trials differ in their semantic content–that is, in the conceptual meaning of the text, beyond word count or sentiment. To test this assumption, we used an LLM-based semantic embedding analysis. Each decision trial was embedded into a semantic vector. We then measured the cosine similarity between pairs of trials and calculated the difference between average within-dimension similarity (affiliation-affiliation and power-power comparisons) and average between-dimension similarity (affiliationpower comparisons) and assessed its statistical significance with permutation testing (1,000 shuffles of trial labels). As expected, decision trials of the same dimension were more similar to each other than trials of different dimension, across multiple LLMs (OpenAI’s text-embedding-3-small [27]: similarity difference = 0.041, p < 0.001; all-MiniLM-L12-v2 [28]: similarity difference = 0.032, p < 0.001).”
The affiliation and power trials were different in average reaction time. To control for this difference in the dimension RSA analysis, we added each participant’s absolute value reaction time difference between the trial types as a covariate. The results were nearly identical to what they were before. We updated the text to reflect this new control (page 23, lines 471-474):
“However, there was a significant difference in the average reaction time between affiliation and power decisions across participants (t<sub>49</sub> = 6.92, p < 0.001; affiliation mean = 4.92 seconds (s), power mean = 4.51 s), so we controlled for this in the group-level analysis.”
The exact implementation and timing of the behavioral tasks should be described better. How many narrative trials were intermixed with the decision trials? Which characters were they assigned to? How was the sequence of trials determined? Was it fixed across participants, or randomized?
We agree that additional details are helpful. In the Methods, we now describe this with more detail (page 16, lines 301-318):
“There are two types of trials: “narrative” trials where background information is provided or characters talk or take actions (a total of 154 trials), and “decision” trials where the participant makes decisions in one-on-one interactions with a character that can change the relationship with that character (a total of 63 trials). On each decision, participants used a button response box to select between the two options. The options (1 or 2, assigned to the index and middle fingers) choice directions (+/-1 arbitrary unit on the current dimension) were counterbalanced.”
“The sequence of trials, including both narrative and decision trials, were fixed across participants; all that differs are the choices that the participants make. Narrative trials varied in duration, depending on the content (range 2-10 seconds), but were identical across participants. Decision trials always lasted 12 seconds, with two options presented until the participant made a choice, after which a blank screen was presented for the remainder of the duration. All six characters’ decision trials are interleaved with one another, and with the narrative slides. On average, after a decision trial for a given character, participants view ~11 narrative slides and complete ~3 decisions for other characters before returning to another decision with the same character, such that each character’s choices are separated by an average of ~20 seconds (ranging from 12 seconds to 10 min).”
What is the exact timing of trials during fMRI acquisition - i.e. how long were the trials, what was the ITI, were there long phases of rest to determine the resting baseline? These are all important factors that will determine the covariance between regressors and should be reported carefully. Ideally, I would like to see the trial-by-trial temporal auto-correlation structure across beta-weights to be reported.
We thank the reviewer for asking for this clarification. We have added the following text to clarify the trial timing (page 16, lines 314-318):
“All six characters’ decision trials are interleaved with one another and with narrative slides. On average, after a decision trial for a given character, participants view ~11 narrative slides and complete ~3 decisions for other characters before returning to that same character, such that each character’s choices are separated by an average of ~20 seconds (range 12 seconds to 10 min).”
We now describe the temporal autocorrelation patterns in the supplement, including how we decided on how to control for temporal distance in representational similarity analyses (pages 29-31, lines 593-656):
“The Social Navigation Task is a narrative-based task, where the relationships with characters evolve over time; trial pairs that are close in time may have more similar fMRI patterns for reasons unrelated to social mapping (e.g., slow drift). It is important to account for the role of time in our analyses, to ensure effects go beyond simple temporal confounds, like the time between decision trials. To aid in this, we quantified how fMRI signals change over time using a pattern autocorrelation function across decision trial lags. We defined the left and right hippocampus and the left and right intracalcarine cortex using the HarvardOxford atlas and thresholded them at 50% probability. We chose intracalcarine corex as an early visual control region that largely corresponds to primary visual cortex (V1), as it is likely to be driven by the visually presented narrative. We used the same trial-wise beta images as in the location similarity RSA (boxcar regressors spanning each decision trial’s reaction time). For each participant and region-of-interest (ROI), we extracted the decision trial-by-voxel beta matrix and quantified three kinds of temporal dependence: beta autocorrelation, multivoxel pattern correlation and multivoxel pattern correlation after regressing out temporal distance.”
“To estimate the temporal autocorrelation of the trial-wise beta values, we treated each voxel’s beta values as a time series across trials and measured how much a voxel’s response on one trial correlated (Pearson) with its response on previous trials. We averaged these voxel wise autocorrelations within each ROI. At one trial apart (lag 1), both the hippocampus and V1 showed small positive autocorrelations, indicating modest trial-to-trial carryover in response amplitude (see Supplemental figure 1) that by three trials apart was approximately 0.”
“Because our representational similarity analyses depend on trial-by-trial pattern similarity, we also estimated how multivoxel patterns were autocorrelated over time. For each lag, we computed the Pearson correlation between each trial’s voxelwise pattern and the pattern from the trial that many trials earlier, then averaged those correlations to obtain a single autocorrelation value for that lag. At one trial apart, both regions showed positive autocorrelation, with V1 having greater autocorrelation than the hippocampus; pattern correlations between trials 3 or 4 trials apart reduced across participants, settling into low but positive values. Then, for each participant and ROI, we regressed out the effect of absolute trial onset differences from all pairwise pattern correlations, to mirror the effects of controlling for these temporal distances in regressions. After removing this temporal distance component, the short lag pattern autocorrelation dropped substantially in both regions. The similarity in autocorrelation profiles between the two regions suggests that significant similarity effects in the hippocampus are unlikely to be driven by generic temporal autocorrelation.”
“Relationship between behavioral location distance and temporal distance “
“We also quantified how temporal distances between trials relates to their behavioral location distances, participant by participant. Our dimension similarity analysis controls for temporal distance between trials by design (see Social dimension similarity searchlight analysis), but our location similarity analysis does not. To decide on covariates to include in the analysis, we tested whether temporal distances can explain behavioral location distances. For each participant, we computed the correlations between trial pairs’ Euclidean distances in social locations and their linear temporal distances (“linear”) and the temporal distances squared (“quadratic”), to test for nonlinear effects. We then summarized the correlations using one-sample t-tests. The linear relationship was statistically significant (t<sub>49</sub> = 12.24, p < 0.001), whereas the quadratic relationship was not (t<sub>49</sub> = -0.55, p = 0.586). Similarly, in participant specific regressions with both linear and quadratic temporal distances, the linear effect was significant (t<sub>49</sub> = 5.69, p < 0.001) whereas the quadratic effect was not (t<sub>49</sub> = 0.20, p = 0.84). Based on this, we included linear temporal distances as a covariate in our location similarity analyses (see Location similarity searchlight analyses), and verified that adding a quadratic temporal distance covariate does not alter the results. Thus, the reported location-related pattern similarity effects go beyond what can be explained by temporal distance alone.”
Peut-être un lien avec la fin de période CEE ?
autre possibilité : les études de marché mentionne que les PAC sont liées au cycle de construction immo. -> s'il y a un effet où certains équipements sont difficile à installer dans des logements anciens (ou inversement) = effet hétérogène de MP/de la crise immo 2022-
Briefing : Feuille de Route de l'Éducation Nationale pour les Droits et le Bien-être des Enfants
Ce document synthétise les axes stratégiques et les constats chiffrés présentés par Édouard Geffray, ministre de l'Éducation nationale, lors de son audition devant la délégation aux droits des enfants.
L'école y est définie par deux fonctions cardinales : instruire et protéger. Les priorités ministérielles s'articulent autour de trois piliers majeurs : la santé mentale des élèves, la lutte contre le harcèlement scolaire et la sécurisation des parcours pour les enfants les plus vulnérables (situation de handicap ou sous protection).
Le ministre souligne une situation alarmante de la santé mentale des jeunes, exacerbée par les usages numériques, et propose des mesures systémiques : déploiement du programme "Phare", interdiction du portable au lycée, et création d'un cadre de "scolarité protégée".
Malgré une baisse démographique drastique (un million d'élèves en moins d'ici 2029), le ministère affirme vouloir maintenir une trajectoire de recrutement pour les personnels médico-sociaux afin de répondre à l'explosion des besoins de détection et d'orientation.
--------------------------------------------------------------------------------
Le ministre place la santé mentale parmi ses trois priorités absolues, s'appuyant sur des indicateurs de détresse psychologique en forte hausse.
• Risques de dépression : 14 % des collégiens et 15 % des lycéens présentent un risque important.
• Idées suicidaires : 24 % des lycéens déclarent avoir eu des pensées suicidaires au cours des 12 derniers mois.
• Harcèlement : Environ 5 % des élèves (soit un élève par classe en moyenne) sont victimes de harcèlement chaque année.
• Urgences : Augmentation de 80 % des passages aux urgences pour intentions ou tentatives de suicide depuis la crise du COVID-19.
• Désanonymisation des questionnaires : Le questionnaire annuel de harcèlement (rempli du CE2 à la Terminale) permet désormais aux élèves de décliner leur identité en fin de document pour être recontactés par l'équipe enseignante.
• Formation des personnels : L'objectif est de former deux personnels "sentinelles" par établissement pour repérer et orienter les élèves. Actuellement, la moyenne est de 1,6 personnel formé.
• Dispositif "Coupe-file" : Un mécanisme est en cours de finalisation avec le ministère de la Santé pour garantir aux infirmiers et médecins scolaires une prise de rendez-vous rapide vers les Centres Médico-Psychologiques (CMP) ou la médecine de ville, évitant des délais d'attente de 3 à 6 mois.
• Arsenal répressif : La loi du 2 mars 2022 fait du harcèlement un délit. 10 000 affaires ont été enregistrées par les parquets depuis 2022. Le décret du 16 août 2023 permet désormais de changer d'école l'élève auteur de harcèlement ou de violences intentionnelles.
--------------------------------------------------------------------------------
L'école s'affirme comme le premier émetteur d'informations préoccupantes (IP) et d'articles 40 en France.
• Signalements : Le nombre d'informations préoccupantes émises par l'école est passé de 50 000 à 80 000 en deux ans. Un guide national de standardisation des alertes est en cours de publication.
• Circulaire "Scolarité Protégée" : Publiée prochainement, elle vise à garantir la continuité pédagogique des enfants confiés à l'Aide Sociale à l'Enfance (ASE), dont 70 % sortent actuellement du système sans diplôme. Elle prévoit :
◦ Un suivi individuel par les services départementaux (DASEN).
◦ Des appuis scolaires spécifiques pour éviter les ruptures liées aux changements de foyers ou de familles d'accueil.
◦ Un soutien renforcé à l'orientation et à l'estime de soi.
--------------------------------------------------------------------------------
Le ministre distingue les élèves "non accompagnés" (disposant d'une solution pédagogique mais attendant une aide humaine) des élèves "sans solution" (exclus du système faute de structure adaptée).
• De la compensation à l'accessibilité : Le ministère souhaite sortir d'un modèle basé uniquement sur l'aide humaine systématique (AESH) pour privilégier l'accessibilité pédagogique et matérielle. L'objectif est d'éviter "l'externalisation" du handicap à l'intérieur de la classe.
• Pôles d'Appui à la Scolarité (PAS) : Déployés pour favoriser l'intervention du médico-social directement dans les murs de l'école et fluidifier les parcours entre le milieu ordinaire et les structures spécialisées.
• Besoins : 42 000 élèves seraient encore en attente d'accompagnement après les vacances de la Toussaint, malgré la création de 1 200 postes d'AESH supplémentaires pour 2026.
--------------------------------------------------------------------------------
Le ministre défend une interdiction stricte du portable au lycée (prévue pour 2026), justifiée par des enjeux cognitifs et de santé publique :
• Corrélation scientifique : La dégradation psychique des élèves est proportionnelle à la consommation d'écrans (le risque de troubles anxio-dépressifs passe de 30 % à 60 % pour les gros utilisateurs).
• Conscience avant contenu : Le ministre souhaite rétablir une primauté de l'éducation aux risques numériques avant l'exposition massive aux contenus violents ou faux.
Éducation à la vie affective, relationnelle et sexuelle (EVARS)
• Obligation : Les trois séances annuelles sont présentées comme "non négociables", tant dans le public que dans le privé sous contrat.
• Constats : 15 % des filles et 12 % des garçons au collège déclarent avoir subi une forme de violence sexuelle.
• Déploiement : Au 31 décembre, 66 % des écoles et 48 % des collèges publics avaient réalisé au moins une séance.
• Formation des enseignants : Le ministère reconnaît la nécessité de protéger les personnels qui, étant parfois eux-mêmes d'anciennes victimes, pourraient subir des traumatismes en dispensant ces enseignements.
--------------------------------------------------------------------------------
Le système éducatif fait face à une chute démographique sans précédent :
• Données : Perte d'un million d'élèves entre 2019 et 2029 dans le premier degré. Une génération de 200 000 élèves "disparaît" tous les quatre ans.
• Ajustements : Le ministre justifie les suppressions de postes d'enseignants (4 000 prévus) par cette baisse, tout en souhaitant augmenter progressivement les effectifs médico-sociaux (300 à 500 postes par an) pour compenser l'explosion des besoins en santé mentale.
Le ministre admet que la carte actuelle, figée depuis 2015, est obsolète. Cependant, il refuse une révision avant 2027 pour deux raisons :
1. Technique : Le processus de concertation avec les collectivités et les syndicats nécessite 15 à 18 mois.
2. Démocratique : Il considère que ce débat doit appartenir à la prochaine échéance présidentielle et refuse de "figer" une carte qui s'imposerait au futur gouvernement.
Un adjoint à la médiatrice de l'Éducation nationale sera spécifiquement chargé de la protection de l'enfance. Sa mission sera de traiter les litiges entre scolaire et périscolaire pour assurer une sécurité "de la porte à la porte" et de produire un rapport annuel dédié à ces enjeux.
--------------------------------------------------------------------------------
| Indicateur | Donnée Statistique | | --- | --- | | Élèves victimes de harcèlement | 5 % (stable du CE2 à la Terminale) | | Lycéens avec idées suicidaires | 24 % | | Passage aux urgences (suicide) | \+ 80 % depuis le Covid | | Information préoccupantes (École) | 80 000 / an (en hausse de 30 000) | | Sortie de l'ASE sans diplôme | 70 % | | Couverture EVARS (Écoles) | 66 % (au 31/12) | | Élèves en attente d'AESH | 42 000 (Toussaint 2025) |
Note d'Information : Priorités de la Protection de l’Enfance et Justice des Mineurs
Ce document synthétise les orientations stratégiques et les réformes engagées par le ministère de la Justice pour renforcer la protection de l’enfance et moderniser la justice des mineurs.
Les points clés incluent :
• Urgence et Rapidité : Réduction des délais de jugement (passés de 18 mois à 8,7 mois en quatre ans) et création d'une ordonnance de protection provisoire permettant au procureur de statuer en 72 heures.
• Refonte du Placement : Fermeture des Centres Éducatifs Fermés (CEF) publics au profit des Unités de Placement de la Jeunesse et de l'Éducation (UJPE), mettant l'accent sur la continuité pédagogique (52 semaines/an).
• Moyens Humains Massifs : Création de 1 600 postes au ministère de la Justice, dont 50 nouveaux cabinets de juges des enfants en deux ans et 70 postes à la Protection Judiciaire de la Jeunesse (PJJ).
• Évolutions Législatives : Soutien à l'imprescriptibilité des crimes sexuels sur mineurs, à la présence obligatoire de l'avocat pour l'enfant, et volonté de réformer l'« excuse de minorité » pour les crimes les plus graves.
• Protection contre les Fléaux Modernes : Lutte contre la prostitution des mineurs (6 prostituées sur 10 sont mineures), interdiction des téléphones portables en centres de placement, et encadrement du protoxyde d'azote.
--------------------------------------------------------------------------------
L'accent est mis sur la nécessité d'une justice qui s'adapte au rythme de l'enfant.
• Ordonnance de protection provisoire : Un nouveau dispositif permet au procureur d'agir en 72 heures pour protéger immédiatement un mineur, avec des interdictions de contact et l'attribution provisoire du logement au parent protecteur.
Le juge dispose ensuite de 8 jours pour être saisi et de 15 jours pour statuer.
• Loi du 18 mars 2024 : Prévoit le retrait automatique de l'autorité parentale pour les parents condamnés pour crime ou violence sexuelle sur leur enfant, ainsi que l'élargissement de la suspension de l'exercice de cette autorité dès la mise en examen.
• Avocat pour l'enfant : Soutien à la présence obligatoire d'un avocat en assistance éducative.
Une expérimentation avec les barreaux est envisagée avant une généralisation législative.
• Unités d'Accueil Pédiatrique (UAPED) : Déploiement en cours sur tout le territoire pour améliorer le recueil de la parole et le soin des victimes.
• Chiens d'assistance judiciaire : Passage de 10 à une trentaine de chiens actuellement, avec un objectif de 100 chiens (un par département) d'ici un à deux ans pour apaiser les enfants lors des procédures.
--------------------------------------------------------------------------------
La doctrine ministérielle refuse l'opposition entre ces deux concepts.
• La sanction comme acte éducatif : « La sanction fait partie de l'éducation. La sanction toute seule n'est pas un but en soi [...] et une éducation sans aucun interdit mène au n'importe quoi. »
• Efficacité du Code de la Justice Pénale des Mineurs (CJPM) : Les délais entre les faits et la sanction ont été divisés par deux en quatre ans (8,7 mois en 2024 contre 18 mois en 2020).
Le constat sur les Centres Éducatifs Fermés (CEF) est jugé sévère : coût élevé (30 à 50 % de plus), taux de fugue identique aux centres classiques, et déshérence éducative (seulement 5 à 10 heures de cours par semaine).
• Création des UJPE : Ces nouvelles unités fusionnent les anciens foyers et les CEF pour garantir un parcours de reconstruction pédagogique.
• Recrutement de professeurs techniques : Réouverture d'un concours pour 40 professeurs dépendant directement du ministère de la Justice afin d'assurer 26 heures de cours par semaine, 52 semaines sur 52, y compris durant les vacances scolaires.
• Santé et Addictions : Recrutement de 60 infirmiers pour pallier les carences de soins psychiatriques et de prise en charge des addictions dans les centres de placement.
--------------------------------------------------------------------------------
Le budget de la Justice permet une hausse inédite des moyens humains :
• Magistrature : Création de 50 cabinets de juges des enfants supplémentaires en deux ans (notamment à Bobigny, Cambrai, Alès).
Actuellement, certains cabinets gèrent entre 400 et 500 dossiers.
• PJJ : Recréation de 70 postes, permettant de renforcer les effectifs là où ils baissaient depuis 20 ans (ex: Marseille, Île-de-France).
• Milieu Ouvert : Réaffectation de 150 éducateurs vers le milieu ouvert pour ramener la charge de travail à environ 23 dossiers par agent (contre 25 auparavant).
Le système actuel est jugé trop fragmenté (plusieurs ministères concernés, compétences partagées avec les départements pour l'ASE).
Une volonté de meilleure coordination, voire d'unité de responsabilité, est exprimée.
--------------------------------------------------------------------------------
• Fin de la prescription : Avis favorable pour l'imprescriptibilité des crimes sexuels sur mineurs, ainsi que pour les crimes de sang (assassinats).
• Prostitution des mineurs : Un constat alarmant montre que 60 % des prostituées en France sont mineures.
Des unités dédiées au sein de la PJJ sont opérationnelles depuis trois mois pour lutter contre ce fléau et les réseaux de proxénétisme.
• Interdiction des téléphones : La nouvelle circulaire de politique éducative et pénale impose l'interdiction des téléphones portables dans les chambres des centres de placement pour protéger les mineurs des prédations numériques (trafiquants, proxénètes).
• Protoxyde d'azote : Soutien à la pénalisation du transport et de l'achat en ligne (en dehors du cadre médical), alors que les intoxications ont triplé entre 2020 et 2023.
• Excuse de minorité : Position favorable à la fin de l'automatisme de l'atténuation de peine pour les crimes les plus graves (assassinats, tortures) commis par des mineurs de 13 à 15 ans.
Cela nécessiterait une évolution constitutionnelle tout en préservant la spécialisation du jugement des mineurs.
--------------------------------------------------------------------------------
| Indicateur | Donnée Source | | --- | --- | | Délai moyen de jugement (2020) | 18 mois | | Délai moyen de jugement (2024) | 8,7 mois | | Dossiers par cabinet de juge des enfants | 400 à 500 (moyenne) | | Proportion de mineurs parmi les prostitués | 60 % | | Nombre de mineurs à l'ASE | 400 000 (dont 200 000 placés) | | Heures de cours en CEF | < 10h/semaine (contre 26h en milieu classique) | | Placements chez des tiers de confiance | < 9 % (19 000 jeunes) |
--------------------------------------------------------------------------------
« L'enfant ne vit pas au rythme d'un dossier administratif ou d'un dossier judiciaire. [...] 4 mois pour un mineur c'est une vie. »
« Nous devrions pouvoir en grande partie avoir honte de la façon dont on traite une partie de ces enfants notamment à l'aide sociale à l'enfance. »
« Le placement doit protéger et pas rendre encore plus vulnérable. »
« La sanction fait partie de l'éducation. [...] Une éducation sans jamais aucun interdit mène au n'importe quoi. »
Me interesa especialmente la reflexión de Krysinski sobre el principio del montaje en la novela moderna debido a que refleja algunos rasgos característicos de la novelística de Julieta Campos. Dentro de dicho principio subsiste el dialogismo, aunque tal vez se oriente más hacia lo dialéctico que hacia lo propiamente dialógico. El montaje implica la organización individual del discurso y su función sería la de producir un impacto cognitivo, una «toma de conciencia». Adquiere especial relieve el metadiscurso cognitivo del narrador, quien manipula las formas, las voces, los discursos, las narraciones, lo mismo que las estructuras para-literarias. Pueden formar parte del montaje todo tipo de materiales: históricos, citas de periódicos, comentarios, etc. El autor asume la función de compilador y su papel es el de estimular un efecto dialéctico mediante la manifestación de las estructuras puestas en juego. Por otra parte, la importancia del diálogo en la novela moderna se debe a que el narrador busca auto-expresarse, auto-comunicarse y auto-conocerse.
¿Quién es Krysinski? ¿Qué entiendes por dialogismo? ¿Qué entiendes por dialógico? ¿Qué diferencia encuentras entre los dos?
In random moments, you find yourself wondering if you should just burn it all to the ground and start over.
I would make this bolder - on first read I'm thinking that I would maybe even make this the header because it's very striking and head-nod-y
In this article, Star and Griesemer analyze the formative years of the Museum of Vertebrate Zoology by expanding the model of interessement developed by Latour and Callon, to form their concept of boundary objects
¿Podría esto tener relación con la teoría del actor-Red y la agencia de los objetos? "Actantes"
She was also known for developing the concept of boundary objects
Los objetos frontera son artefactos flexibles, compartidos, que permiten la colaboración entre grupos sociales y comunidades. Ejs: repositorios, mapas, planos,
Star and Griesmer initially defined boundary objects as “objects which are both plastic enough to adapt to local needs and the constraints of the several parties employing them, yet robust enough to maintain a common identity across sites...The objects may by abstract or concrete.
Objetos circundantes, potente concepto para anclar y reconectar el patrimonio material e inmaterial
While doing research with Carl Hewitt about the scientific community's decision-making process as a metaphor for artificial intelligence
Esto se conecta con el texto de Pasquineli: la genealogía de la IA y la inteligencia comunitaria o social
She taught a variety of subjects including: social analysis of technology and organizations, computers and society, research methods and gender and technology.
En el tema de género y tecnología, me pregunto si habrá considerado cuáles son las características de una tecnología feminista. Desde mi apreciación, la preoucpación por la materialidad del la infraestructura, sus usos y contextos puede ser profundamente feminista y quizás prefiguró mucho de ese campo
where she co-founded an organic commune
Interesante la coherencia entre la vida cotidiana/material y sus ideas
Cuáles horas de clase no son populares en tu universidad y cuáles horas de clase son populares?
8 - 4
¿Qué días y a qué hora son las clases de cultura? ¿Son iguales o diferentes?
El arte moderno de España (Tuesday and Thursday, 09:00-11:00) and La historia de España (Monday and Wednesday, 12:00-14:00). * sis: El cine en español (Monday and Wednesday, 16:00-18:00). * teammate: La música de España (Tuesday and Thursday, 12:00-14:00).
Miércoles
La historia, La música, El cine, La geografía y cultura
Lunes
historia , musica, espanol, la geografia y cultura
¿Y tú? ¿En qué fechas/estación deseas estudiar y en qué país? ¿Qué clases tomas?
Me gustaría estudiar negocios durante 4 años y luego, con suerte, iniciar un negocio en el oeste.
se desarrolla un "oficio de escribir" (Havelock,1963; cfr. Havelock y Herschell, 1978). En esta etapa, la escritura es un oficio ejercidopor quienes saben escribir, a quienes otros contratan para escribir una carta odocumento, igual que cuando contrataban un albañil para construir una casa o uncarpintero para fabricar un barco.
Se comienza a desarrollar el oficio de escribir que eran personas contratadas para ofrecer este servicio
Las tecnologías son artificiales, pero, —otra paradoja— lo artificial es naturalpara los seres humanos. Interiorizada adecuadamente, la tecnología no degrada lavida humana sino por lo contrario, la mejora. La orquesta moderna, por ejemplo,constituye el resultado de una compleja tecnología. Un violín es un instrumento, osea, una herramienta.
Porque lo que hace la tecnología es mejorar la vida humana. Si pensamos en una orquesta es una tecnologia compleja que tiene diversas herramientas como los instrumentos por ejemplo el órgano o el violín.
Una reflexión propia: Es que mejora la vida humana porque permite especializarse en los conocimientos especificos, por ejemplo, el uso del piano donde la persona va desarrollando habilidades que le permiten tocar mejor el instrumento y volverse un experto con esa tecnología, llegando a convertirse en un medio o método de trabajo. Lo que no pasaría sino existieran estas tecnologías porque tendriamos que hacer los sonidos directamente con nuestros cuerpos y eso nos podría dar esa especie de libertad creativa infinita porque el ser humano tiene la capacidad de crear cosas que no están establecidas, mientras que lo que nos aporta la tecnologia puede llegar a tener un limite en nuestro proceso creativo, pero que nos va a llevar a convertirnos en expertos.
Afirmar que la escritura es artificial no significa condenarla sino elogiarla.Como otras creaciones artificiales y, en efecto, más que cualquier otra, tiene un valorinestimable y de hecho esencial para la realización de aptitudes humanas másptenas, interiores. Las tecnologías no son sólo recursos externos, sino tambiéntransformaciones interiores de la conciencia, y mucho más cuando afectan lapalabra. Tales transformaciones pueden resultar estimulantes. La escritura da vigora la conciencia. La alienación de un medio natural puede beneficiarnos y, de hecho,en muchos sentidos resulta esencial para una vida humana plena. Para vivir ycomprender totalmente, no necesitamos sólo la proximidad, sino también ladistancia. Y esto es lo que la escritura aporta a la conciencia como nada más puedehacerlo.
La escritura como tecnología no deberiamos condenarla menciona el autor sino elogiarla, porque esta nos permite tener un valor inestimable y esencial para la realización de las aptitudes humanas. No sólo son recursos externos sino transformaciones interiores de la conciencia, y mucho más cuando afectan la palabra.
No necesitamos la proximidad sino la distancia, y esto es lo que nos aporta la escritura de la conciencia, comprendo que: - La proximidad es el ejercicio de acercarnos más al conocimiento, profundizando en las temáticas y llegando a conclusiones más complejas. Y tener un número ilimitado de pensamientos. - La distancia es el ejercicio de reflexionar sobre un pensamiento concreto que se lleva a la escritura y que nos permita comprender totalmente un pensamiento concreto.
na de las paradojas más sorprendentes inherentes a la escritura es suestrecha asociación con la muerte. Esta es insinuada en la acusación platónica deque la escritura es inhumana, semejante a un objeto, y destructora de la memoria.También es muy evidente en un sinnúmero de referencias a la escritura (o a laimprenta) que pueden hallarse en los diccionarios impresos de citas, desde 2Corintios 3:6, "La letra mata, más el espíritu vivifica", y la mención que Horacio hacede sus tres libros de Odas como un "monumento" (
Yo como lector reflexiono que: "La escritura es el monumento de la memoria", porque genera un registro de lo que vamos viviendo, construyendo o pensando, pero que al final de cuentas es un producto industrializado porque esta es una representa idealista sobre nuestro pensamiento que no tiene un contexto y no se puede complejizar tanto como nuestros pensamientos. Porque para mi, la escritura es el resultado escrito de nuestras reflexiones, pero para poder llegar a concretar esas ideas especificas que me parecieron valiosas para comunicarlas de forma escrita, tuve que haber tenido un proceso de pensamiento de dias, semanas o meses que no fue registrado. La escritura es el único lugar donde pueden existir las palabras habladas.
Platón consideraba la escritura como una tecnología externa y ajena, lomismo que muchas personas hoy en día piensan de la computadora. Puesto que enla actualidad ya hemos interiorizado la escritura de manera tan profunda y hechode ella una parte tan importante de nosotros mismos, así como la época de Platónno la había asimilado aún plenamente (Havelock, 1963), nos parece difícilconsiderarla una tecnología, como por lo regular lo hacemos con la imprenta y lacomputadora. Sin embargo, la escritura (y particularmente la escritura alfabética)constituye una tecnología que necesita herramientas y otro equipo: estilos, pinceleso plumas; superficies cuidadosamente preparadas, como el papel, pieles deanimales, tablas de madera; así como tintas o pinturas, y mucho más.
La escritura es una tecnología externa y ajena a nosotros mismos. La escritura constituye una tecnologia que necesita herramientas como el papel, plumas, tablas de madera, tintas o pinturas. esta tuvo como objetivo la reducción del sonido dinámico al espacio inmóvil - lo que también hacian la imprenta y la computadora.
La flor muerta, en otro tiempo viva, esel equivalente psíquico del texto verbal. La paradoja radica en el hecho de que lamortalidad del texto, su apartamiento del mundo vital humano vivo, su rígidaestabilidad visual, aseguran su perdurabilidad y su potencial para ser resucitadodentro de ilimitados contextos vivos por un número virtualmente infinito delectores vivos (Ong, 1977, pp. 230-271).
Aunque el autor muera, el mensaje va a seguir vivo en la mente de los lectores. Es decir que: "El cuento no existe cuando alguien lo cuenta sino cuando alguien lo imagina"
Hieronimo Squarcialico, quien de hecho promovió laimpresión de los clásicos latinos, también argumentó, en 1477, que ya la"abundancia de libros hace menos estudiosos a los hombres" (citado en Lowry, 1979,pp. 29-31): destruye la memoria y debilita el pensamiento demasiado trabajo (unavez más, la queja de la computadora de bolsillo), degradando al hombre o la mujersabios en provecho de la sinopsis de bolsillo. Por supuesto, otros consideraban laimprenta como un nivelador deseable que volvía sabio a todo mundo (Lowry, 1979,pp. 31-32).
El texto menciona una crítica a la invención de la imprenta porque consideraba que una abundancia de libros hace menos estudiosos a los hombres, como sino profundizarán en el conocimiento. Porque la crítica está en que ahorita se considera sabio a quien tiene o ha leído una mayor cantidad de libros, pero eso no quiere decir que profundice en el conocimiento.
Eltérmino idea, forma, tiene principios visuales, viene de la misma raíz que el latínvideo, ver, y de ahí, sus derivados en inglés tales como visión [visión], visible [visible]o videotape. La forma platónica era la forma concebida por analogía con la formavisible. Las ideas platónicas no tienen voz; son inmóviles; faltas de toda calidez; noimplican interacción sino que están aisladas; no integran una parte del mundo vitalhumano en absoluto, sino que se encuentran totalmente por encima y más allá delmismo.
Menciona que las ideas son visuales y que vienen arraigadas del mismo principio de video, ver, visión, visible. Entonces, se podría inferir que las ideas también pueden convertirse en una tecnología al poder crear una imagen mental de nuestros pensamientos.
Un defecto del argumento de Platón es que, para manifestar sus objeciones,las puso por escrito; es decir, el mismo defecto de las opiniones que se pronunciancontra la imprenta y, para expresarlas de modo más efectivo, las ponen en letraimpresa. La misma incongruencia en los ataques contra las computadoras seexpresa en que, para hacerlos más efectivos, aquellos que los realizan escogenartículos o libros impresos con base en cintas procesadas en terminales decomputadora.
Aquí mencionan algo importante, que Platon aunque estaba de en desacuerdo con la tecnología de la escritura, igual utilizo escritos para plasmas sus opiniones y pensamientos. O la otra realidad de los que inventaron las computadoras que criticaban el uso del papel tradicional y gracias a eso, lograron crear las cintas procesadas que inventaron la computadora.
Para el autor es simple, la escritura, la imprenta y la computadora son formas de tecnologizar la palabra, una vez tecnologizada no puede criticarse porque carece de ese contexto o de no tener al creador de frente.
Es un objeto, un producto manufacturado. Desdeluego, lo mismo se dice de las computadoras. En segundo lugar, afirma el Sócratesde Platón, la escritura destruye la memoria. Los que la utilicen se harán olvidadizosal depender de un recurso exterior por lo que les falta en recursos internos. Laescritura debilita el pensamiento. Hoy en día, los padres, y otros además de ellos,temen que las calculadoras de bolsillo proporcionen un recurso externo para lo quedebiera ser el recurso interno de las tablas de multiplicaciones aprendidas dememoria. Las calculadoras debilitan el pensamiento, le quitan el trabajo que lomantiene en forma. En tercer lugar, un texto escrito no produce respuestas. Si uno lepide a una persona que explique sus palabras, es posible obtener una explicación; siuno se lo pide a un texto, no se recibe nada a cambio, salvo las mismas palabras, amenudo estúpidas, que provocaron la pregunta en un principio.
Aquí se da el desarrollo de lo argumentos por la frase de platon donde menciona que: "es inhumana al pretender establecer fuera del pensamiento lo que en realidad solo puede existir dentro de él". Argumentos que sostienen esta frase: 1. Es un objeto, un producto manufacturado. Lo mismo se dice de las computadoras 2. La escritura destruye la memoria. Coloca el ejemplo de que la invención de las calculadoras es un recurso externo que produjo que las tablas aprendidas de memoria que son un recurso interno sean olvidadas. 3. Un texto escrito no produce respuestas, si se le pregunta a una persona que explica sus palabras presencialmente este podría hacerlo, pero en un texto escrito no se podría porque no tenemos al autor en frente. 4. El hecho de que la palabra escrita no puede defender como es capaz de hacerlo la palabra hablada natural. Menciona que el habla y pensamiento real está medida por un contexto de ida y vuelta, pero en la palabra escrita es pasiva, es decir, fuera de dicho contexto, irreal y artificial al igual que las computadoras.
Las culturas orales conocen una especie de discurso autónomo en lasfórmulas rituales fijas (Olson, 1980a, pp. 187-194; Chafe, 1982), así como en frasesadivinatorias o profecías, en las cuales la persona misma que las enuncia seconsidera no la fuente sino sólo el conducto. El oráculo de Delfos no era responsablede sus profecías, pues se las tenía por la voz del dios. La escritura, y más aún laimpresión, posee algo de esta cualidad adivinatoria. Como el oráculo o el profeta, ellibro transmite una enunciación de una fuente, aquel que realmente "dijo" o escribióel libro
Menciona que uno de estos ejemplos del lenguaje autonomo son las formulas rituales como las frases adivinatorias o las profecias
seres cuyosprocesos de pensamiento no se originan en poderes meramente naturales, sino enestos poderes según sean estructurados, directa o indirectamente, por la tecnologíade la escritura. Sin la escritura, el pensamiento escolarizado no pensaría ni podríapensar cómo lo hace, no sólo cuando está ocupado en escribir, sino inclusonormalmente cuando articula sus pensamientos de manera oral. Más que cualquierotra invención particular, la escritura ha transformado la conciencia humana.
El texto menciona que la escritura es la tecnología que llego a estructurar directa o indirectamente el pensamiento y que por ende, la escritura ha transformado la comunicación oral como escrita porque cambia la manera en la que articulamos las palabras, y esta naturalmente favorece a los individuos que están funcionalmente escolarizados
El autor podría ser cuestionado sólo si fuera posible comunicarse con él oella, pero es imposible encontrar al escritor en un libro. No hay manera de refutarun texto directamente. Después de una impugnación generalizada y devastadora,dice exactamente lo mismo que antes. Este es un motivo por el cual "el libro dice" enel habla popular es equivalente a "es cierto". También es una razón por la cual loslibros se han quemado. Un texto que manifiesta lo que el mundo entero sabe que esfalso expresará la falsedad eternamente, siempre que ese texto exista. Los escritosson inherentemente irrefutables
Esta es una idea clave que menciona que no se puede refutar a un autor de un libro porque no lo tenemos en frente, es una forma de decirnos que lo que se escribe en el libro: "es cierto", aunque no lo sea para nosotros sino que es una verdad para el autor de ese libro
Cadre de référence sur les mesures de contrôle en milieu scolaire : Note de synthèse
https://www.youtube.com/watch?v=D43t0L_G7-Y
Ce document de référence, fruit d'une collaboration entre le ministère de l’Éducation (MEQ) et la Fédération des centres de services scolaires du Québec (FCSSQ), définit les orientations nationales concernant l’utilisation des mesures de contrôle — contention et isolement — dans les établissements d'enseignement.
La prémisse fondamentale est que ces mesures ne doivent être envisagées qu'en dernier recours, exclusivement dans des situations d'urgence où la sécurité de l'élève ou d'autrui est menacée de façon imminente.
Le cadre privilégie une approche préventive et éducative, structurée autour du Système de soutien à paliers multiples (SSPM), visant à réduire au minimum le recours à la force ou à la contrainte.
Il clarifie les responsabilités légales et professionnelles, notamment depuis les modifications réglementaires d'octobre 2023 habilitant certains professionnels (psychologues et psychoéducateurs) à décider de l’utilisation de mesures de contention.
La mise en œuvre repose sur une démarche rigoureuse en cinq étapes, incluant l'élaboration de protocoles spécifiques (école ou élève) et l'application de modalités postsituationnelles pour assurer le bien-être et la réévaluation constante des pratiques.
Le recours aux mesures de contrôle est strictement encadré par des références légales (Charte des droits et libertés, Code civil, Loi sur l'instruction publique) et doit respecter les principes de dignité, d'intégrité et de sécurité de l'élève.
Principes fondamentaux de l'intervention :
• Dernier recours : Utilisé uniquement lorsque les interventions préventives et les mesures alternatives ont échoué.
• Danger imminent : La menace doit être caractérisée par sa prévisibilité, son immédiateté et la gravité de ses conséquences.
• Contrainte minimale : La mesure doit être la moins restrictive possible et durer le moins longtemps possible (cesser dès que le danger est écarté).
• Respect et dignité : L'intervention doit être empreinte de bienveillance et de chaleur humaine, sous une surveillance constante.
• Suivi obligatoire : Chaque application doit faire l'objet d'un suivi postsituationnel pour évaluer l'efficacité et réguler les futures interventions.
Le cadre distingue plusieurs types d'interventions pour assurer une compréhension commune au sein du réseau scolaire.
| Type de mesure | Description | Exemples | | --- | --- | --- | | Contention physique | Utilisation de la force humaine pour immobiliser ou diriger un élève contre son gré. | Tenir le bras d'un élève qui résiste ou le maintenir s'il frappe. | | Contention mécanique | Emploi d'un équipement ou de matériel pour limiter le mouvement. | Mitaines de sécurité, vestes de retenue dans le transport scolaire. | | Retrait de matériel | Confiscation d'un appareil palliant normalement un handicap. | Retirer les freins d'un fauteuil roulant ou confisquer une marchette. | | Isolement | Confinement de l'élève dans un lieu d'où il ne peut sortir librement. | Tenir la poignée d'une porte fermée ou bloquer physiquement l'accès. |
Note : L'administration de substances chimiques à des fins de contrôle nécessite une prescription médicale et n'est pas traitée dans ce document.
Le cadre distingue deux contextes d'application, impactant directement les responsabilités professionnelles.
| Caractéristique | Intervention Non Planifiée | Intervention Planifiée | | --- | --- | --- | | Contexte | Comportement inhabituel et imprévisible. | Comportement connu et susceptible de se répéter. | | Outil de gestion | Protocole-école (universel). | Protocole-élève (personnalisé, lié au Plan d'intervention). | | Décision (Contention) | Activité non réservée (urgence). | Activité réservée aux professionnels habilités. | | Décision (Isolement) | Activité non réservée. | Activité non réservée (mais encadrée). | | Application | Activité non réservée. | Activité non réservée. |
Pour assurer la sécurité et le respect des droits, une structure systématique est proposée :
1. Élaboration du protocole : Mise en place préventive de balises (comité-école pour le protocole-école ; équipe-école et parents pour le protocole-élève).
2. Application des interventions préventives et alternatives : Utilisation de stratégies éducatives pour éviter la crise (diversion, sécurisation de l'environnement).
3. Évaluation du danger : Analyse rigoureuse de la situation selon les critères de prévisibilité, d'immédiateté et de gravité.
4. Application de la mesure de contrôle : Mise en œuvre selon les balises du protocole et les recommandations professionnelles.
5. Modalités postsituationnelles : Retour sur l'événement, établissement des faits, soutien aux témoins (élèves et adultes) et révision du protocole.
La prévention est la "première voie d'action". Le document souligne l'importance du Système de soutien à paliers multiples (SSPM) :
• Palier 1 (Universel) : Soutien proactif pour tous les élèves (climat sain, règles claires, relations positives).
• Palier 2 (Ciblé) : Soutien supplémentaire pour les élèves à risque (autorégulation, habiletés sociales).
• Palier 3 (Intensif) : Interventions individualisées pour les difficultés graves ou persistantes.
Le modèle "3 x 3" du CSSMB est cité en exemple, croisant l'intensité de l'intervention avec les sphères individuelle, scolaire et familiale.
Le succès de ce cadre repose sur une responsabilité partagée :
• Direction d'établissement : Coordonne l'élaboration des protocoles, assure la formation du personnel et veille au bien-être physique et psychologique de tous.
• Personnel professionnel habilité (Ergothérapeutes, infirmiers, médecins, physiothérapeutes, psychoéducateurs, psychologues) : Réalise l'évaluation clinique, décide de la mesure en contexte planifié et émet des recommandations.
• Intervenants scolaires : Collaborent à l'analyse des comportements, appliquent les mesures en suivant les protocoles et informent la direction.
• Parents et élèves : Doivent être impliqués activement dans l'élaboration du protocole-élève. Un consentement libre et éclairé est requis pour toute mesure planifiée.
« Une mesure de contrôle [...] est une intervention de dernier recours qui devrait être réalisée exclusivement en situation d’urgence, c’est-à-dire lorsque la sécurité du personnel ou des élèves est menacée. » — Bernard Drainville, Ministre de l'Éducation
« L’utilisation d’une mesure de contrôle n’est pas préconisée en milieu scolaire. [...] Elle ne doit jamais être employée comme mesure éducative ou punitive ou encore pour faciliter la surveillance de l’élève. » — Source Contextuelle, Section 1.1
« Le recours aux mesures de contrôle est susceptible d’entraîner des blessures physiques et psychologiques qui peuvent avoir des implications à long terme. » — Source Contextuelle, Section 1
T h e r e i s , h o w e v e r , one most i m p o r t a n t e l e m e n ti n i t w h i c h , from a s t r i c t l y c o n s t i t u t i o n a l p o i n t ofv i e w , h a s now 7 a s r e g a r d s a l l v i t a l m a t t e r s , r e a c h e di t s f u l l d e v e l o p m e n t ; we r e f e r t o t h e group ofs e l f g o v e r n i n g c o m m u n i t i e s composed of G r e a t B r i t a i nand t h e D o m i n i o n s . T h e i r p o s i t i o n and . . u t u a l r e l a t i o nmay be r e a d i l y d e f i n e d
This passage asserts that the British colonies (the Dominions) have reached political maturity and are now capable of governing themselves completely independently. It defines a new relationship of equality in which Great Britain and these nations become free partners, without any relationship of domination.
<h1>
Il y a 6 niveaux de titre. Header 1 jusqu'au 6. H1 est écrit en gros, H6 est écrit dans la taille la plus petite des titres.
Attention: une seule balise H1 par page. C'est le titre affiché de la page. Par contre, pour les autre headers, on peut en mettre autant qu'on veut.
Les headers ne sont pas seulement important pour afficher une hiérarchie de titres sur la page. Mais Google et les moteurs de recherche les lisent, pour savoir de quoi parle la page. Ils accordent plus d'importance aux titres qu'aux non-titres pour évaluer le contenu. Si on met plusieurs balises H1 (il ne devrait y en avoir qu'une par page, Google enlève du "poids" (de l'importance) à un des titres, donc ce n'est pas souhaitable our des raison d'optimisation du code dans les moteurs de recherche (permettre à notre site d'être facilement trouvés par les internet dans Google).
On ne doit pas non plus tricher en mettant des titres, et un contenu qui n'a rien à voir, ou trop de titres par rapport au contenu, Google le détecte.
Si les accents s'affichent mal par la suite, c'est qu'il y a un problème avec l'encodage. Vérifiez que la balise meta indique bien UTF-8, et que votre fichier est enregistré en UTF-8.
Si on mets une étiquette "Fr" mais que c'est écrit avec un alphabet bizarre que personne ne peut lire, l'étiquette ne sert à rien. Enregistrer en UTF-8, c'est choisir le bon alphabet au moment de cliquer sur "Enregistrer".
L'encodage est un réglage de l'éditeur de texte (VS Code, Sublime Text, Notepad++, etc.).
Dans VS Code : Tout en bas à droite de la fenêtre, dans la barre bleue. C'est écrit "UTF-8". Si c'est écrit"Windows-1252" ou "Western", c'est qu'il y a un blème !
Par Les "é" deviennent des é
Si les accents bugguent malgré la balise meta :
Ouvrir le fichier dans l'éditeur.
Cliquer sur l'encodage en bas à droite (souvent "UTF-8" ou "Win1252"). "Save with Encoding" (Enregistrer avec l'encodage).
Sélectionner UTF-8.
Compte rendu détaillé : La situation de l'éducation en France dans le contexte international
L'intervention du 19 octobre 2023 se penche sur la situation de l'éducation en France à travers le prisme des comparaisons internationales, s'appuyant sur les enquêtes PISA, TALIS et l'enquête sur les compétences socio-émotionnelles de l'OCDE, ainsi que sur d'autres rapports de l'organisation.
I. Rôle et objectifs des systèmes éducatifs
Noémie Le Donné introduit son propos en rappelant les trois objectifs fondamentaux des systèmes éducatifs, selon la nomenclature de Herman van de Werfhorst et ses collègues :
Développer les compétences et connaissances des élèves : Il s'agit des compétences cognitives, académiques et socio-émotionnelles, sélectionnées pour leur utilité future sur le marché du travail, pour une participation active à la vie sociétale et pour le bien-être et l'épanouissement personnel des élèves.
Sélectionner et orienter les élèves : En fonction de leur niveau, de leurs compétences, de leurs connaissances et de leurs intérêts.
Promouvoir l'équité des opportunités d'apprentissage et de développement : Un objectif crucial qui sera abordé en détail.
II. Indicateurs clés sur l'apprentissage en France (comparaisons internationales)
Les données présentées proviennent principalement de l'enquête PISA 2018 (antérieures à la période COVID), sauf indication contraire.
Les résultats de PISA 2022 seront disponibles en décembre.
A. Performances cognitives (PISA)
Moyenne générale : Les performances moyennes des élèves français de 15 ans sont légèrement au-dessus de la moyenne de l'OCDE en mathématiques, compréhension de l'écrit et sciences.
Observation critique : Bien que ce soit "plutôt rassurant", cela est "quand même un peu décevant" si l'on considère la France comme l'un des dix pays les plus développés au monde, s'attendant à un classement plus élevé.
B. Tendances des performances
La tendance est stable pour la compréhension de l'écrit et les sciences.
C. Inégalités sociales
Forte iniquité : La France se situe dans le quadrant des pays qui combinent des performances moyennes légèrement supérieures à la moyenne de l'OCDE avec de "fortes inéquités de réussite scolaire liées à l'origine sociale".
Origines précoces : Les inégalités sociales de réussite scolaire trouvent leurs origines "très très très tôt", souvent dès l'entrée en maternelle.
Impact de la structure du système éducatif : La structure des systèmes éducatifs joue un rôle majeur.
La France, avec son système qui "oriente assez tôt les élèves" vers différentes filières (professionnelle, générale) et son ancien taux élevé de redoublement (près de 40% des élèves de 15 ans à l'époque de la thèse de l'intervenante), a tendance à "augmenter aussi les inégalités sociales de compétences".
Noémie Le Donné cite l'exemple de la Finlande, avec son système "très unifié", comme un contre-exemple favorisant l'homogénéité du groupe classe.
D. Évaluations et lacunes
Richesse des données sur les compétences cognitives : La France dispose de "beaucoup de sources disponibles" pour l'évaluation des compétences cognitives (enquêtes nationales sur échantillon comme CEDRE, panels d'élèves, évaluations nationales exhaustives croissantes, nombreuses enquêtes internationales comme PISA).
Manque d'informations sur les compétences socio-émotionnelles : En revanche, il y a "très peu d'information sur les compétences socio-émotionnelles des élèves".
Importance : Ces compétences sont "enseignables", "nécessaires aux apprentissages" (persévérance, curiosité) et "fondamentales pour votre réussite professionnelle, scolaire, personnelle".
Inégalités : Les enquêtes de l'OCDE dans les pays européens participants montrent également de "fortes inégalités sociales de performance dans ces domaines".
Appel à participation : La France est encouragée à rejoindre l'enquête de l'OCDE sur les compétences socio-émotionnelles pour "compléter le diagnostic très riche qu'on a sur les compétences cognitives".
E. Bien-être des élèves
Satisfaction de vie : En 2018, environ 70% des élèves français se déclaraient "en général satisfaits avec leur vie", un taux supérieur à la moyenne de l'OCDE.
Anxiété en mathématiques : Les élèves français se déclarent "plutôt plus anxieux face aux mathématiques". Notamment, un "écart plus grand avec la moyenne de l'OCDE" est observé sur l'item : "Je suis très tendu quand j'ai un devoir de mathématique à faire". Cela soulève la question de l'accompagnement socio-émotionnel des élèves pour gérer cette anxiété.
Harcèlement : En 2018, entre 5 et 10% des élèves français déclaraient être exposés "au moins plus d'une fois par mois" à un événement s'apparentant au harcèlement.
En cumulant tous les types de harcèlement, 20% des élèves de 15 ans se disent concernés "au moins une fois par mois" par l'un de ces événements.
La bonne nouvelle est que la France est "plutôt un petit peu en dessous de la moyenne de l'OCDE".
III. Leviers politiques pour améliorer la situation : Le rôle des enseignants
Cet effet est observé sur les performances académiques (plus marqué en mathématiques qu'en français, les maths étant "essentiellement un travail qui est fait en classe") et sur les compétences socio-émotionnelles.
Comparé à d'autres interventions (comme la réduction de la taille des classes), "l'effet enseignant est plus fort".
A. Politiques des systèmes éducatifs performants et équitables
L'analyse des systèmes éducatifs considérés comme "meilleurs" (à la fois performants et équitables) révèle trois éléments communs concernant la profession enseignante :
Expérience pratique longue et obligatoire : Pendant la formation initiale des enseignants (au minimum un semestre, idéalement 1 à 2 ans), avec un tuteur.
Formations continues adaptées : Des formations qui "répondent à leurs besoins" spécifiques et à ceux de l'établissement.
Évaluation liée à la formation continue : Les mécanismes d'évaluation des enseignants sont "reliés à la formation continue" et aux propositions de développement professionnel.
B. Variables liées à la réussite des élèves (études micro)
Des travaux ont mis en évidence des corrélations fortes entre certaines variables concernant les enseignants et chefs d'établissement, et les performances cognitives et socio-émotionnelles des élèves :
Temps d'enseignement effectif : La part du temps de classe que les enseignants passent "réellement à enseigner" (et non à gérer la discipline ou l'administratif) est "très fortement lié au réussit à la réussite des élèves".
Temps de correction des copies : Le temps de travail passé par les enseignants à corriger les copies est "très positivement relié à la réussite des élèves", car cela permet d'évaluer les besoins, identifier les difficultés, et adapter les pratiques et les retours aux élèves.
Implication extrascolaire : L'implication des enseignants dans les activités extrascolaires est "très bénéfique pour les compétences socio-émotionnelles".
Satisfaction au travail : La satisfaction des enseignants avec leur environnement de travail est cruciale : "un enseignant qui est heureux là où il est il il arrive davantage à transmettre aux élèves".
Pratiques pédagogiques d'activation cognitive : L'usage de pratiques pédagogiques qui placent "l'élève au centre de l'enseignement" (plutôt que de recevoir passivement).
Autonomie des établissements : L'autonomie donnée aux établissements pour le recrutement et la gestion des enseignants est un "élément positif pour la réussite des élèves".
IV. Recommandations en matière de politique éducative et enseignante
Pour avoir un corps enseignant de qualité et améliorer le système éducatif, plusieurs recommandations sont formulées :
Choix politiques délibérés et évaluation : La qualité du corps enseignant est le "résultat de choix de de choix politique délibéré et qui sont soigneusement mis en œuvre dans le temps", avec des "dispositifs d'évaluation" pour mesurer les effets des interventions.
Développement professionnel continu des enseignants : Les enseignants doivent "devenir des apprenants permanents, des professionnels curieux".
Promotion de la profession enseignante : Il faut "promouvoir la profession enseignante en tant que telle", en soulignant l'aspect "stimulant sur le plan intellectuel" et en offrant des "évolution de carrière".
Développement des compétences socio-émotionnelles : C'est un "levier pour améliorer le bien-être et la réussite de tous les élèves" (mention des cours d'empathie proposés par le ministre comme allant "plutôt dans le bon sens").
Assurer l'accès à des enseignants de qualité pour les élèves défavorisés : Les problèmes de discipline, qui "empêchent l'enseignement", sont "davantage présents dans les établissements défavorisés". Il est donc essentiel que ces élèves aient "aussi accès à des enseignants de qualité".
Autonomie des établissements : Les efforts récents en France pour accorder plus d'autonomie aux établissements sont à saluer, car cela ne va pas "nécessairement de paire avec de plus grandes inégalités de réussite".
Attractivité du métier : Au-delà du salaire, il faut valoriser l'attractivité du métier en offrant des perspectives de carrière et en reconnaissant le caractère intellectuellement stimulant de la profession.
Promouvoir la collaboration entre enseignants : Les enseignants français sont "assez solitaires", "très nombreux à dire qu'ils ne collaborent pas avec leurs collègues", qu'ils "ne co-enseignent pas", et qu'ils ne "viennent pas s'observer les uns les autres en salle de classe pour se faire des retours".
Cette absence de dialogue et d'échange est un "manque cruel" qui prive la profession de la "richesse" de la collaboration.
En conclusion, si la France se situe légèrement au-dessus de la moyenne de l'OCDE en termes de performances cognitives, elle est confrontée à une tendance à la baisse en mathématiques et à de fortes inégalités sociales.
L'amélioration de la situation passe par une valorisation et un soutien accru aux enseignants, une promotion active des compétences socio-émotionnelles et une transformation des pratiques professionnelles vers plus de collaboration et d'autonomie au niveau des établissements.
Le Partenariat en Santé : Synthèse de trois Expériences de Terrain
Ce document de synthèse analyse les interventions de trois équipes lors d'une session organisée par le Centre Opérationnel du Partenariat en Santé (COPS).
Il explore la mise en œuvre concrète du partenariat en santé à travers les secteurs des soins primaires, du sanitaire et du médico-social.
L'intégration du patient et de ses proches comme partenaires actifs transforme durablement les pratiques de soin.
Les retours d'expérience mettent en lumière une transition fondamentale : passer d'une logique de « faire pour » le patient à une logique de « faire avec » lui.
Points clés à retenir :
• Diversité des modèles : Le partenariat s'adapte à différents contextes, de la gouvernance des structures territoriales (CPTS) à la co-construction de parcours hospitaliers spécifiques ou au soutien à domicile.
• Défis opérationnels : Le recrutement des patients partenaires, l'acculturation des professionnels, la gestion du temps commun et la pérennisation des financements constituent les principaux obstacles.
• Bénéfices mutuels : Le partenariat améliore la pertinence des soins, réduit l'isolement des familles et renforce le sens du travail pour les professionnels de santé, contribuant ainsi à une meilleure qualité de vie au travail (QVT).
• Rigueur méthodologique : Pour éviter le « tokenisme » (participation de façade), une méthodologie rigoureuse et une coordination dédiée sont essentielles.
--------------------------------------------------------------------------------
Les Communautés Professionnelles Territoriales de Santé (CPTS) regroupent des acteurs de santé libéraux pour mener des actions de santé publique. Dans cette expérience, le partenariat est envisagé comme une confrontation de « morceaux de réalité ».
Le partenariat au sein de la CPTS se décline sur plusieurs strates :
• Consultation : Réalisation d'enquêtes sur l'expérience des patients dans les lieux de soins non programmés pour comprendre leurs motivations de déplacement.
• Parcours de soins : Implication de patients experts dans des groupes de travail pluriprofessionnels (insuffisance cardiaque, diabète, santé orale).
• Gouvernance : Création d'un collège spécifique au sein de l'association ouvert aux patients, élus et habitants, disposant de voix consultatives au conseil d'administration.
| Catégorie | Détails | | --- | --- | | Freins | Confusion sémantique (multiplicité des termes : patient expert, traceur, coach) ; Difficulté de recrutement local ; Absence de statut administratif (SIRET) pour rémunérer les patients sans association. | | Leviers | Appui des médecins spécialistes hospitaliers déjà acculturés ; Création d'espaces de rencontre hors cabinets médicaux (ex: dépistage en centre commercial). |
--------------------------------------------------------------------------------
Le projet « Au cœur des soins », mené avec l'association Tremplin, porte sur le parcours des enfants porteurs de fentes faciales. Il repose sur une collaboration étroite entre parents partenaires et soignants.
L'ambition est de promouvoir une relation de soin partenariale dès le diagnostic.
1. Recueil de l'expérience : Écoute du vécu des parents.
2. Approfondissement : Identification précise des besoins.
3. Co-construction : Utilisation d'outils participatifs nouveaux en milieu hospitalier.
L'ingrédient secret : Une coordination dédiée (représentant 2/3 des fonds du projet) pour organiser les espaces de dialogue et garantir la rigueur de la démarche, évitant ainsi d'utiliser les patients pour la simple forme.
• Pour les familles : Reconnaissance de leur rôle d'acteur et réduction du sentiment d'isolement.
• Pour les professionnels : Meilleure compréhension des besoins réels. Une orthophoniste témoigne : « J'ai le sentiment d'aller plus vite, d'être plus efficace... la charge mentale est aussi vraiment moindre. »
• Relationnel : Établissement d'une horizontalité dans les échanges, permettant aux patients de comprendre aussi les contraintes des soignants.
--------------------------------------------------------------------------------
L'association AA (Aide et Soins à domicile) s'est engagée dans le partenariat suite à une crise majeure : un conflit délétère entre une équipe de soins et une aidante, ayant entraîné un épuisement professionnel massif (10 arrêts de travail sur 10 salariés).
Initialement, l'association a commis l'erreur de construire la démarche entre professionnels uniquement. Le « rétropédalage » a été nécessaire pour intégrer réellement des aidants et des personnes accompagnées dans les groupes de travail en 2025.
Les témoignages clés recueillis :
• Mme Isabelle (personne accompagnée) : Souligne l'importance d'être attentif à la demande : « Parfois le salarié agit comme il souhaite mais pas comme la personne le souhaite. »
• M. Marc (aidant) : Note que les soignants doivent accepter les conseils des tiers lorsqu'ils manquent de connaissance sur le patient spécifique.
• Fatigabilité : La participation des usagers est contrainte par leur état de santé ou leur charge d'aidant.
• Changement de paradigme : Abandonner le terme de « prise en charge » (jugé passif) au profit de « prendre en soin » ou « accompagner ».
• Transparence : Accepter de recevoir des critiques directes et parfois dures sur la qualité de l'accompagnement.
--------------------------------------------------------------------------------
L'analyse comparée des trois interventions permet de dégager des constantes dans la mise en œuvre du partenariat en santé.
1. L'Acculturation : Le niveau de maturité face au partenariat est très hétérogène. Certains professionnels y voient une remise en question de leur autorité, d'autres une perte de temps.
2. Le Recrutement : Trouver le « bon patient pour le bon parcours », disponible et prêt à s'investir dans la durée, reste complexe.
3. La Temporalité : Aligner les agendas des professionnels libéraux, des salariés hospitaliers et des patients (souvent fatigués) est un défi logistique permanent.
4. Le Financement : La pérennisation des ressources pour rémunérer le temps de coordination et l'expertise des patients est cruciale.
• Volonté Institutionnelle : Un engagement fort de la direction et des cadres est indispensable pour lever les résistances.
• Savoirs Expérientiels : Reconnaître que le savoir issu du vécu de la maladie est complémentaire au savoir scientifique et clinique.
• Évaluation de l'impact : Bien que difficile, la mesure de l'amélioration de l'expérience patient et de la qualité des soins est nécessaire pour valider la démarche à long terme.
Une observation majeure émerge : le partenariat en santé est un levier puissant de bien-être au travail.
En améliorant la compréhension des besoins et en réduisant les situations conflictuelles, il redonne du sens aux missions des professionnels et diminue leur charge mentale, malgré l'investissement temporel initial requis pour sa mise en place.
https://www.youtube.com/watch?v=puMqkq6jG0o
Points forts de la vidéo "Parlez-vous français : pour une relation entre citoyens et services publics sans jargon" avec timestamps
00:00:00 - Introduction
Présentation de l'atelier sur la simplification du langage administratif et son importance pour la relation entre citoyens et services publics.
Les enjeux de la simplification du langage administratif : accessibilité, compréhension, confiance des usagers. Coûts de l'inintelligibilité du langage administratif pour les usagers et les services publics.
03:30 - Plan gouvernemental "Parlez-nous français"
Lancement d'un plan gouvernemental pour lutter contre le jargon administratif.
Capitalisation sur les actions déjà menées et les initiatives des services publics.
Centré sur les écrits administratifs (courriers, formulaires, sites internet, démarches en ligne). Articulé avec la suppression et la numérisation des formulaires administratifs (SERFA).
07:30 - Difficultés de la lutte contre le jargon administratif
Le langage administratif est souvent technique et centré sur l'administration elle-même. Nécessité d'un renversement de perspective pour se mettre à la place de l'usager.
La norme "Langage clair" vise à communiquer des informations claires et utiles aux usagers.
10:30 - Exemple de France travail
Réécriture des courriers avec des ergonomes et des usagers.
Confrontation des courriers aux usagers pour tester leur compréhension. Utilisation de la notion de "parcours" pour simplifier les démarches administratives.
15:30 - Rôle de l'IA dans la simplification du langage administratif
Potentiel de l'IA pour générer des textes clairs et accessibles.
Nécessité de prendre en compte les biais et les limites de l'IA. Importance de l'évaluation et de la validation humaine des textes générés par l'IA.
20:00 - Conclusion
Importance de la simplification du langage administratif pour la relation entre citoyens et services publics.
Engagement du gouvernement à travers le plan "Parlez-nous français".
Rôle de la DITIP pour accompagner les services publics dans cette démarche.
Appel à continuer les efforts de simplification et de communication claire.
Résumé de la vidéo "Parlez-vous français : pour une relation entre citoyens et services publics sans jargon" après 00:20:00 avec timestamps
Voici un résumé de la vidéo "Parlez-vous français : pour une relation entre citoyens et services publics sans jargon" après 00:20:00 avec des timestamps :
00:20:00 Introduction de l'atelier et présentation des intervenants.
00:25:22 Gisèle Doriano, chef du service expérience usager à la DITIP, explique les raisons de l'atelier :
Le langage administratif est un problème pour les usagers, notamment les plus vulnérables.
Il y a un coût pour les usagers et les services publics. Le gouvernement a lancé un plan appelé "Parlez-nous français" pour simplifier le langage administratif.
00:31:42 Discussion sur les difficultés de la simplification du langage administratif :
Il est souvent plus simple pour les agents d'utiliser un langage technique.
L'administration a tendance à se centrer sur elle-même plutôt que sur l'usager.
00:35:22 Présentation des actions menées par France
Travail pour simplifier ses courriers :
00:39:42 Discussion sur l'utilisation de l'IA pour simplifier le langage administratif :
L'IA peut être un outil utile, mais il faut être vigilant sur les biais et l'uniformisation. L'IA doit être utilisée comme un appui pour l'intervention humaine. 00:44:22 Cécile Barouat, Défenseur des droits, souligne l'importance de la simplification du langage administratif :
Il faut identifier les objets les plus compliqués pour les usagers.
Le plan gouvernemental "Parlez-nous français" est une bonne initiative.
La DITIP a un rôle important à jouer pour accompagner les services publics.
00:48:22 Conclusion de l'atelier par Gisèle Doriano : Il y a une dynamique de simplification en cours.
Le plan "Parlez-nous français" est un engagement fort du gouvernement.
La DITIP est là pour aider les services publics à simplifier leur langage.
00:51:22 Fin de l'atelier.
Synthèse de la Réflexion Éthique et du Partenariat en Santé
Ce document synthétise les interventions du Professeur Michel Clanet lors de la journée « Redonner du sens », consacrée au partenariat en santé et à l'éthique. L'analyse met en lumière le rôle pivot des Espaces de Réflexion Éthique (ERE) dans l'acculturation des professionnels et des citoyens aux enjeux de la bioéthique.
Les points clés incluent :
• La redéfinition de la relation de soin comme une rencontre entre deux vulnérabilités (soignant et soigné), visant une horizontalité accrue via le partenariat.
• La distinction entre conscience professionnelle et conscience morale, dont le conflit génère le « dilemme éthique ».
• L'institutionnalisation de la réflexion éthique par le dialogue collégial, indispensable pour éclairer la décision clinique et institutionnelle.
• L'élargissement de l'éthique à la démocratie en santé, intégrant la prévention, la santé environnementale et la lutte contre les inégalités sociales.
--------------------------------------------------------------------------------
Les ERE sont des structures institutionnelles nées d'un concept de 2004 et créées officiellement en 2012. Ils dépendent du ministère de la Santé (DGOS) et sont rattachés aux centres hospitaliers universitaires (CHU). En Occitanie, le site principal se situe à Toulouse, avec un site d’appui à Montpellier.
Leurs actions s'articulent autour de deux axes majeurs :
1. Secteur du soin et de l'accompagnement :
◦ Former et acculturer les professionnels à la réflexion éthique et à la bioéthique. ◦ Répondre aux exigences de certification des établissements de santé et médico-sociaux. ◦ Produire des guides pratiques (ex: La collégialité au domicile, La prise en charge de la vulnérabilité au domicile).
2. Secteur de la cité et du citoyen :
◦ Agir comme prolongement régional du Comité Consultatif National d'Éthique (CCNE). ◦ Organiser des États Généraux de la Santé (prochaine session au printemps 2026) pour recueillir la vision citoyenne sur des thèmes comme l’intelligence artificielle, la fin de vie, la PMA ou la santé environnement.
--------------------------------------------------------------------------------
L'éthique en santé s'appuie sur une distinction entre la technique et l'intentionnalité.
Toute pratique de soin comporte deux éléments inséparables :
• Soigner quelque chose : L'aspect pratique et technique visant à traiter une maladie ou une souffrance isolée.
• Soigner quelqu'un : La dimension relationnelle et intentionnelle. Le soin s'exerce par égard pour autrui ; il ne suffit pas de pouvoir soigner, il faut le vouloir.
La phénoménologie de l'attention (selon Jean-Philippe Pierron)
La relation de soin se décline en trois niveaux d'attention :
• Faire attention : Prendre conscience de la vulnérabilité de l'autre.
• Être attentif : Exercer sa compétence technique et professionnelle.
• Être attentionné : Porter un regard de sollicitude et de disponibilité vers l'autre.
--------------------------------------------------------------------------------
L'éthique n'est pas qu'un cadre normatif ; c'est un engagement et un questionnement permanent sur la légitimité de l'action (« Que faut-il faire pour bien faire ? »).
Le dilemme naît d'un glissement ou d'un conflit entre :
• La conscience professionnelle, parfois prisonnière de la connaissance technique et des procédures.
• La conscience morale, qui renvoie aux valeurs fondamentales.
Pour résoudre une situation complexe, les structures éthiques privilégient le dialogue collégial, dont les caractéristiques sont :
• Absence de hiérarchie : La parole d'un médecin, d'un cadre ou d'un directeur a la même valeur que celle des autres professionnels.
• Multiplicité des regards : Écoute de tous les acteurs, y compris le recueil de la voix du patient.
• Éclairage et non décision : La réunion collégiale n'est pas un organe décisionnel mais une instance qui éclaire le responsable de la décision finale.
La réflexion s'appuie sur quatre piliers fondamentaux :
1. Le respect de l'autonomie (liberté de choix).
2. La bienfaisance (agir pour le bien).
3. La non-malfaisance (éviter de nuire).
4. La justice et l'équité.
--------------------------------------------------------------------------------
Le partenariat en santé est présenté comme un levier éthique majeur permettant de rééquilibrer la relation de soin.
| Concept clé | Impact Éthique | | --- | --- | | Horizontalité | Lutte contre le « pouvoir du sarrau » (pouvoir médical) pour établir une relation plus égalitaire. | | Reconnaissance réciproque | Admettre que la vulnérabilité est partagée entre le soigné (besoin de soin) et le soignant (limites techniques/morales). | | Savoirs expérientiels | Reconnaissance par le soignant que le patient possède des savoirs propres et multiples. | | Pouvoir d'agir | Renforcement de l'autonomie et de la liberté de choix du patient (Empowerment). |
Note critique : Une interrogation subsiste quant à l'équité d'accès au statut de « patient partenaire ». Il existe un risque de biais de recrutement, où certains profils pourraient ne pas se sentir légitimes pour assumer ce rôle.
--------------------------------------------------------------------------------
Le partenariat doit dépasser le cadre individuel du soin pour s'inscrire dans une dimension politique et sociale.
• Plaidoyer pour le partenariat : Nécessité de communiquer davantage pour convaincre les acteurs encore réticents ou ignorants du concept.
• Inégalités sociales de santé : Urgence d'aller vers les populations « invisibles » et précaires pour garantir une véritable équité dans le partenariat.
• Prévention et Citoyenneté : La santé commence dès l'enfance et concerne le maintien du bien-être. Le citoyen doit être acteur de la prévention, notamment face aux déterminants environnementaux (ex: maladies professionnelles liées aux pesticides chez les agriculteurs).
Conclusion : Le partenariat en santé et la démocratie sanitaire relèvent d'un même combat éthique visant à impliquer fondamentalement les citoyens dans la gestion de leur santé et de leur environnement.
mémo pour assimiler les informations essentielles.
Une autre façon de faire un mémo, est de bien utiliser le surlignage avec Hypothesis. Vous pouvez créer un groupe privé, ça mettra de côté toutes les parties que vous soulignez pour y revenir, avec vos annotations qui servent à apprendre.
isual Studio Code
Vous n'êtes pas obligés d'installer Visual Studio Code. Il y a beaucoup d'autres logiciels. VSCodium est mieux, car sans les mouchards Microsoft; Voici une version sans installation (portable, à juste mettre sur une clef USB): https://portapps.io/app/vscodium-portable/, il y a aussi Notepad++; qu'on peut aussi mettre sur une clef USB,; etc...
ces circuits conversationnels de l’information peuvent être exploités par certains producteurs de fake news
Enchaînement logique sous forme d'argument épistémique qui fait le lien entre la visibilité des fausses informations sur les RS et leur propagation : exploitation de ces échanges par des acteurs qui y ont un intérêt politique et/ou financier.
est-ce parce qu’une « fake news » a été partagée par des milliers d’internautes que chacun d’entre eux y a cru ?
Raison 2 qui reprend l'hypothèse de départ sous la forme d'un enchaînement de questions : les personnes qui échangent des fakes news n'y adhèrent pas toutes indistinctement, elles les partagent pour d'autres raisons.
Enquête sur le Milieu Périscolaire et les Établissements Privés : Failles de Sécurité et Défaillances Institutionnelles
Cette synthèse met en lumière une crise de confiance et de sécurité au sein du système périscolaire et des établissements scolaires en France.
L'enquête révèle que le temps périscolaire — qui peut représenter jusqu'à cinq heures par jour pour 5,5 millions d'élèves — souffre d'un manque criant de surveillance et de données officielles.
Malgré la multiplication des signalements d'agressions sexuelles et de maltraitances, les structures administratives (mairies et Éducation nationale) sont accusées d'inertie, voire d'avoir instauré une forme d'omerta pour protéger l'image des institutions.
Le recrutement précaire, l'absence de suivi statistique des violences au niveau ministériel et les retards dans les enquêtes administratives créent un environnement vulnérable pour les enfants, particulièrement en maternelle.
Le temps périscolaire concerne 90 % des enfants de maternelle et d'élémentaire.
Bien que ces activités se déroulent au sein des écoles, elles dépendent des municipalités et non de l'Éducation nationale.
• Volume horaire : Jusqu'à 5 heures par jour (accueil du matin, cantine, étude du soir).
• Population concernée : 5,5 millions d'élèves.
• Perception du métier : Qualifié de « sous-métier » ou de « profession poubelle » par certains acteurs, reflétant une précarité qui impacte la qualité du recrutement.
• Financement : L'État finance à 75 % les établissements privés sous contrat, mais les contrôles sur les violences éducatives ou sexuelles y sont jugés insuffisants par des lanceurs d'alerte.
L'enquête souligne des processus d'embauche parfois expéditifs.
À Rezé, un animateur condamné pour agressions sur 12 mineurs avait été recruté à 51 ans sans expérience préalable dans l'enfance, après une carrière dans la grande distribution.
L'entretien d'embauche a été décrit comme s'étant déroulé « assez rapidement ».
Un constat majeur de l'enquête est l'absence totale de données centralisées sur les violences en milieu périscolaire.
• Néant Statistique : Le ministère de la Justice a confirmé ne pas enregistrer de données spécifiques sur les violences commises par des animateurs périscolaires.
• Réalité du terrain : En compilant les articles de la presse régionale sur 10 ans, l'enquête a recensé au moins une centaine d'affaires médiatisées partout en France (Marseille, Moselle, Courbevoie, Haute-Savoie, etc.).
• Typologie des faits :
◦ Agressions sexuelles et viols sur mineurs.
◦ Maltraitances physiques (étranglements, violences à la cantine).
◦ Tentatives de corruption de mineurs.
L'enquête pointe du doigt une gestion administrative défaillante qui privilégie souvent la protection de l'institution au détriment de la sécurité des enfants.
| Type de Dysfonctionnement | Description et Conséquences | | --- | --- | | Déplacement des agents | Pratique consistant à déplacer un animateur signalé d'une école à une autre plutôt que de le sanctionner ou de l'écarter. | | Absence de suites administratives | Dans l'affaire du 15e arrondissement de Paris, deux ans après l'ouverture d'une enquête administrative, aucun débriefing n'a été fourni aux familles. | | Ignorance des alertes parentales | Des parents avaient alerté sur des comportements suspects (animateur seul avec un enfant, porte fermée) dès 2019, soit des années avant l'arrestation de l'agresseur présumé. | | Espaces à risques | Malgré un rapport de 2015 recommandant de prohiber les espaces isolés (comme les coins bibliothèque), ces lieux ont continué d'être utilisés sans surveillance adéquate. |
• « C'était toujours on protège l'institution, on règle ça entre nous mais rien ne sort. »
• « Le sanctuaire qui se brise » : expression utilisée par les parents pour décrire la perte de confiance envers l'école.
• « Vous avez l'impression que tout le monde est complice de cette omerta. »
Le professeur Thierry Bobet, pédopsychiatre, apporte un éclairage crucial sur la difficulté de recueillir la parole des victimes, particulièrement entre 3 et 6 ans.
1. Absence de représentation : Un enfant de maternelle n'a aucune notion de ce qu'est la sexualité adulte. Il utilise des termes comme « quelqu'un m'a embêté ».
2. Confusion de l'autorité : L'animateur représente une extension de l'autorité parentale, ce qui rend la dénonciation paradoxale pour l'enfant.
3. Fragilité de la mémoire : Entre 3 et 6 ans, la mémoire n'est pas mature.
Un souvenir peut être précis pendant six mois puis devenir confus, d'où l'urgence d'une prise en charge rapide.
• Régressions : Retour des couches, pipi au lit, demande de biberons.
• Troubles du comportement : Crises violentes au moment de partir à l'école, terreurs nocturnes, phobie scolaire.
• Comportements sexualisés : Jeux ou mimiques inadaptés à l'âge de l'enfant (ex: postures « vulgaires » induites par l'adulte).
L'enquête détaille des modes opératoires récurrents visant à isoler les enfants et à instaurer un climat de secret.
• Le secret comme outil de contrôle : « Vous ne dites rien à la maîtresse, c'est notre secret. »
• Rituels détournés : Dans une école parisienne, l'animateur utilisait des chansons et des jeux (ex: « la culotte de mon grand-père ») pour amener les enfants à se déshabiller et à subir des attouchements sous couvert d'activité ludique.
• Posture de l'agresseur : Souvent décrit initialement comme un « papi un peu ours » ou quelqu'un de très apprécié qui « adore les enfants », utilisant cette image pour manipuler l'entourage et isoler les victimes.
L'enquête de Cash Investigation démontre que les violences dans le milieu périscolaire ne sont pas des faits divers isolés, mais le résultat de failles structurelles :
L'urgence est à la transparence statistique et à une réforme profonde des protocoles de signalement et d'encadrement pour protéger les publics vulnérables.
Note: This response was posted by the corresponding author to Review Commons. The content has not been altered except for formatting.
Learn more at Review Commons
Response to Reviewers
We thank the Reviewers for their appreciative comments (Reviewer 1: “first time that a well-established existing mathematical model of signaling response extended and applied to heterogeneous ligand mixtures”)and constructive suggestions for improvement. In this extensive revision, we have not only addressed the suggestions comprehensively but also extended our analysis of signaling antagonism to all doses and at the single-cell level using novel computational workflows. This resulted in the discovery of several mechanismsof antagonism and synergy that are dose-dependent, and dependent on the cell-specific state of the signaling network, thereby manifesting in only a subset of cells.
We have addressed Reviewer comments: we have made substantial revisions to improve clarity, rigor, and biological interpretation. Below we briefly summarize the main concerns raised by Reviewers 1-3 and how we have addressed them.
Importantly, such antagonism or synergy is not evident in all cells in the population. It may also not be picked up by studies of the mean behavior. With our new computational workflow that allows for single-cell resolution we identify the conditions that must be met by the signaling network state, for antagonism or synergy to take place.
Further, we examine the hypothesis that such signaling pathway interactions affect stimulus-response specificity in combinatorial stimulus conditions. By comparing models with and without this antagonism, we demonstrate that antagonistic interactions can improve stimulus-response specificity in complex ligand mixtures.
These additional analyses provide a new mechanistic understanding of cellular information processing and elucidate how synergy and antagonism can mechanistically shape signaling fidelity in response to complex ligand mixtures.
Point-by-Point Response
Reviewer #1
Evidence, reproducibility and clarity
The authors extend an existing mathematical model of NFkB signalling under stimulation of various single receptors, to model that describes responses to stimulation of multiple receptors simultaneously. They compare this model to experimental data derived from live-cell imaging of mouse macrophages, and modify the model to account for potential antagonism between TLR3 and TLR9 response due to competition for endosomal transport. Using this framework they show that, despite distinguishability decreasing with increasing numbers of heterogenous stimuli, macrophages are still able in principle to distinguish these to a statistically significant degree. I congratulate the authors on an interesting approach that extends and validates an existing mathematical model, and also provides valuable information regarding macrophage response.
Response: We thank the reviewer for this appreciative assessment and for the careful reading of our work. The constructive comments helped us substantially improve the rigor and clarity of the manuscript.
In addition to revising the text for clarity, we have extended our analysis to systematically investigate dose-response behavior for each pair of ligand combination. Using the experimentally validated model, we explored 10 ligand pairs across a range of doses from non-responsive to saturating. This allowed us to identify mechanistic regimes in which synergy and antagonism arise at the single-cell level. In particular, we found that low-dose synergy can be explained by ultrasensitive IKK activation (Figure 4 and corresponding supplementary figures), while antagonism can emerge from competition for shared components such as CD14 (Figure 5 and corresponding supplementary figures). We further show that antagonism can enhance condition distinguishability in ligand mixtures, thereby contributing to stimulus-response specificity (Figure 5 and corresponding supplementary figures).
There are no major issues affecting the scientific conclusions of the paper, however the lack of detail surrounding the mathematical model and the 'signaling codons' that are used throughout the paper make it difficult to read. This is exacerbated by the fact that I was unable to find Ref 25 which apparently describes the model, however I was able to piece together the essential components from the description in Ref 8 and the supplementary material.
Response: This comment helped us to improve the writing. We apologize that the key reference 25 was still not publicly available. It is now published in Nature Communications. In addition, we have added more details to clarify the mathematical model as well as the signaling codons, in results and in methods. Please see below for details.
Lots of the minor comments below stem from this, however there are also a few other places that could benefit from some additional clarification and explanation.
Significance: 1. '...it remains unclear complex...' -> '...it remains unclear whether complex...' Response: We have rewritten the Significance (now it is Synopsis).
Introduction: 2. 'temporal dynamics of NFkB' - it would be good to be more concrete regarding the temporal dynamics of what aspect of this (expression, binding, conformation, etc), if possible. Response: It refers to the presence of NFκB into nucleus, which represents active NFκB capable of activating gene expression. We have clarified this (Lines 59-61 in introduction paragraph 2). “Upon stimulation, NFκB translocates into the nucleus, … activating immune gene expression (10, 15–19).”
'signaling codons' - the behaviour of these is key to the entire paper, so even if they are well described in the reference, it would be good to have a short description as early as possible so that the reader can get an idea in their mind what exactly is being discussed here. Later, it would be good to have concrete description of exactly what these capture.
Response: We thank the reviewer for this comment. We have added one whole paragraph in the early introduction to describe the concept of Signaling Codons which allow quantitative characterization of NFkB stimulus-response-specific dynamics (Lines 60-67). We have also added more concrete description of Signaling Codons in the results as well as adding an illustration for the signaling codons (Lines 169-175, Figure S2B).
'This challenge...population of macrophages' - this seems a bit out of place, and is a bit of a run on sentence, so I suggest moving this to the next paragraph and working it into the first sentence there '...regulatory mechanisms, and this challenge could be addressed with a model parameterised to account for heterogeneous...Early models ...', or something similar.
Response: We thank the reviewer for this suggestion, we have revised this as suggested. This improves the logic flow (Lines 87-88).
Ref 25: I can't find a paper with this title anywhere, so if it's an accepted preprint then it would be good to have this available as well. That said, I still think it would be difficult to grasp the work done in this paper without some description of the mathematical model here, at least schematically, if not the full set of ODEs. For example, there are numerous references to how this incorporates heterogeneous responses, the 'core module', etc, and the reader has no context of these if they aren't familiar with the structure of the model. Response: We apologize that Ref 25 was not on PubMed. Now it’s published, and we have updated the corresponding information. This comment also helped us to improve the writing by adding a description of the mathematical model in the Introduction (Lines 95-105), the results (Lines 129-141), and a detailed description of the model in the Methods (Simulation of heterogenous NFκB dynamical responses.)
We have also added the schematic of the model topology in Figure S1 (adapted from previous publications Guo et al 2025, Adelaja et al 2021) to make sure the paper is self-contained.
'A key challenge which is...' -> 'A key challenge is...' Response: We have revised the Introduction and removed this sentence.
'With model simulation ...' -> a bit of a run on sentence, I suggest breaking after 'conditions'. Response: We have revised the introduction and removed this sentence.
Results:
“This mechanistic model was trained on single-ligand response experimental datasets, capturing the single-ligand stimulus-response specificity of the population of macrophages while accounting for cellular heterogeneity. Specifically, quantitative NFκB dynamic trajectory data from hundreds of single macrophages responding to five single ligands (TNF, pIC, Pam, CpG, LPS) at 3-5 doses was obtained from live cell imaging experiments. The mathematical model (Figure S1) consists of a 52-dimensional system of ordinary differential equations, including 52 intracellular species, 101 reactions and 133 parameters, and is divided into five receptor modules, which respond to the corresponding ligands respectively, and the IKK-NFκB core module that contains the prominent IκBα negative feedback loop. By fitting the single-cell experimental data set with a non-linear mixed effect statistical model (coupling with 52-dimensional NFκB ODE model), the parameter distributions for the single-cell population were inferred. Analyzing the resulting simulated NFκB trajectories with Information theoretic and machine learning classification analyses confirmed that the virtual cell model simulations reproduced key SRS performance characteristics of live macrophages.”
'..mechanistic model was trained...' - trained in this study, or in the previous referenced study? Response: The mechanistic model was trained in a previous study (Guo et al 2025 Nature Comm), and we have clarified this in the revision (Lines 127 - 129).
“The ODE model was then fitted to the population of single-cell trajectories to recapitulate the cell-to-cell heterogeneity in the experimental data (2). This is achieved by solving the non-linear mixed effects model (NLME) through stochastic approximation of expectation maximation algorithm (SAEM) (3–6). Seventeen parameters were estimated. Within the core module, the estimated parameters included the rates governing TAK1 activation (k52, k65), the time delays of IκBα transcription regulated by NFκB (k99, k101), and the total cellular NFκB abundance (tot NFκB). Within the receptor module, receptor synthesis rates (k54 for TNF, k68 for Pam, k85 for CpG, k35 for LPS, k77 for pIC), degradation rates of the receptor–ligand complexes (k56, k61, k64 for TNF; k75 for Pam; k93 for CpG; k44 for LPS; k83 for pIC), and endosomal uptake rates (k87 for CpG; k36 and k40 for LPS; k79 for pIC) were fitted. All remaining parameters were fixed at literature-suggested values (1). The single-cell parameters inferred from experimental individual‐cell trajectories then served as empirical distributions for generating the new dataset (see SupplementaryDataset2).”
'matching cells with similar core model...' - it's difficult to follow the logic as to why this is done, so I think this needs to be a little clearer. My guess would be that the assumption is that simulated cells with similar 'core' parameters have a similar downstream signalling response, and therefore the receptors can be 'transplanted'. So it would be nice to see exactly what these distributions are and what the effect of a bad match would be. Response: We thank the reviewer for this comment. In the revision, we have explained the rationale for matching cells with similar core module (Lines 145-152).
“Previous work determined parameter distributions for only the cognate receptor module (and the core module) that provided the best fit for the relevant single ligand experimental data (Figure 1A, Step 1), but other receptor modules’ parameter values were not determined. To simulate stimulus responses to more than two ligands, we imputed the other ligand-receptor module parameters using shared core-module parameters as common variables and employing nearest-neighbor hot-deck imputation (35). In this setup, the core module functions as an “anchor” to harmonize two or more receptor-specific parameter distributions.”
This nearest-neighbor hot-deck imputation approach (the core module matching method) was shown to outperform other approaches, including random matching and rescaled-similarity matching (Guo et al. 2025, Supplementary Figure S11). For the reviewer’s convenience, we have also appended the corresponding figure below.
Figure S11 from (Guo et al., 2025). Assessment of matching techniques for predicting single-cell responses to various ligand stimuli (a-d). Heatmaps illustrating the Wasserstein distance between the signaling codon distributions predicted by the model and those observed in experiments. The analysis employs four distinct matching methods to align the five ligand-receptor module parameters: (a) “Random Matching”, (b) “Similarity Matching” (the method used in our study), (c) “Rescaled-Similarity Matching”, and (d) “Sampling Approximated Distribution”. In the heatmaps, rows represent signaling codons, columns denote ligands, and the color intensity indicates the Wasserstein distance, providing a visual metric of similarity between model predictions and experimental data. e-f. Histogram of the average Wasserstein distance between the model-predicted and experimentally observed signaling codon distributions, summarized across signaling codons (e) and ligands (f).
Some explanation of how this relates to the experimental data the parameters are fit on would also be useful. (a) Is there a correspondence between individual simulated cells and the experimental data for the single ligand stimulation, and then the smallest set of these is taken? Is there also a matching from the simulated multi-receptor modules and the multi-receptor data, and if so, is this done in the same way? Response: This comment to help us clarify the correspondence relationship between model simulations and experimental data.
Yes—there is a correspondence between individual simulated cells and the previously published experimental data (Guo et al., 2025b) for single-ligand stimulation. We have revised the first paragraph of the Results (Lines 136–148) and the Methods (Lines 544-557) to clarify how the model simulations were fit to the previous experimental dataset. See Reviewer 1, Comments 10 for the updates in Methods. We have pasted in the revised Results section below for the reviewer’s reference.
“By fitting the single-cell experimental data set with a non-linear mixed effect statistical model (coupling with 52-dimensional NFκB ODE model), the parameter distributions for the single cell population were inferred.”
'six signaling codons' - here it would be good to recapitulate what these represent, but also what the 'strength' and 'activity' correspond to (total integrated value, maximum value, etc) Response: We thank the reviewer for the suggestion and have clarified this point (Lines 169-175, Figure S2B).
'pre-defined thresholds' - no need to state these numerically in the text (although giving some sense of how/why these were chosen would give some context), but I couldn't find the values of these, nor values corresponding to the signaling codons. Response: We appreciate the reviewer’s comment. We have added this information in the figure legend (Figure 1B-C) and Method -- “Responder fraction” (Lines 666-672). Specifically, for the model simulation data, the integral thresholds are 0.4 (µM·h), 0.5 (µM·h), and 0.6 (µM·h). The peak thresholds are 0.12 (µM), 0.14 (µM), and 0.16 (µM). For the experimental data, the integral thresholds are 0.2 (A.U.·h), 0.3 (A.U.·h), and 0.4 (A.U.·h). The peak thresholds are 0.14 (A.U.), 0.18 (A.U.), and 0.22 (A.U.). Thresholds were selected so that the medium threshold yields 50% responder cells under single-ligand conditions, while the responder ratio remains unsaturated under three-ligand stimulation.
'non-responder cells are likely a result of cellular heterogeneity in receptor modules rather than the core module' - is this the 'ill health' referenced earlier? If so make this clear. Response: Yes, this is the ‘ill health’ referenced earlier, and we have clarified this (Lines 198-199).
It's also very difficult to follow this chain of logic, given that the reader at this point doesn't have any knowledge of what the 'core' module is, nor the significance of the thresholds on the signaling codons. I would suggest making this much clearer, with reference to each of these. Response: We apologize for the poor explanation. We have now explained in the Introduction (Lines 95-106) and the results (Lines 129-141) how the model is structured into receptor-proximal modules that converge on the common core module. We have also added a schematic for clarity (Figure S1). For further clarification of the math models, we have significantly revised the Methods (Simulation of heterogenous NFκB dynamical responses). The defined thresholds are clarified in the Methods -- “Responder fraction”.
'...but the model represented these as independent mass action reactions' - the significance of this may not be clear to someone not familiar with biophysical models, so probably better to make it explicit. Response: We thank the reviewer for this reminder, and we have added a description of the significance of this point (Lines 225-227).
'...we trained a random forest classifier...' - is this trained on the 'raw' experimental time series data, or on the signaling codons? Response: It is trained on the signaling codons calculated from model simulations of NFκB trajectories. We have clarified this (Lines 260-261).
'We also applied a Long Short-Term Memory (LSTM) machine learning model...' - it might be good to reference these three approaches at the beginning of this section, otherwise they seem to come out of the blue a little. Response: We have added the references of these three approaches in the beginning of this section (Lines 242-246).
'We then used machine learning classifiers...' - random forests, LSTMs, or a different model? Response: We have clarified that this as random forest classifier (Line 276).
Discussion:
'We found that endosomal transport...' - A paper by Huang, et. al. (https://www.jneurosci.org/content/40/33/6428) observed a synergistic phagocytic response between CpC and pIC stimulation in microglia. This is still consistent with a saturation effect dependent on dose, but may be worth a mention. Response: We thank the reviewer for referring this interesting paper to us, and this comment helps us to improve the Discussion of inflammatory signaling pathways besides NFκB. This paper demonstratessynergistic effects between CpG and pIC in inhibiting tumor growth and promoting cytokine production(Huang et al., 2020), such as IFN-β and TNF-α, whose expression is also regulated by the IRF and MAPK signaling pathways (Luecke et al., 2021; Sheu et al., 2023). This finding does not contradict our findings that CpG and pIC act antagonistically in the NFκB signaling pathway because of the combinatorial pathways that act on gene expression: CpG can activate the MAPK signaling pathway (Luecke et al., 2024) but not the IRF signaling pathway, whereas pIC activates the IRF signaling pathway (Akira and Takeda, 2004) but only weakly the MAPK pathway. Therefore, their combination can synergistically regulate inflammatory responses. We have added this to the discussion (Lines 515-522).
'...features termed...' -> 'features, termed' Response: We thank the reviewer for their carefully reading, and we have rewritten the Discussion.
'...we applied a Long Short-Term Memory (LSTM) machine learning model..' - maybe make clear that this is on the time-series data (also LSTM has already been defined). Response: We thank the reviewer for their carefully reading, and we have rewritten the Discussion.
Materials and methods:
'sampling distribution' - not clear what this refers to in this context Response: We have clarified this in the revision (Methods -- Simulation of heterogenous NFκB dynamical responses, paragraph 3). “The single-cell signaling-pathway parameter values used for bootstrapping sampling to generate model simulations are given in Supplementary dataset 2.”
'RelA-mVenus mouse strain' - it would be good to mention the relevance of the reporter for NFkB signaling Response: We have added the relevance of the reporter for NFkB signaling (Methods, Lines 624-626).
'...A random forest classifier...' -> a random forest classifier
Response: We have rewritten the methods.
Significance
This study provides mechanistically interpretable insight on the important question of how immune cells perform target recognition in realistic scenarios, and also provides validation of existing mathematical models by extending these beyond their original domain. The paper uses 'signaling codons' as a proxy for information processing, however in this instance it is cross-validated with an LSTM model that is applied directly to the time series data. Nevertheless, the scope of the paper is such that it does not deal with the question of how these signals are transmitted or used in a downstream immune response. To my knowledge, this is the first time that a well established existing mathematical model of signalling response has been extended and applied to heterogeneous ligand mixtures. These results will be of interest to those studying immune cell responses, and to those interested in basic research on mathematical models of signaling and cellular information processing more generally.
My background is in biophysical models, machine learning, and signaling in cancer. I have a basic understanding of immunology, but no experience in experimental cell biology.
Response: We thank the reviewer for highlighting the novelty of our study. We appreciate the reviewer’s recognition that our work advances the understanding of cellular information processing in the context of ligand mixtures, particularly as the first to extend computational models to investigate signaling fidelity under mixed-ligand conditions.
We agree that this work will interest computational biologists focused on signaling network modeling and information processing. In addition, we believe it will also be valuable for all signaling biologists, as we provide fundamental insights. For experimental biologists in particular, our model provides an efficient, quantitative framework for exploring and generating testable hypotheses.
We would also like to gently emphasize that evaluating specificity within signaling pathways is as essential as studying downstream functional responses. While immune function outcomes are certainly important, they rely on the upstream signaling pathways that first respond to environmental cues. Understanding how these signaling pathways achieve specificity and discriminability is therefore crucial. For example, this is particularly relevant for drug development targeting pathways such as NFκB, where assessing the direct signaling output—NFκB activation dynamics—can provide valuable insight into the effects of pharmacological interventions.
Reviewer #2
Evidence, reproducibility and clarity
Guo et al. developed a heterogeneous, single-cell ODE model of NFκB signaling parameterized on five individual ligands (TNF, Pam, LPS, CpG, pIC) and extended it, via core-module parameter matching, to predict responses to all 31 combinations of up to five ligands. They found that simulated responder fractions and signaling codon features generally agreed with live-cell imaging data. A notable discrepancy emerged for the CpG (TLR9) + pIC (TLR3) pair: experiments exhibited non-integrative antagonism unpredicted by the original model. This issue was resolved by incorporating a Hill-type term for competitive, limited endosomal trafficking of these ligands. Finally, by decomposing NFκB trajectories into six "signaling codons" and applying Wasserstein distances plus random-forest and LSTM classifiers, the authors showed that stimulus-response specificity (SRS) declines with ligand complexity but remains statistically significant even for quintuple mixtures. This is a well written and scientifically sound manuscript about complexities of cellular signaling, especially considering the limitations of in vitro experiments in recapitulating in vivo dynamics.
Response: We thank the reviewer for carefully reading the manuscript and for this endorsement. We have significantly improved the manuscript thanks to the reviewer’s insightful comments (see below for point-to-point responses).
Besides addressing the reviewer’s questions, we have further extended our work to investigate how ligand pairs interact across all doses and how those interactions affect stimulus-response specificity. As the reviewer pointed out, experimental studies are limited in recapitulating the multitude of complex physiological contexts. The model is helpful to explore more complex scenarios beyond the feasibility of in-vitro experimental setups. Using computational simulations, we have further explored 360 conditions generated from 10 ligand pairs, each evaluated at 6 doses spanning non-responsive to saturating levels, and with each condition considered 1000 cells to capture the heterogeneity of the population.
From this extended analysis, we identified the mechanistic bases for observations of both synergy and antagonism. Synergy for certain low-dose ligand combinations can be explained by ultrasensitive IKK activation (Figure 4), while antagonism between LPS and Pam arises from competition for the cofactor CD14 (Figure 5). We show that these phenomena are dependent on the signaling network state and therefore are not observed in all cells of the population. We define the network conditions that must be met for antagonism and synergy to occur. Importantly, we then show that antagonism can contribute to stimulus-response specificity in ligand mixtures (Figure 5).
Here are a few comments and recommendations:
Response: We thank the reviewer for this comment, this helped us improve the explanation of the methodology, the rationale, and the validation. The methodology is based on the well-established statistical method of nearest-neighbor hot-deck imputation (Andridge and Little, 2010). In this implementation, the core module functions as a stabilizing “anchor” (common variables) to harmonize various receptor-specific parameter distributions. Similar methodologies have been successfully applied to correct batch effects or integrate single-cell RNAseq datasets using anchor cell types (Stuart et al., 2019). Our workflow has been validated on single-ligand stimuli conditions in a previous study (Guo et al., 2025) (See below 3rdparagraph). Here, we used this method to generate predictions for ligand mixtures and have validated them with experimental studies of the dual-ligand stimuli, and we found that our predictions align well with the experimental data. As the reviewer suggested in point 3, in the revision, we also added experimental validation on the binary classifiers of macrophage determines whether specific stimuli are presented in the ligand mixture. The question we are interested in in this work is how macrophage process ligand-specific information in the context of ligand mixtures. For this question, the experimental results align with the model predictions, reaching consistent conclusions.
In the revision, we have explained the rationale for using the nearest-neighbor hot-deck imputation by matching cells with similar core module (Lines 143-150).
“Previous work determined parameter distributions for only the cognate receptor module (and the core module) that provided the best fit for the single ligand experimental data (Figure 1A, Step 1), and other receptor modules parameter information is missing. To simulate stimulus responses to more than two ligands, we imputed the other ligand–receptor module parameters using shared core-module parameters as common variables and employing nearest-neighbor hot-deck imputation (35). In this setup, the core module functions as an “anchor” to harmonize two or more receptor-specific parameter distributions. This was achieved by by minimizing Euclidean distance between the core module parameters associated with the independently parameterized single-ligand models (Figure 1A, Step 2). ”
In Guo et al. (2025) (see Supplementary Figure S11), the nearest-neighbor hot-deck imputation approach (core module similarity matching method) was compared with other approaches, including random matching and rescaled-similarity matching. The results show that, after matching, the core module method best preserves the single-ligand stimulus signaling codon distributions. For the reviewer’s convenience, we have also appended the figure in the response to Reviewer 1, Comment 11.
The advantage of our workflow is that it does not need to be fit to new experimental data and still gives reliable predictions on signaling dynamics. For the reviewer’s interest, we have tried to fit core-matched single cell models with two receptor modules. As fitting parameters require sufficiently large and high-quality datasets, single-ligand stimulation data with more than 1,000 cells can be adequate to estimate 6~7 parameters (Guo et al., 2025) (approx. 1400 cells to 2000 cells per ligand). However, our current experimental dataset for combinatorial-ligand conditions contains only 500~1,000 cells, and we have tested these datasets but results show a poor fit of heterogeneous signaling dynamics. This is due to an insufficient number of cells for estimating 8~10 parameters. We estimate that at least ~1,500 cells would be needed for reliable parameter estimation under dual-ligand stimulation (and more cells may be needed for combinatorial ligand stimuli involving more ligands). This is currently not feasible to obtain for mixed ligands given the large number of combinatorial conditions.
Overall, in this paper, the nearest-neighbor hot-deck imputation approach is presented as a feasible and acceptable approach that best reflects our current understanding of the signaling network. Importantly, it helps identify potential gaps by highlighting discrepancies between model predictions and experimental observations.
(a) The refined model posits competitive, saturable endosomal transport for CpG and pIC, but no direct measurements of endosomal uptake rates or compartmental saturation thresholds are provided, leaving the Hill parameters under-constrained. The authors could produce dose-response curves for CpG and pIC individually and in combination across a range of concentrations to fit the Hill parameters for competitive uptake. (b) If this is out of scope for this paper, the authors should at least comment on why the endosome hypothesis is better than others e.g. crosstalks and other parallel pathway activations. Especially given that even the refined model simulations with Hill equations for CpG and pIC do not quite match with the experimental data (Fig 2 B,E).
Response: (a) The reviewer’s comments helped us to improve our work by employing the Michaelis-Menten Kinetics for substrate competition reactions, which increases the mathematic rigor of the CpG-pIC competition model. In this updated model, there is no free parameters to tune, as all the Vmax, Kd, should be consistent with the single-ligand scenario. And the Hill is same as single-ligand case, equal to 1.
The comments on examining dose-response curves for CpG and pIC inspired us to extend the dose-response curves for all ligand pair combination, allowing us to identify the synergy in low-dose ligand pairs and antagonism for high-dose LPS-Pam, besides CpG-pIC (new Figure 4 & 5).
(b) Regarding alternative hypotheses for antagonism—such as crosstalk or parallel-pathway activation: any antagonistic effect would have to arise from negative regulation acting within the first 30 min. However, IκBα-mediated feedback only becomes appreciable after ~30 min (Hoffmann et al., 2002), and A20-dependent attenuation requires ≥2 h (Werner et al., 2005). Beyond these delayed feedback, NFκB activation depends primarily on phosphorylation and K63-linked ubiquitination, for which no mechanism produces true antagonism; at most, combinatorial inputs saturate the response to the level of the strongest single ligand. We have added this rationale to the Discussion to explain why we favor the endosome saturation hypothesis over other mechanisms (Lines 459-465). While this may not capture every nuance, it represents the simplest model extension capable of reproducing the observed antagonism.
Authors asses the distinguishability of single-ligand stimuli and combinatorial ligands stimuli using the simulations from the refined model. While this is informative, the simulated data could propagate deviations from the experimental data to the classifiers. How would the classifiers fare when the experimental data is used to assess the single-stimulus distinguishability? The authors could use the experimental data they already have and confirm their main claim of the paper, that cells retain stimulus-response specificity even with multiple ligand exposure. In short, how would Fig 3E look when trained/validated on available experimental data?
Response: We thank the reviewer’s valuable comments, and they helped us strengthen the rigor of our analysis by incorporating cross-model testing. Specifically, we refined our analysis of ligand presence/absence classification by including ROC AUC and balanced accuracy metrics. This adjustment accounts for the fact that the experimental data did not cover all combinatorial conditions, thereby mitigating potential biases from data imbalance and threshold choice. The experimental results are qualitatively consistent with the simulations, though—as expected—they show somewhat lower ligand distinguishability compared to the noise-free simulated dataset. We have updated Figures 3E–F (previously Figure 3E), added Figure S8, and revised the manuscript accordingly (Lines 292–301). For the reviewer’s convenience, we have also pasted in the revised manuscript text below.
“Classifiers trained to distinguish TNF-present from TNF-absent conditions achieved a Receiver Operating Characteristic-Area Under the Curve (ROC AUC) of 0.96, significantly above the 0.5 baseline (Figure 3D, Figure S8A). Extending this analysis to other ligands, cells detected LPS (0.85), Pam (0.84), pIC (0.73), and CpG (0.63) in mixtures (Figure 3D, S8A). Using experimental data from double- and triple-ligand stimuli (Figure 1D), ROC AUC values were TNF 0.74, LPS 0.74, Pam 0.66, pIC 0.75, and CpG 0.66 (Figure 3E, S8B). Classifier accuracies yielded consistent results (Figure S8C-D). These results indicated a remarkable capability of preserving ligand-specific dynamic features within complex NFκB signal trajectories that enable nuclear detection of extracellular ligands even in complex stimulus mixtures.”
While the approach of presented here with multiple simultaneous ligand exposures is a major step towards the in vivo-like conditions, the temporal aspect is still missing. That is, temporal phasing i.e. sequential exposure to multiple ligands as one would expect in vivo rather than all at once. This is probably out of scope for this paper but the authors could comment how how their work could be taken forward in such direction and would the SRS be better or worse in such conditions. Response: We thank the reviewer for this insightful comment. We have added “the temporal aspect of multiple ligand exposures” to the discussion (Lines 503-510), and we pasted the corresponding paragraph here for reviewer’s references (black fonts are previous version, and blue fonts is the revised new texts):
“Cells may be expected to interpret not only the combination of signals but also their timing and duration to mount appropriate transcriptional responses (58, 59). For example, acute inflammation integrates pathogen-derived cues with pro- and anti-inflammatory signals over a timeframe of hours to days (58), to coordinate the pathogen removal and tissue repairing process. Investigating sequential stimulus combinations in our model is therefore crucial for understanding how cells process complex physiological inputs. Simulations that account for longer timescales may require additional feedback mechanisms, as described in some of our previous studies for NFκB (15, 60). ** ”
There is no caption for Figure 3F in the figure legend nor a reference in the main text.
Response: In the revised manuscript we actually removed Figure 3F.
Significance
General assessment: This is a good manuscript in it's present form which could get better with revision. There needs more supporting data and validation to back the main claim presented in the manuscript.
Significance/impact/readership: When revised this manuscript could be of interest to a broad community involving single cells biology, cell and immune signaling, and mathematical modeling. Especially the models presented here could be used a starting point to more complex and detailed modeling approaches.
Response: We thank the reviewer for this endorsement. The reviewer’s constructive suggestion helped us significantly improve the clarity and rigor of our main conclusion.
In summary, we have strengthened the computational framework in several ways. We improved the model’s fit to experimental single-ligand training data and reformulated the antagonistic CpG-pIC model using Michaelis–Menten kinetics, thereby reducing parameter arbitrariness and increasing mechanistic interpretability. These changes led to better agreement between model predictions and experimental observations for combinatorial ligand responses (Updated Figure 2 and Figure S2), which we hope will further increase experimentalists’ confidence in the modeling results. We have also validated one key conclusion (“cells retain stimulus-response specificity even with multiple ligand exposure”) using the experimental dataset, and it aligns with the model predictions.
In addition, we have further extended our analysis and the scope. Inspired by the reviewer’s advice (and Reviewer 3’s comment 1b) on dose-combination study for CpG-pIC pair, we expanded our research to dose-response relationships for all dual-ligand combinations (Lines 302-406, Figure 4-5). This additional comprehensive analysis allowed us to identify the mechanism of synergistic and antagonistic effects in single-cell responses and to pinpoint the corresponding dose ranges among different ligand pairs.
Interestingly, we found that IKK ultrasensitive activation may lead to low-dose ligand combinations synergistic response for single cells. We also found that CD14 uptake competition between LPS and Pam may lead to antagonistic/non-integrative combination. Our simulation-based finding of non-integrative combination of LPS-Pam stimuli aligns with previous independent experimental finding of non-integrative response for LPS and Pam combination (Kellogg et al., 2017), and this independent experimental study validated our model prediction.
We further analyzed stimulus-response specificity under conditions predicted to exhibit synergy or antagonism. Our results indicate that antagonistic combinations of ligands can increase stimulus-response specificity in the context of ligand mixtures.
Reviewer #3
Evidence, reproducibility and clarity
The authors investigate experimentally single macrophages' NF-kB responses to five ligands, separately and to 3 pairs of ligands. Using the single ligand stimulations, they train an existing mathematical model to replicate single-cell NF-kB nuclear trajectories. From what I understand, for each single cell trajectory in response to a given ligand, the best fit parameters of the core module and the receptor module (specific for the given ligand) are found.
Then (again, from what I understand), single ligand models are used to generate responses to combinations of ligands. The parametrizations of single ligand models (to be combined) are chosen to have the most similar core modules. It is not described how the responses to more than one ligand are calculated - I expect that respective receptor modules work in parallel, providing signals to the core module. After observing that the response to CpG+pIC is lower (in terms of duration and total) than for CpG alone, the model is modified to account for competition for endosomal transport required by both ligands.
Having the trained model, simulations of responses to all 31 combinations of ligands are performed, and each NF-κB trajectory is described by six signaling codons-Speed, Peak, Duration, Total, Early vs. Late, and Oscillations. Next, these codons are used to reconstruct (using a random forest model) the stimuli (which may be the combination of ligands). The single and even the two ligand stimuli are relatively well recognized, which is interpreted as the ability of macrophages to distinguish ligands even if present in combination.
We thank the reviewer for careful reading of the manuscript.
Major comments
1) The demonstrated ability to recognize stimuli is based on several key assumptions that can hardly be met in reality.
Response: We thank the reviewer for this comment, which prompted us to carefully reflect on the rigor of our work, inspired us to extend our analysis to a broad range of ligand-dose combinations, and helped us improve clarifying the limitations of our approach. Please see our detailed responses below.
a) The cell knows the stimulation time, and then it can use speed as a codon. Look on fig. S4A: The trajectories in response to plC are similar to those in response to TNF, but just delayed. Response: We thank the reviewer for this comment. We updated the model parameterization to better fit to the single-ligand pIC condition (Lines 557-559). In the updated model, the simulated responses to TNF and pIC are quite different (Fig. S2A-B, Fig. S5A-B). Specifically, the Peak, Duration, EarlyVsLate, and Total signaling codons have different values. In addition, the literature suggests that timing difference of NFκB activation are sufficient to elicit differences in downstream gene expression responses, especially for the early response genes (ERG) and intermediate response genes (ING) (Figure 1 in Ando, et al, 2021). For reviewer’s convenience, we have also appended the figures. Specifically, within the first 60 minutes, ctrl exhibit higher Speed of NFκB activation, and the NFκB regulated ERG and ING show differences in the first 60 minutes (Below Fig 1a,b). Ando et al then identified the gene regulatory mechanism that is able to distinguish between differences in the Speed codon. Importantly, this mechanism does not require knowledge of t=0, i.e. when the timer was started.
The signaling codon Speed, which is based on derivatives, is one way to quantify such timing differences in activation. It was selected from a library of more than 900 different dynamic features using an information maximizing algorithm (Adelaja et al., 2021). It is possible that other ways of measuring time, e.g. time to half-max, might not be distinguished that well by these regulatory mechanisms.
b) The increase of stimulus concentration typically increases Peak, Duration, and Total, so a similar effect can be achieved by changing the ligand or concentration. Response: This (“the increase of stimulus concentration typically increases Peak, Duration, and Total”) is not an assumption. What the reviewer described (“a similar effect can be achieved by changing the ligand or concentration”) may occur or may not. The six informative signaling codons can vary under different ligands or doses. For example, with increasing doses of Pam, the NFκB response shows a higher peak, potentially making it appear more like LPS stimulation. However, as the Pam dose increases, the response duration decreases, which distinguishes it from LPS stimulation (See experimental data shown in Figure 4A, second row, and Figure 3A, second row in Luecke et al., (2024), we also pasted the corresponding figure below for reviewer’s convenience).
Figure 4A and Figure 3A from Luecke et al., (2024). Figure 4A: NFκB activity dynamics in the single cells in response to 0, 0.01, 0.1, 1, 10, and 100 ng/ml P3C4 stimulation. Eight hours were measured by fluorescence microscopy of reporter hMPDMs. Each row of the heatmap represents the p38 or NFκB signaling trajectory of one cell. Trajectories are sorted by the maximum amplitude of p38 activity. Data from two pooled biological replicates are depicted. Total # of cells: 898, 834, 827, 787, 778, and 923. Figure 3A: NFκB activity dynamics in the single cells in response to 100 ng/ml LPS stimulation. Eight hours were measured by fluorescence microscopy of reporter hMPDMs. Each row of the heatmap represents the NFκB signaling trajectory of one cell (with p38 measured shown in the original paper). Trajectories are sorted by the maximum amplitude of p38 activity. Data from two pooled biological replicates are depicted.
Inspired by the reviewer’s comment (and also Reviewer 2’s comments), in the revision, we expanded our research to dose-response relationships for all dual-ligand combinations (Lines 302-406, Figure 4-5). This additional comprehensive analysis allowed us to identify the mechanism of synergistic and antagonistic effects in single-cell responses and to pinpoint the corresponding dose ranges among different ligand pairs.
Interestingly, we found that IKK ultrasensitive activation may lead to synergistic responses to low-dose ligand combinations but only in a subset of single cells. We also found that CD14 uptake competition between LPS and Pam may lead to antagonistic/non-integrative combination. Our simulation-based finding of non-integrative combination of LPS-Pam stimuli aligns with previous independent experimental findings of non-integrative response for LPS and Pam combination (Kellogg et al., 2017).
c) Distinguishing a given ligand in the presence of some others, even stronger bases, on the assumption that these ligands were given at the same time, which is hardly justified. Response: We agree with the reviewer that ligands could be given at different times. Considering time delays between ligands (the inset and also removal) dramatically adds to the combinatorial complexity. Some initial studies by the Tay lab are beginning to explore some scenarios of time-shifted ligand pairs (Wang et al 2025). Here we focus on a systematic exploration of all ligand combinations at 6 different doses. The fact that we do not consider time delays is not an assumption but admittedly a limitation that may well be addressed in future studies. We have included a brief discussion of this issue in the discussion (Lines 503-514). We’ve appended here for reviewer’s convenience.
“Cells may be expected to interpret not only the combination of signals but also their timing and duration to mount appropriate transcriptional responses (Kumar et al., 2004; Son et al., 2023). For example, acute inflammation integrates pathogen-derived cues with pro- and anti-inflammatory signals over a timeframe of hours to days (Kumar et al., 2004), to coordinate the pathogen removal and tissue repairing process. Investigating sequential stimulus combinations in our model is therefore crucial for understanding how cells process complex physiological inputs. Simulations that account for longer timescales may require additional feedback mechanisms, as described in some of our previous studies for NFκB (Werner et al., 2008, 2005). ”
We would like to suggest that despite (or maybe because) limiting our study to coincident stimuli, we made some noteworthy discoveries.
2) For single ligands, it would be nice to see how the random forest classifier works on experimental data, not only on in silico data (even if generated by a fitted model).
Response: This comment and Reviewer 2 comment 3 have helped us strengthen the rigor of our analysis by incorporating cross-model testing. We pasted the response below.
Specifically, we refined our analysis of ligand presence/absence classification by including ROC AUC and balanced accuracy metrics. This adjustment accounts for the fact that the experimental data did not cover all combinatorial conditions, thereby mitigating potential biases from data imbalance and threshold choice. The experimental results are qualitatively consistent with the simulations, though—as expected—they show somewhat lower ligand distinguishability compared to the noise-free simulated dataset. We have updated Figures 3E–F (previously Figure 3E), added Figure S8, and revised the manuscript accordingly (Lines 292–301). For the reviewer’s convenience, we have also included the revised manuscript text below.
“Classifiers trained to distinguish TNF-present from TNF-absent conditions achieved a Receiver Operating Characteristic-Area Under the Curve (ROC AUC) of 0.96, significantly above the 0.5 baseline (Figure 3D, Figure S8A). Extending this analysis to other ligands, cells detected LPS (0.85), Pam (0.84), pIC (0.73), and CpG (0.63) in mixtures (Figure 3D, S8A). Using experimental data from double- and triple-ligand stimuli (Figure 1D), ROC AUC values were TNF 0.74, LPS 0.74, Pam 0.66, pIC 0.75, and CpG 0.66 (Figure 3E, S8B). Classifier accuracies yielded consistent results (Figure S8C-D). These results indicated a remarkable capability of preserving ligand-specific dynamic features within complex NFκB signal trajectories that enable nuclear detection of extracelular ligands even in complex stimulus mixtures.”
3) My understanding of ligand discrimination is such that it is rather based on a combination of pathways triggered than solely on a single transcription factor response trajectory, which varies with ligand concentration and ligand concentration time profile (no reason to assume it is OFF-ON-OFF). For example, some of the considered ligands (plC and CpG) activate IRF3/IRF7 in addition to NF-kB, which leads to IFN production and activation of STATs. This should at least be discussed.
Response: We thank the reviewer for this comment and fully agree. In the previous version, we discussed different signaling pathways combinatorically distinguishing stimulus. In the revision, we have extended this discussion to include the example of pIC and CpG activation, as suggested (Lines 515-522). We pasted the corresponding text below.
“Furthermore, innate immune responses do not solely rely on NFκB but also involve the critical functions of AP1, p38, and the IRF3-ISGF3 axis. The additional pathways are likely activated in a coordinated manner and provide additional information (Luecke et al., 2021). This is exemplified by the studies demonstrating synergistic effects between CpG and pIC in inhibiting tumor growth and promoting cytokine production (Huang et al., 2020), such as IFNβ and TNFα, whose expression is also regulated by the IRF and MAPK signaling pathways (Luecke et al., 2021; Sheu et al., 2023). Therefore the inclusion of parallel pathways of AP1 and MAPK, as well as the type I interferon network (Cheng et al., 2015; Davies et al., 2020; Hanson and Batchelor, 2022; Luecke et al., 2024; Paek et al., 2016; Peterson et al., 2022) are next steps for expanding the mathematical models presented here.”
Technical comments
1) Reference 25: X. Guo, A. Adelaja, A. Singh, W. Roy, A. Hoffmann, Modeling single-cell heterogeneity in signaling dynamics of macrophages reveals principles of information transmission. Nature Communications (2025) does not lead to any paper with the same or a similar title and author list. This Ref is given as a reference to the model. Fortunately, Ref 8 is helpful. Nevertheless, authors should include a schematic of the model.
Response: We apologize for the paper not being accessible on time. It is now. We have also added a schematic of the model as suggested (Figure S1) and have added detailed description of the model and simulations in introduction (Lines 95-106), results (Lines 129-141), and methods (Simulation of heterogenous NFκB dynamical responses).
2) Also Mendeley Data DOI:10.17632/bv957x6frk.1 and GitHub https://github.com/Xiaolu-Guo/Combinatorial_ligand_NFkB lead to nowhere.
Response: We thank the reviewer for this comment, and we have made the GitHub codes public. Mendeley Data DOI:10.17632/bv957x6frk.1 can be accessed via the shared link: https://data.mendeley.com/preview/bv957x6frk?a=6d56e079-d7b0-482e-951f-8a8e06ee8797
and will be public once the paper accepted.
3) Dataset 1 is not described. Possibly it contains sets of parameters of receptor modules (different numbers of sets for each module, why?), but the names of parameters never appear in the text, which makes it impossible to reproduce the data.
Response: We thank the reviewer for this comment, and we have added the description of the dataset (S3 SupplementaryDataset2_NFkB_network_single_cell_parameter_distribution.xlsx) and added the parameter names in the methods (Simulation of heterogenous NFκB dynamical responses).
4) It is difficult to understand how the simulations in response to more than one ligand are performed.
Response: We thank the reviewer for this comment, and we have improved the explanation of the methods (Results, Lines 145-152) and included a detailed description of the model and simulations for combinatorial ligands (Methods, Predicting heterogeneous single-cell responses to combinatorial-ligand stimulation).
Significance
A lot of work has been done, the methodology is interesting, but the biological conclusions are overstated.
Response: We thank the reviewer for their interest in the methodology. We have revised the title, the abstract, and added the discussion about our finding to more accurately document what we have found. In the revision, we have increased the clarity and rigor of the work. For the key conclusion that macrophages maintain some level of NFκB signaling fidelity in response to ligand mixtures, we have validated the binary classifier results on experimental data as reviewer suggested.
In the revision, we have also extended our methodology to explore further, the dose-response curves for different dosage combination for ligand pairs. This further work allowing us identified the synergistic and antagonistic regimes. By comparing the stimulus response specificity for antagonistic model vs the non-antagonistic model, we demonstrated that signaling antagonism may increase the distinguishability of presence or absence of specific ligands within complex ligand mixtures. This provides a mechanism of how signaling fidelity is maintained to the surprising degree we reported.
REFERENCES
Adelaja, A., Taylor, B., Sheu, K.M., Liu, Y., Luecke, S., Hoffmann, A., 2021. Six distinct NFκB signaling codons convey discrete information to distinguish stimuli and enable appropriate macrophage responses. Immunity 54, 916-930.e7. https://doi.org/10.1016/j.immuni.2021.04.011
Akira, S., Takeda, K., 2004. Toll-like receptor signalling. Nat Rev Immunol 4, 499–511. https://doi.org/10.1038/nri1391
Andridge, R.R., Little, R.J.A., 2010. A Review of Hot Deck Imputation for Survey Non-response. Int Stat Rev 78, 40–64. https://doi.org/10.1111/j.1751-5823.2010.00103.x
Cheng, Z., Taylor, B., Ourthiague, D.R., Hoffmann, A., 2015. Distinct single-cell signaling characteristics are conferred by the MyD88 and TRIF pathways during TLR4 activation. Sci Signal 8, ra69. https://doi.org/10.1126/scisignal.aaa5208
Davies, A.E., Pargett, M., Siebert, S., Gillies, T.E., Choi, Y., Tobin, S.J., Ram, A.R., Murthy, V., Juliano, C., Quon, G., Bissell, M.J., Albeck, J.G., 2020. Systems-Level Properties of EGFR-RAS-ERK Signaling Amplify Local Signals to Generate Dynamic Gene Expression Heterogeneity. Cell Systems 11, 161-175.e5. https://doi.org/10.1016/j.cels.2020.07.004
Guo, X., Adelaja, A., Singh, A., Roy, W., Hoffmann, A., 2025a. Modeling single-cell heterogeneity in signaling dynamics of macrophages reveals principles of information transmission. Nature Communications.
Guo, X., Adelaja, A., Singh, A., Wollman, R., Hoffmann, A., 2025b. Modeling heterogeneous signaling dynamics of macrophages reveals principles of information transmission in stimulus responses. Nat Commun 16, 5986. https://doi.org/10.1038/s41467-025-60901-3
Hanson, R.L., Batchelor, E., 2022. Coordination of MAPK and p53 dynamics in the cellular responses to DNA damage and oxidative stress. Molecular Systems Biology 18, e11401. https://doi.org/10.15252/msb.202211401
Huang, Y., Zhang, Q., Lubas, M., Yuan, Y., Yalcin, F., Efe, I.E., Xia, P., Motta, E., Buonfiglioli, A., Lehnardt, S., Dzaye, O., Flueh, C., Synowitz, M., Hu, F., Kettenmann, H., 2020. Synergistic Toll-like Receptor 3/9 Signaling Affects Properties and Impairs Glioma-Promoting Activity of Microglia. J. Neurosci. 40, 6428–6443. https://doi.org/10.1523/JNEUROSCI.0666-20.2020
Kellogg, R.A., Tian, C., Etzrodt, M., Tay, S., 2017. Cellular Decision Making by Non-Integrative Processing of TLR Inputs. Cell Rep 19, 125–135. https://doi.org/10.1016/j.celrep.2017.03.027
Kumar, R., Clermont, G., Vodovotz, Y., Chow, C.C., 2004. The dynamics of acute inflammation. Journal of Theoretical Biology 230, 145–155. https://doi.org/10.1016/j.jtbi.2004.04.044
Luecke, S., Guo, X., Sheu, K.M., Singh, A., Lowe, S.C., Han, M., Diaz, J., Lopes, F., Wollman, R., Hoffmann, A., 2024. Dynamical and combinatorial coding by MAPK p38 and NFκB in the inflammatory response of macrophages. Molecular Systems Biology 20, 898–932. https://doi.org/10.1038/s44320-024-00047-4
Luecke, S., Sheu, K.M., Hoffmann, A., 2021. Stimulus-specific responses in innate immunity: Multilayered regulatory circuits. Immunity 54, 1915–1932. https://doi.org/10.1016/j.immuni.2021.08.018
Paek, A.L., Liu, J.C., Loewer, A., Forrester, W.C., Lahav, G., 2016. Cell-to-Cell Variation in p53 Dynamics Leads to Fractional Killing. Cell 165, 631–642. https://doi.org/10.1016/j.cell.2016.03.025
Peterson, A.F., Ingram, K., Huang, E.J., Parksong, J., McKenney, C., Bever, G.S., Regot, S., 2022. Systematic analysis of the MAPK signaling network reveals MAP3K-driven control of cell fate. Cell Systems 13, 885-894.e4. https://doi.org/10.1016/j.cels.2022.10.003
Sheu, K.M., Guru, A.A., Hoffmann, A., 2023. Quantifying stimulus-response specificity to probe the functional state of macrophages. Cell Systems 14, 180-195.e5. https://doi.org/10.1016/j.cels.2022.12.012
Son, M., Wang, A.G., Keisham, B., Tay, S., 2023. Processing stimulus dynamics by the NF-κB network in single cells. Exp Mol Med 55, 2531–2540. https://doi.org/10.1038/s12276-023-01133-7
Stuart, T., Butler, A., Hoffman, P., Hafemeister, C., Papalexi, E., Mauck, W.M., Hao, Y., Stoeckius, M., Smibert, P., Satija, R., 2019. Comprehensive Integration of Single-Cell Data. Cell 177, 1888-1902.e21. https://doi.org/10.1016/j.cell.2019.05.031
Werner, S.L., Barken, D., Hoffmann, A., 2005. Stimulus Specificity of Gene Expression Programs Determined by Temporal Control of IKK Activity. Science 309, 1857–1861. https://doi.org/10.1126/science.1113319
Werner, S.L., Kearns, J.D., Zadorozhnaya, V., Lynch, C., O’Dea, E., Boldin, M.P., Ma, A., Baltimore, D., Hoffmann, A., 2008. Encoding NF-kappaB temporal control in response to TNF: distinct roles for the negative regulators IkappaBalpha and A20. Genes Dev 22, 2093–2101. https://doi.org/10.1101/gad.1680708
RRID: CVCL_0248
DOI: 10.1038/s41420-026-02945-y
Resource: (RRID:CVCL_0248)
Curator: @evieth
SciCrunch record: RRID:CVCL_0248
RRID: CVCL_2478
DOI: 10.1038/s41420-026-02945-y
Resource: (KCB Cat# KCB 2011103YJ, RRID:CVCL_2478)
Curator: @evieth
SciCrunch record: RRID:CVCL_2478
RRID: CVCL_0006
DOI: 10.1038/s41420-026-02945-y
Resource: (RRID:CVCL_0006)
Curator: @evieth
SciCrunch record: RRID:CVCL_0006
RRID:IMSR_CRL:490
DOI: 10.1038/s41420-026-02945-y
Resource: (IMSR Cat# CRL_490,RRID:IMSR_CRL:490)
Curator: @scibot
SciCrunch record: RRID:IMSR_CRL:490
RRID:AB_2538347
DOI: 10.1038/s41420-026-02945-y
Resource: None
Curator: @scibot
SciCrunch record: RRID:AB_2538347
RRID:AB_2074533
DOI: 10.1038/s41420-026-02945-y
Resource: (BioLegend Cat# 333610, RRID:AB_2074533)
Curator: @scibot
SciCrunch record: RRID:AB_2074533
RRID:SCR_002798
DOI: 10.1038/s41420-026-02945-y
Resource: GraphPad Prism (RRID:SCR_002798)
Curator: @scibot
SciCrunch record: RRID:SCR_002798
RRID:SCR_012773
DOI: 10.1038/s41420-026-02945-y
Resource: KEGG (RRID:SCR_012773)
Curator: @scibot
SciCrunch record: RRID:SCR_012773
RRID:AB_2892682
DOI: 10.1038/s41420-026-02945-y
Resource: (Cell Signaling Technology Cat# 24595, RRID:AB_2892682)
Curator: @scibot
SciCrunch record: RRID:AB_2892682
RRID:AB_2799771
DOI: 10.1038/s41420-026-02945-y
Resource: (Cell Signaling Technology Cat# 70076, RRID:AB_2799771)
Curator: @scibot
SciCrunch record: RRID:AB_2799771
RRID:SCR_016418
DOI: 10.1038/s41420-026-02945-y
Resource: pheatmap (RRID:SCR_016418)
Curator: @scibot
SciCrunch record: RRID:SCR_016418
RRID:SCR_024568
DOI: 10.1038/s41420-026-02945-y
Resource: Illumina NovaSeq X Plus (RRID:SCR_024568)
Curator: @scibot
SciCrunch record: RRID:SCR_024568
RRID:AB_3086478
DOI: 10.1038/s41420-026-02945-y
Resource: None
Curator: @scibot
SciCrunch record: RRID:AB_3086478
RRID:AB_2721573
DOI: 10.1038/s41420-026-02945-y
Resource: (BioLegend Cat# 374203, RRID:AB_2721573)
Curator: @scibot
SciCrunch record: RRID:AB_2721573
RRID:AB_2894766
DOI: 10.1038/s41420-026-02945-y
Resource: (Bio X Cell Cat# BE0347, RRID:AB_2894766)
Curator: @scibot
SciCrunch record: RRID:AB_2894766
RRID:AB_2722564
DOI: 10.1038/s41420-026-02945-y
Resource: (Proteintech Cat# SA00001-2, RRID:AB_2722564)
Curator: @scibot
SciCrunch record: RRID:AB_2722564
RRID:AB_262044
DOI: 10.1038/s41420-026-02945-y
Resource: (Sigma-Aldrich Cat# F1804, RRID:AB_262044)
Curator: @scibot
SciCrunch record: RRID:AB_262044
RRID:AB_2722565
DOI: 10.1038/s41420-026-02945-y
Resource: (Proteintech Cat# SA00001-1, RRID:AB_2722565)
Curator: @scibot
SciCrunch record: RRID:AB_2722565
RRID:AB_3675963
DOI: 10.1038/s41420-026-02945-y
Resource: None
Curator: @scibot
SciCrunch record: RRID:AB_3675963
RRID:AB_2721282
DOI: 10.1038/s41420-026-02945-y
Resource: (Advanced Immunochemical Cat# 2-RGM2, RRID:AB_2721282)
Curator: @scibot
SciCrunch record: RRID:AB_2721282
RRID:SCR_003070
DOI: 10.1038/s41420-026-02945-y
Resource: ImageJ (RRID:SCR_003070)
Curator: @scibot
SciCrunch record: RRID:SCR_003070
RRID:AB_887714
DOI: 10.1007/s12035-026-05709-y
Resource: (Synaptic Systems Cat# 115 002, RRID:AB_887714)
Curator: @evieth
SciCrunch record: RRID:AB_887714
RRID:AB_2083165
DOI: 10.1007/s12035-026-05709-y
Resource: (Abcam Cat# ab21679, RRID:AB_2083165)
Curator: @evieth
SciCrunch record: RRID:AB_2083165
RRID:AB_476743
DOI: 10.1007/s12035-026-05709-y
Resource: (Sigma-Aldrich Cat# A5316, RRID:AB_476743)
Curator: @evieth
SciCrunch record: RRID:AB_476743
RRID:AB_228341
DOI: 10.1007/s12035-026-05709-y
Resource: (Thermo Fisher Scientific Cat# 31460, RRID:AB_228341)
Curator: @evieth
SciCrunch record: RRID:AB_228341
RRID:AB_2286949
DOI: 10.1007/s12035-026-05709-y
Resource: (Abcam Cat# ab32127, RRID:AB_2286949)
Curator: @evieth
SciCrunch record: RRID:AB_2286949
Addgene_13483
DOI: 10.1186/s12964-025-02640-y
Resource: None
Curator: @scibot
SciCrunch record: RRID:Addgene_13483
Addgene_12259
DOI: 10.1186/s12964-025-02640-y
Resource: RRID:Addgene_12259
Curator: @scibot
SciCrunch record: RRID:Addgene_12259
addgene_12260
DOI: 10.1186/s12964-025-02640-y
Resource: RRID:Addgene_12260
Curator: @scibot
SciCrunch record: RRID:Addgene_12260
plasmid_10838
DOI: 10.1186/s12964-025-02640-y
Resource: RRID:Addgene_10838
Curator: @scibot
SciCrunch record: RRID:Addgene_10838
RRID:Addgene_64638
DOI: 10.1186/s12964-025-02640-y
Resource: RRID:Addgene_64638
Curator: @scibot
SciCrunch record: RRID:Addgene_64638
RRID:Addgene_20011
DOI: 10.1186/s12964-025-02640-y
Resource: RRID:Addgene_20011
Curator: @scibot
SciCrunch record: RRID:Addgene_20011